灾害天气研究进展
2016-07-31
灾害天气
灾害天气研究进展
1 灾害天气监测
1.1 华南云降水微物理结构观测和综合分析
在2016年华南暴雨外场试验期间,利用Ka波段云雷达、C波段连续波雷达和激光云高仪等设备,获取了华南云降水垂直结构综合数据;利用X波段相控阵天气雷达和X波段双线偏振雷达,获取了强对流三维结构数据,这些数据在云降水机理研究方面得到应用。分析了云雷达、C波段连续波雷达和激光云高仪探测能力,提出了3种数据的融合方法,形成了数据融合数据,利用这些数据分析和改进了华南夏季云降水的统计特征,包括云底和云底高度日变化、不同高度云发生频次变化、不同高度云和降水分类的回波强度概率分布等(图1)。(刘黎平,阮征,崔哲虎)
1.2 雷达成果的集成和业务应用
(1)与中国气象局数值预报中心等合作,研发了适应于雷达数据模式同化的新一代天气雷达质量控制软件系统,通过了中国气象局预报与网络司组织的评估。同时,研发了涵盖所有型号新一代天气雷达(包括上海WSR-88D双线偏振雷达)的质量控制软件系统,实现了全部的新一代天气雷达质量控制,为雷达数据同化提供技术支撑。(王红艳,刘黎平,李丰)
(2)建立风廓线雷达质控软件系统,在广州市气象局业务运行为短临预报提供支持,该系统在中国气象局气象探测中心业务试运行,提交中国气象局数值预报中心进行模式试验,并在中国气象科学研究院业务系统中运行,提供面向科研的支撑(图2)。(阮征,李丰)
(3)集成实验室多年的双线偏振雷达质量控制、降水估测、相态识别、短临预报等成果,研发了北京市气象局X波段双线偏振雷达数据处理和短临预报系统,实现了试运行。(刘黎平,胡志群,王红艳)
(4)与河南电力研究院合作,研发的新一代天气雷达飑线和对流系统识别软件系统成功应用于河南、浙江和新疆电力部门。(刘黎平,王红艳)
1.3 多种观测设备在多个科研项目上开展的外场试验
在“华南暴雨RDP外场试验”和“第3次青藏高原大气科学试验——边界层和对流层观测”项目中,云雷达、激光雷达、X波段相控阵天气雷达和C波段偏振雷达数据应用于云降水微物理和动力结构观测,形成了多种遥感手段反演高原和华南对流系统空气上升速度、云水/云冰/雨水/雪水的垂直廓线的反演方法。(刘黎平,胡志群)
2 青藏高原研究
2.1 青藏高原感热、潜热通量对湍流、对流结构的影响
基于第3次青藏高原大气科学试验11个站点的观测结果,分析了青藏高原和周边地区大气近地层陆面参数和湍流特征。大涡模拟试验表明,青藏高原近地层感热、潜热通量可影响湍流和对流结构,也可显著影响对流云中液态水含量异常变化。数值模拟可揭示出青藏高原特殊的“爆米花”对流云特征可能的成因。(王寅钧,徐祥德)
2.2 基于高原试验获取的高原西部自动探空观测资料和“内插猜估”插值方案的新资料变分同化试验
基于高原试验获取的高原西部申扎、改则、狮泉河3站自动探空观测资料,设计了“内插猜估”探空观测资料的插值构造方案,并将“内插猜估”后得到的新探空数据同化到数值模式当中。数值试验中降水分析结果表明,将青藏高原西部有限探空观测数据以及经过“内插猜估”后的探空数据进行同化后,降水的TS评分均得到提高,其中“内插猜估”试验中,降水的TS评分提高更为明显。(张胜军,徐祥德)
2.3 青藏高原对流结构及其与下游暴雨过程的关联性
基于高原地区独特情况,建立了一个新的高原对流系统(TCS)提取方法,从而剔除了高原卷云和卷层云的影响。对TCS的季节变化特征进行了统计分析,发现各季节高原对流对青藏高原及其下游地区降水都具有重要贡献。通过暴雨过程及其前期水汽输送通量、涡度、散度三维结构综合相关分析,揭示了长江流域大范围持续暴雨发生、发展过程中青藏高原上游势-流函数场动力系统三维结构“强信号”特征。(胡亮,徐祥德)
2.4 青藏高原大气水分循环的势-流函数解析
基于青藏高原大地形热力、动力效应引起的绕流、爬流特征,采用大气运动场的流函数与势函数场,以更清晣地描述青藏高原热力驱动相关联的区域-全球多尺度环流特征。通过势函数风结构揭示出青藏高原大地形区域水汽流入、流出与辐散-辐合综合物理图像。另外,通过流函数场剖析大气环流动力结构特征,以凸显青藏高原热力驱动下的高层反气旋、低层气旋性耦合环流动力结构,并探讨此类高原特殊动力结构在大地形与大气环流系统、波流相互作用中的贡献,揭示高原热力、动力过程对东亚、全球大气水分循环的影响及其水汽交换输送多尺度源-汇结构(图3)。(徐祥德)
2.5 中国东部暴雨水汽输送结构综合相关模型
中国东部暴雨频数分布状态呈东南高频区向西北方向的大地形边缘带逐步递减,这与中国3阶梯大地形与梅雨边缘带走向一致,其也反映出东部暴雨频数分布与梅雨带季节性演变、水汽输送强弱及其与大地形动力、热力影响等因素存在某种相关关系。研究表明了中国东部整层水汽输送结构及其环流型特征与中国东部暴雨极端事件发生频数亦显著相关。(徐祥德)
2.6 三江源区大气的水汽来源、输送途径及其空间结构特征
夏季三江源区短时输送的水汽主要来自于青藏高原以及其西北侧陆地区域,而更长时间(8~10天)的来源可追踪到阿拉伯海和孟加拉湾等远距离海洋区域;水汽输送通道主要有2支,第1支为沿着索马里海到阿拉伯海的跨赤道水汽输送,第2支为在西风控制下从中亚乃至西亚地区向三江源区的输送(图4)。(陈斌)
2.7 青藏高原与太平洋/大西洋热力作用对北半球陆地夏季风年际变化的协同影响
青藏高原加热可以调整高原与太平洋之间的垂直环流,进而调节太平洋地区的凝结潜热加热和干绝热加热,导致该地区对流层中上层的温度异常,最终对夏季亚洲-太平洋涛动(APO)的年际变化产生重要影响。夏季亚洲季风区降水与北美中纬度降水存在显著负相关,形成洲际间的降水异常型,而与北美季风降水存在正相关,这种降水异常型与春夏季欧亚(包括青藏高原)和北美陆地加热及热带中东太平洋海温的异常有密切联系。(刘舸,赵平,陈军明)
3 暴雨研究
3.1 华南季风降水试验进展
灾害天气国家重点实验室暴雨研究团队自2013年以来牵头推进世界气象组织(WMO)世界天气研究计划(WWRP)“华南季风降水试验”(SCMREX 2013—2018)研究发展项目,SCMREX旨在通过外场观测以及物理机制和对流可分辨模拟研究提高华南前汛期强降水预报水平。其实施内容含4个组成部分:外场观测,资料管理,强降水事件物理机制研究,以及包括资料同化影响、模式物理过程表达方案检验与改进、集合预报试验等对流可分辨数值试验。2016年利用比2013—2015年更多的先进设备开展了华南暴雨外场观测试验,加密观测期(IOP)从2017年5月1日连续运行至6月15日。已经收集了试验期间的业务观测网和移动设备观测资料,并纳入了SCMREX资料库。进行了SCMREX数据库和网站的维护和升级,并改进了SCMREX网站(http://scmrec.cma.gov.cn)。SCMREX网站上添加了往年加密观测期间主要强降水事件的文字描述以及雷达、卫星、闪电等图形,并且在机理研究、资料同化影响、模式云降水微物理过程参数化方案检验和改进、集合预报试验等各方面取得了新的进展。2016年10月SCMREX首席科学家罗亚丽研究员向WMO热带气象研究工作组汇报了最新进展,得到包括WMO季风委员会主席Chie-Pei Chang教授在内的工作组专家的高度肯定。暴雨团队牵头全面总结了SCMREX 2013—2015年的进展,形成的综述性论文发表在《美国气象学会通报》(BAMS)(罗亚丽)。
3.2 华南前汛期暴雨机理研究
暴雨研究团队利用SCMREX获取的最新综合性观测资料,研究发现华南前汛期沿海极端强降水是由长生命史的中尺度对流系统(MCS)产生的,这些MCS的维持时间、组织结构、准静止等特点与前汛期的环境大气热动力条件密切相关:这些MCS发生在盛行的低层西南气流中,即使没有低空急流也能输送足够的水汽,华南复杂的下垫面特征(如海陆对比、海岸线附近和内陆都分布着山脉)有利于持续的对流初生,MCS的一系列反馈作用(如,对流产生的冷出流边界处常常发生连续对流初生)。图5给出了如何基于雷达观测和地面中尺度分析来估计中尺度冷出流边界的厚度。分析了华南前汛期降水日变化特征,指出华南前汛期日变化存在3种传播模态:(i)发生在华南西部上午的东传或东南传降水日变化模态,这种模态主要与增强的低空西南急流及其造成的低空辐合有关;(ii)发生在午后华南东部与局地暖湿环境有关的准静止模态;(iii)发生在日间沿海向内陆传播的与海陆风有关的降水日变化模态,这种模态在季风爆发后更为显著(图5)。(罗亚丽,宝兴华,姜智娜)
3.3 我国极端小时降水研究
综合分析自动气象站雨量计观测、天气图、组合雷达反射率等资料,利用客观和人工判断相结合的天气背景识别方法,分析了从海南岛至东北地区的我国东部广大地区的极端小时降水的天气背景。小时降水(>0.1 mm/h)的季节变化显示降水发生频次和强度具有复杂的区域特征,因此采用99.9百分位定义各个台站的极端小时降水的阈值。极端降水在华南沿海和华北平原最强,1981—2013年期间,77%的极端小时降水发生在夏季,峰值(30.4%)出现在7月。根据天气背景类型将2011—2015年大约5800个极端小时降水分为4种类型:低涡/切变型、弱天气尺度强迫型、地面锋面型、热带气旋型,它们分别占总频次的39.1%、39.0%、13.9%和8.0%,并且具有各自不同的区域分布及日变化和季节变化特征。热带气旋型在东南和华南沿海最为频繁,深入内陆锐减;地面锋面型在104°E以东分布比较均匀;低涡/切变线型在四川盆地有一个显著的高频中心,从这个中心朝着东南和东北方向伸展出2个高频带;弱天气尺度强迫型在东南、西南和华北以及东北的最东部地区发生比较频繁。中尺度对流系统与更小尺度的系统对弱天气尺度强迫型的发生频次的贡献相当,但是二者发生频次较高的地点有所差异。(罗亚丽)
3.4 我国中东部地闪统计特征及其与降水的关系
利用我国6年地闪观测资料和TRMM观测资料,对我国中东部地区的地闪时空活动规律进行了统计研究,并对比分析了其与降水的关系。结果表明,地闪频次在夏季(冬季)最高(最低),且正地闪比例最低(最高)。华北地区夏季地闪频发,而冬季地闪多发生在长江流域。最大地闪活动中心位于广东中部地区,地闪密度达9次/(km2·a),珠江三角洲北部年平均闪电日达70天以上,其次是长江中下游地区和四川盆地及周边地区。在地形复杂的华北地区和四川盆地及周边地区,其西部的高山区雷暴日数大于东部平原(盆地)区,但地闪密度明显小于后者,这与高山地区频发的短时午后雷暴有关。地闪频次在8月最高,而对流性降水在5月或7月达到峰值。四川盆地及其周边山区暖季降水峰值出现在夜间,而除此以外的我国东部平原地区暖季降水日变化存在2个峰值,其中午后的峰值对应着地闪频次的峰值;而夜间到清晨的降水峰值对应的闪电活动较少,缘于此阶段层状降水比例增大。(夏茹娣)
3.5 海南岛降水时空分布规律
基于5年高分辨率地面和探空观测资料的统计分析和数值试验,开展海南岛降水时空分布规律原因探究,揭示了环境条件对降水时间分布规律的影响和环境风、地形和海风环流对降水空间分布的综合作用机理。结果表明,4—9月的高湿度和有效位能、低自由对流高度和弱垂直风切变使该时期为海南岛的显著降水时期。弱环境风速、低地形和海风环流共同作用使得强降水容易在背风坡海岸生成,并在不同环境风向下产生不同传播特点。(梁钊明)
3.6 华南飑线精细结构分析
利用双多普勒风场反演技术,研究了2007年4月24日影响广东省的一次飑线的形成机理和三维结构,给出了此次飑线的三维结构概念模型。相对风暴的自后向前的干冷气流从层状云3 km的低层进入飑线;相对风暴的自前向后的气流从对流线中低层进入飑线内部,在7.5 km高度分成2支气流,一支流向前部,另一支则流向层状云区。(周海光)
4 台风研究
4.1 海温对热带气旋(TC)加强的影响
利用1988—2014年北大西洋热带气旋(TC)最佳路径资料及全球再分析资料研究发现,TC所处的海温不仅决定TC最大可能强度(MPI),还决定了TC最大可能加强速度(MPIR),海温和MPIR之间存在指数关系。研究发现,随着海温增加,TC的加强速度和MPIR也增大,当海温大于27 ℃时,MPIR随海温增加迅速增大。而且,TC的加强速度在高海温低垂直切变的区域会更大,这也说明虽然海温可以决定MPIR,但是实际的TC加强速度还受着环境因素的影响,比如环境垂直风切变。本项研究不仅提出了很好的台风加强研究思路,同时也为业务预报提供了较好的理论依据。(徐晶,王玉清)
4.2 西北太平洋高空冷涡(UTCL)对热带气旋(TC)活动的影响
利用中国气象局最佳路径资料与全球再分析格点数据,对2000—2012年西北太平洋热带气旋(TC)及其间高空冷涡(UTCL)的活动以及它们的相互关系进行统计分析。结果表明,346个TC中73%在其生命史存在UTCL活动,其中21%与UTCL中心相对距离小于15经/纬距,即二者可能发生相互作用。进一步分析发现,该距离内UTCL对TC运动和强度变化均存在一定影响。与整个太平洋TC运动状况相比,尽管UTCL的存在从整体上并没有增加TC移向的突变比例,但对于特定方位角和相对距离,UTCL对TC运动的影响是显著的,比如5经/纬距内TC易发生突然左折。UTCL对强度变化的影响主要发生在TC的发生和初期发展时期,当二者进入相互作用距离,在12 h内约45%的TC强度增强,38%维持,仅有17%强度减弱。增强TC主要位于UTCL的南侧,减弱主要位于其北侧。对于TC强度的迅速变化,迅速加强(RI)容易在UTCL东东南象限和南西南象限发生。TC迅速减弱(RW)的样本则大多出现在UTCL的西侧(图6)。(李英,魏娜,张大林)
5 雷电研究
5.1 青藏高原闪电活动与对流云结构的关系
基于自主研制的地基全天空云观测系统观测并分析了高原日喀则地区的云量、云状等分布特征,发现日喀则地区的云量和云状都呈现明显的季节分布。基于TRMM卫星降水特征(PFs)资料,分析了高原产生闪电的对流云和没有产生闪电的云结构特征及差异性。研究表明,产生闪电的PFs的面积比无闪电发生的PFs的面积要大一个量级。高原东北部(青海地区)产生闪电的PFs尺度普遍在1400 km2以上。高原东南部(中心29°N、97°E附近)产生闪电的PFs尺度最小,极小值在500 km2以下。高原上产生闪电的PFs的云高要比没有产生闪电的PFs的云高2~4 km。高原上产生闪电的PFs的云顶高度在中南部最高,可到12 km以上,藏南附近区域最低,低于10 km。高原产生闪电的PFs的20 dBz最大高度与分布于喜马拉雅山以南的平原相当但略小,而40 dBz的最大高度大于喜马拉雅山以南地区。产生闪电的PFs的平均闪电密度在高原的西部和东北部地区较大。(张义军,郑栋,吕伟涛,孟青,杨俊,姚雯,马颖,王飞)
5.2 特种观测资料同化及雷电灾害天气系统的监测预警方法
(1)利用水汽混合比与闪电频数、霰混合比的经验关系式,建立了SAFIR3000全闪辐射源资料与相对湿度的经验关系,并在WRF-3DVar同化系统中实现对全闪定位资料的连续循环同化。利用基于WRF-Electric模式搭建的雷电活动短时预报平台,连续开展2个汛期的雷电活动预报试验,并对试验结果进行初步检验。初步完成利用雷电临近预警系统与中尺度起放电模式相耦合实现0~12 h雷电预报方法的方案设计,以弥补原有仅靠外推算法时效性短的缺陷,进而提升雷电的预警预报效果(图7)。(徐良韬,姚雯,张荣)
(2)对10次中尺度对流系统雷达和地闪数据的综合分析发现,层云地闪首次回击电流峰值通常要大于对流地闪首次回击的电流峰值。层云地闪一般在最大反射率核心(≥30 dBz)分布在3~6 km高度的区域边缘或者围绕该区域接地。这一区域的反射率特征与回波亮带特征具有一致性,表明亮带区域的电荷结构对层云闪电的激发或者传播可能具有重要影响。这一结果为研究亮带和层云地闪之间的关系提供了一个重要证据,也为层云地闪预警方法的研究提供了一条理论依据(图8)。(王飞)
5.3 闪电初始阶段特征与雷暴结构的时空配置关系
进一步完善了低频电场变化探测阵列(LFEDA)的方法和技术,并在广东进行了闪电活动观测试验,获取了大量雷暴过程的闪电放电探测数据,初步完成了对LFEDA的性能评估。基于位于LFEDA站网内的人工触发闪电的评估表明其具有良好的探测性能,对触发闪电和回击的探测效率分别达到了100%和95%,平均定位误差达到102 m。将雷暴演变过程中LFEDA的三维总闪定位结果与雷达回波结合也表明LFEDA具有可靠的探测能力。此外,基于LFEDA数据分析了一次云闪个例和一次地闪个例先导过程的通道发展特征,获得了与通道发展的一些相关参量,这些分析表明LFEDA具有描述闪电三维通道的能力。
研究分析了一次超级单体组合体过程的闪电起始特征。发现闪电起始位置主要被霰、干雪、小雹和冰晶4类粒子主导,对应的闪电起始占总闪电的比例分别为44.3%、44.1%、8.0% 和3.0%。在南部超级单体发生龙卷的阶段,与霰粒子对应的闪电起始主导超级单体的主体区域以及它的右侧和前侧;与干雪对应的闪电起始主导前侧云砧、右侧云砧和后侧云砧的外围区域;与小雹对应的闪电起始则主要集中在上升气流区的周围,更偏向主上升气流区的前侧。高密度的闪电起始对应差分反射率弧的位置和右侧云砧的区域。平均闪电起始高度的分布呈现自后侧向前侧和自右侧到左侧逐渐降低的趋势,同时,从闪电起始位置高度分布范围看,其最大范围出现在上升气流区的前侧。研究表明,起始自前侧云砧区域的闪电尺度最大,然后是那些起始自上升气流区前侧和接近差分反射率弧的区域。研究支持了关于电荷口袋的概念,并进一步推测在右侧云砧区的电荷口袋分布量最大和最为紧凑,所有导致该区域频繁的闪电起始,但对应闪电尺度小,闪电起始的垂直范围浅薄。(郑栋,张阳,张义军,孟青,张文娟,徐良韬,黄治钢)
5.4 雷暴上升运动与起电和放电活动关系的模拟
利用一个三维起电放电数值模式,研究了上升运动与雷暴中主要的起电活动和放电活动的关系。结果发现,上升运动在对闪电活动的发展(在此以闪电活动中和电荷率表征)起到主要促进作用的同时,还对闪电活动的增强起着抑制作用。上升运动有利于非感应起电活动的发生,但过强的上升运动则不利于非感应起电效率的进一步提高。模拟个例中具有较高起电效率的非感应起电活动基本发生在上升速度小于20 m/s的上升运动区内。此外,上升速度中心的高度在闪电活动的多数时间里与反转温度的高度基本保持一致,可以用来区分霰粒子非感应起电获得不同极性电荷区域的分界。(王飞)
5.5 雷电重大灾害天气系统的动力过程和演变规律
利用多种观测资料和高分辨率数值模式,对2个发生在不利大尺度背景下的局地雷暴过程进行研究,重点分析了触发过程。研究表明,北京地区周边雷暴系统的冷池出流、局地地形和北京城市复杂下垫面特征等均会对局地雷暴的发生产生重要影响。对2015年7月中旬京津冀地区持续性夜间雷雨天气开展了初步分析,发现傍晚到夜间的低层上升运动更强,水汽输送和辐合更充分,层结更不稳定,均有利于降水在傍晚和夜间发生。对多雨多闪、多雨少闪和少雨多闪等3类事件的背景环流合成分析表明,多雨多闪和多雨少闪事件均发生在高层有异常正辐散、中层槽和低层有西南气流输送水汽的背景下,而少雨多闪事件主要是由山区地面加热作用引起,中高层天气尺度强迫较弱;多雨多闪事件的环境场拥有相对高的对流有效位能(CAPE)和LI以及较小的对流抑制能量(CIN),而多雨少闪事件多发生在夜间,CAPE和CIN值较小;少雨多闪事件发生在相对中等强度的CAPE和0~6 km垂直风切变环境场中。
明确了超级单体中闪电起始对应水成物粒子类型、闪电起始密度、高度、垂直范围等特征。构建了闪电起始特征与超级单体结构的关系模型。发现大、小电流地闪气候活动在自身特性和时空分布上存在显著差异性,这种差异性随季节和下垫面而变化。(张大林)
5.6 雷电物理过程研究、雷电探测技术发展和外场观测试验
继续开展广东闪电综合观测试验,在人工触发闪电实现、放电过程精细化观测、雷暴的全闪探测以及雷电物理过程研究等方面获得了显著进展。(1)成功人工触发闪电13次,触发闪电成功率约72%,无论是触发次数还是成功率,都保持了较高的水平。(2)发展了连续干涉仪精细化定位技术,建设了3天线阵列的观测系统,实现了触发闪电和自然闪电全放电过程通道发展的高时间分辨率、精细化描绘。(3)进一步完善了闪电低频电场探测阵列并开展观测,获取了6—11月从化地区雷暴过程的云闪、地闪及NBE事件的脉冲放电信息,实现了闪电放电通道初步可分辨的全闪三维定位。此外,开展了高原地区低频电场探测阵列的站点考察,并完成2个子站的建设。(4)获得了对先导始发先驱脉冲、不规则先导发展特征及物理过程的新认识,并发现了大电荷转移过程M分量、连续电流及回击的相关性。(5)广州高建筑物雷电观测大幅提升了先导过程的高速光学观测能力及不同强度的电磁场辐射信号的完整记录能力,得到了先导梯级发展的精细化特征,给出了负极性地闪连接过程中下行负先导和上行连接先导的2种基本的连接行为(图9)。(吕伟涛,张阳,郑栋,张义军,姚雯,马颖,黄治钢,徐良韬,齐奇)
6 模式关键技术和再分析资料研究
6.1 天气气候一体化模式关键技术研究
在模式动力框架方面,在广泛调研当今国际趋势的基础上,建立了正二十面体网格生成器,并基于该网格建立了球面平流方程求解器和浅水方程求解器;在正二十面体网格上建立了正定的两步保形平流方案,测试显示该方案目前可以很好地运行于正二十面体网格,计算效果与之前在经纬度网格上的效果相当。在物理过程方面,为改善该耦合模式中大气顶辐射收支不平衡问题,引入一个新的云辐射方案(BCC_RAD),显著改善了大气顶辐射收支的平衡状况,并显著改善东亚层云区冷季短波云辐射强迫的模拟。在模式耦合技术方面,本年度基于美国国家大气研究中心(NCAR)的CESM模式以及耦合器CPL7,替换大气和海洋分量模式,逐步建立一个新分量的海-陆-气-冰耦合系统,由此掌握高分辨率耦合模拟的耦合技术; 实现耦合模式和MPI-M水文模式耦合,径流通过水文模块进入海洋,完成了全球水量循环的闭合,模式具备气候系统模式所需的完备分量。在耦合模式同化方面,基于中国气象科学研究院现有的耦合气候系统模式版本,引进了中国科学院大气物理研究所发展的EnOI-IAU同化方法,基于耦合模式同化海洋温盐廓线资料(弱耦合同化),并开展了年代际气候预测回报试验(图10~11)。(张祎,陈昊明,容新尧,李建)
6.2 东亚区域大气再分析攻关任务
完成了东亚区域大气再分析系统搭建并进行初步测试。对2014年7月进行了试验(不同化观测资料),并进一步优化模式参数组合。开展了2014年6—8月的模拟,并基于模拟结果进行了背景误差协方差的统计计算和与默认背景协方差矩阵初步的对比。完善了同化流程,开展了再分析同化试验。为了突出东亚区域再分析特色,开展关键资料的分析研究,即对未参加国际交换的探空资料、地基GPS/Met、卫星导风、雷达资料等资料进行了同化试验。结合观测试验开展观测试验资料同化试验,通过与高原试验项目的联合开展了高原试验资料同化试验并完成1个月资料的同化运行;通过与华南季风观测试验团队的合作,基于华南观测试验资料开展了模式云物理过程的比对与优化。(梁旭东,尹金方,陈锋,刘英,何会中,周海波,郝世峰)
7 信息网络支撑
完成中国气象科学研究院重点工作“科研数据共享平台”项目建设,在此基础上整合了华南季风降水试验数据共享网站和第3次青藏高原大气科学试验项目网站。2016年汛期开始向中国气象科学研究院内部用户开放使用。承担完成了网络信息安全检查工作10多项,完成了院网站挂标和集约化网站群建设。升级和扩容了高性能存储系统,增强了数据服务的支持能力。完成中国气象科学研究院信息系统运维管理与技术支持,保证对外服务网站全年无安全事故(图12)。(高梅,张文华,李斌,李丰,赵盛华,朱孔驹)

图1 2016年7月10日在广东龙门观测的回波强度的时间高度图:(a)Ka波段云雷达(CR)、C波段调频连续波(FMCW)垂直观测雷达(CVPR)和激光云高仪(CEIL)融合的回波强度;(b)剔除杂波后的回波强度;(c)融合数据的资料来源。((a)(b)中黑点为激光云高仪观测的云底,(c)中蓝色和黄色分别表示云雷达和C波段调频连续波垂直观测雷达观测数据,紫色为杂波)Fig. 1 Time-height cross-sections of reflectivity on 10 July 2016 in Longmen, Guangdong: (a) the merged reflectivity from Ka band cloud radar, C band frequency modulated continuous wave (FMCW) vertical pointing radar (CVPR) and a laser ceilometer(CEIL); (b) reflectivity after removing clutters; (c) data resources of reflectivity. The black dots in (a) and (b) indicate the CEIL-derived cloud-base heights. In (c), data from CR and CVPR, and clutters are shaded in blue, yellow and purple, respectively

图2 风廓线雷达质控软件系统及同化试验结果Fig. 2 Wind prof ler radar (WPR) data quality control (QC) scheme and numerical assimilation experiment

图3 青藏高原热力驱动区域-全球水分循环多尺度特征Fig. 3 Regional to global multi-scale characteristics of the heat-induced atmospheric water tower over the Tibetan Plateau

图4 夏季(6-8月)到达三江源空气块诊断的E-P场Fig. 4 The summer seasonal mean (July-August) of E-P calculated using all air parcels reaching the TRHR

图5 2015年5月20日5个时刻汕尾S波段雷达的PPI图(其中:(a~e)为仰角1.5°的径向风速度,黑色圆圈代表距地高度250 m、500 m、750 m和1000 m;(f~j)为仰角2.5°的雷达回波反射率,黑色圆圈代表距地高度600 m、1000 m和2000 m。黑色虚线框为关键区,棕色虚线表示根据地面自动站观测估计的中尺度边界的大致位置)Fig. 5 PPI analysis of Shanwei S-band radar at 5 selected times on 20 May 2015: (a-e) the radical velocity at 1.5° elevation(m s-1), with the black circles denoting the height of 250 m, 500 m, 750 m and 1000 m MSL, respectively; (f-j) the reflectivity at 2.5° elevation (dBz), with the black circles denoting the height of 600 m, 1000 m and 2000 m MSL, respectively, with the black rectangle box representing the control region with extreme accumulated rainfall, the brown dashed lines representing the approximate locations of the surface mesoscale boundary based on the surface observations

图6 12 h加强(a)和12 h减弱(b)热带气旋(TC)中心相对于高空冷涡(UTCL)中心(0点)空间分布(黑色点显示快速增强/减弱TC位置)Fig. 6 The spatial frequency distribution of TCs within a 15° distance from the composite UTCL center during the subsequent (a)12 h intensifying, (b) 12 h weakening. Black dots denote the locations of TCs experiencing rapid intensity changes

图7 观测和模拟的6 h闪电活动分布Fig. 7 The observed and simulated 6-hour accumulated lightning

图8 雷达组合反射率与对流地闪(白色实心●)、层云-对流地闪(○)和层云地闪(×)的接地位置(a)及图(a)中黄色实线位置的雷达反射率垂直剖面(b)Fig. 8 (a) Composite radar reflectivity, overlain with the return stroke points of CCGs (white dots), SCCGs (○) and SCGs (×); (b)Vertical reflectivity prof le along the yellow segment in (a)

图9 连续干涉仪甚高频定位结果(左)、LFEDA低频定位结果(右)和下行先导图像(下)Fig. 9 VHF location of continuous INTF (left), LF location of LFEDA (right) and image of downward leader (below)
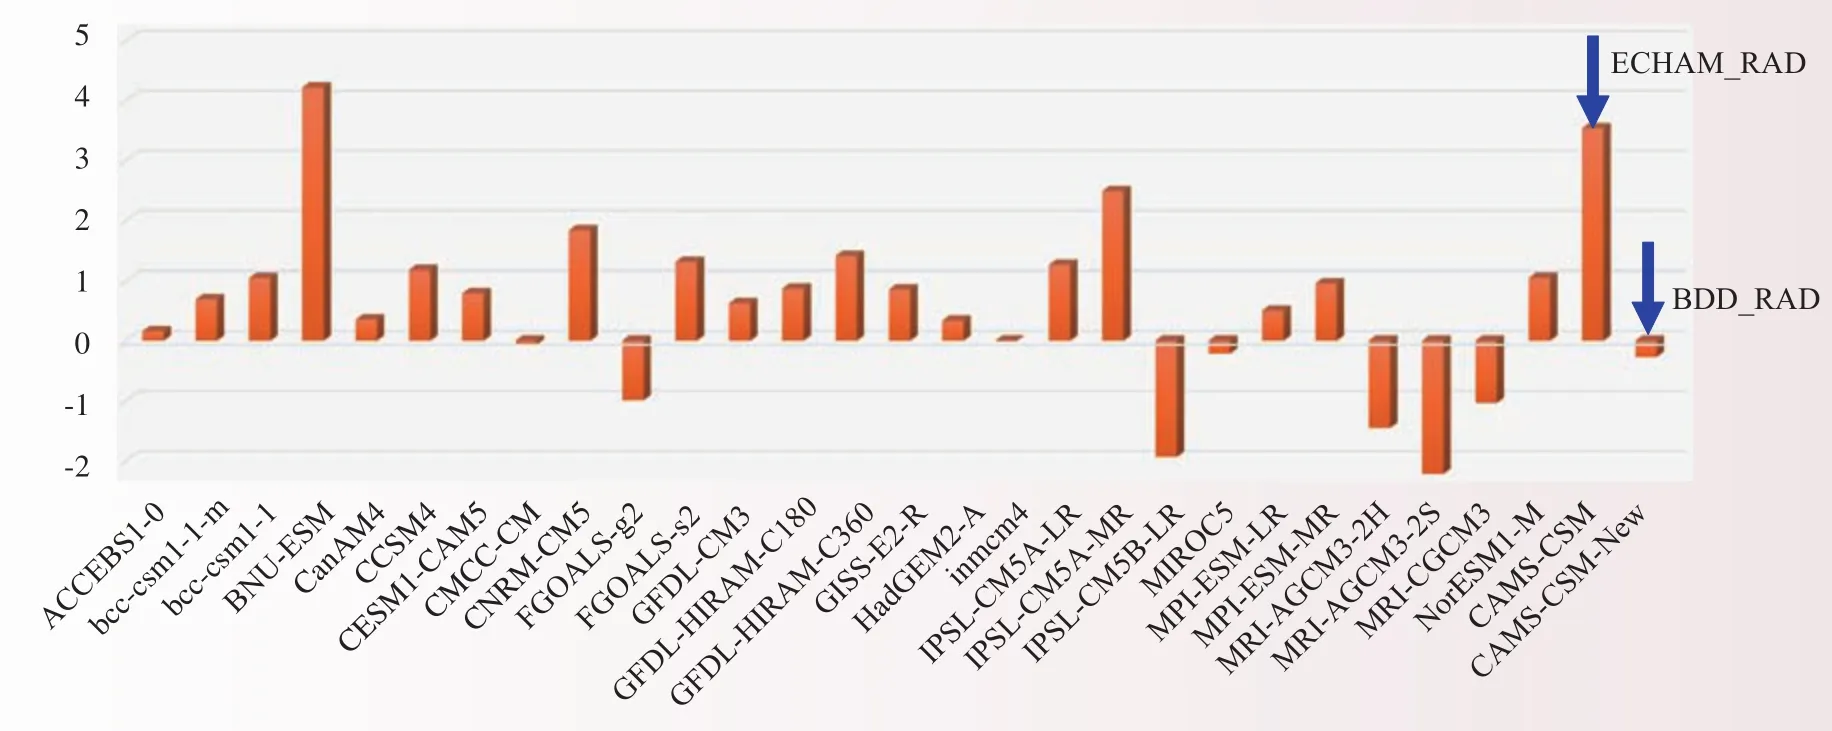
图10 气候模式模拟的全球平均大气顶净能量收支(从左至右分别为27个参加CMIP5的模式及CAMS_CSM和采用BCC_RAD方案的CAMS_CSM的结果)Fig. 10 Global annual mean residual energy (unit: W/m2) at the model top in 27 CMIP5 models and CAMS_CSM with different radiation schemes
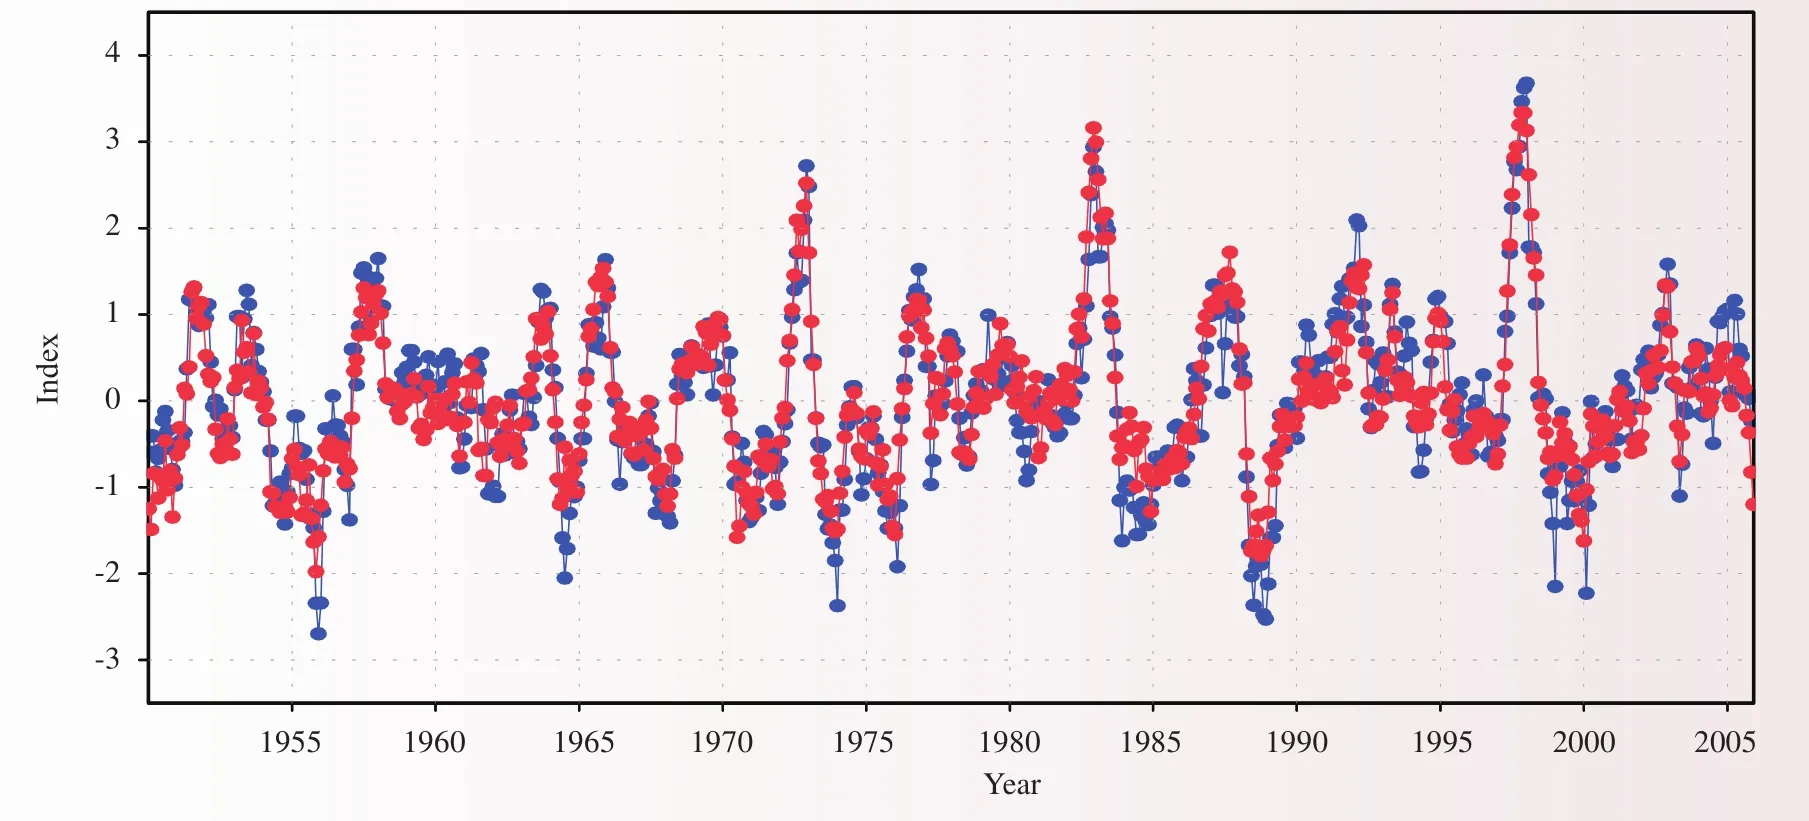
图11 观测(HadISST,红色)和同化(蓝色)的Nino3海温指数Fig. 11 Observed (HadISST, red) and assimilated (blue) Nino3 index

图12 气象科研数据共享平台Fig. 12 Meteorological scientific and research data sharing platform
Advances in Severe Weather Research
1 Severe weather monitoring technology
1.1 Observation and analysis of microphysical structures of cloud and precipitation over South China
To improve our understanding of the cloud and precipitation properties in South China, the field campaigns were carried out by Chinese Academy of Meteorological Sciences (CAMS). Vertical structures of nonprecipitating and precipitating clouds,3D structures of strong convective precipitations have been observed with X-band phased array radar and X-band polarization radars, a K-band solid-state transmitter cloud radar (CR), a C-band frequency modulated continuous wave (FMCW) vertical pointing radar (CVPR)and a laser ceilometer (CEIL) in Guangdong Province, China. The observational abilities of CR, CVPR radars and CEIL were examined to construct merged cloud-precipitation radar dataset that can be used to analyze statistically the vertical characteristics of clouds and precipitations in South China, including valid rate of observations, cloud-base and cloud-top height estimates and reflectivity distributions (Fig.1). (Liu Liping,Ruan Zhen, Cui Zhehu)
1.2 Integration and operational application of outcomes from radar
(1) The software system of new-generation operational radar data quality control (QC) for radar data assimilation was developed by LaSW, CAMS, in cooperation with the Numerical Weather Prediction Center of CMA, which passed the evaluation organized by Department of Forecasting and Networking of CMA. The radar data QC system for all types of radar in CMA was also developed and used in radar data assimilation.(Wang Hongyan, Liu Liping, Li Feng)
(2) The Wind Profiler Data Quality Control System (WPDQCS) is operated in the Guangzhou Meteorological Bureau to provide support for nowcasting, with its test run in the Meteorological Observation Center of CMA to give the support for GRAPES-MESO data assimilation experiment. It is also operated in the operation system of CAMS to provide support for scientific research (Fig. 2).(Ruan Zhen, Li Feng)
(3) The Beijing Meteorological Bureau dual linear polarization radar processing and nowcasting software systems were developed and used in operational test to realize radar data QC, QPE, hydrological distinguish and nowcasting. (Liu Liping, Hu Zhiqun, Wang Hongyan)
(4) The software systems for squall and convective warning were used in Henan, Zhejiang and Xinjiang electrical power bureaus, in cooperation with Henan electrical power institute. (Liu Liping, Wang Hongyan)
1.3 Field experiment on cloud and precipitation in scienti fic projects
In the Southern China Monsoon Rainfall Experiment (SCMREX) that was endorsed by the World Meteorological Organization (WMO) as a Research Demonstration Project (RDP) of the World Weather Research Programme (WWRP), and the Third Tibetan Plateau Atmospheric Scientific Experiment (TIPEX-Ⅲ),cloud radar, lidar, X-band phased array radar and C-band dual linear polarization radar were used to observe the microphysical and dynamical structures in clouds and precipitation over the Tibetan Plateau and South China. The vertical motion, cloud water/cloud ice/precipitation/snow contents were documented, the diurnal variations of several important cloud properties were analyzed, including cloud top and base, cloud depth,cloud cover, number of cloud layers, and their vertical structures, during summertime over the Tibetan Plateau and South China. (Liu Liping, Hu Zhiqun)
2 Research on weather over the Tibetan Plateau
2.1 The effects of surface sensible heat flux (H) and latent heat flux (LE) on the structures of
convection and turbulence over the Tibetan Plateau (TP)
Based on results from 11 flux sites during the Third Tibetan Plateau (TP) Atmospheric Scientific Experiment (TIPEX-Ⅲ), land surface parameters and the turbulence characteristics of the atmospheric surface layer over the TP and surrounding regions were analyzed. The large eddy simulations (LES) illustrate that H and LE in the surface layer can have an effect on the structures of convection and turbulence, which also have great impact on the anomalous variations of the liquid water content (LWC) in convective clouds over the TP.The simulations reveal the possible cause of the formation of the special “popcorn clouds” over the TP. (Wang Yinjun, Xu Xiangde)
2.2 Design of a new so-called “interpolation guess” scheme based on the limited automatic sounding observational data on western plateau obtained from the TIPEX-Ⅲ, and its use in data assimilation
A new interpolation scheme of the “interpolation guess” method was designed using the automatic sounding observational data at Shenzha, Gaize, Shiquanhe stations on western plateau from TIPEX-Ⅲ (the Third Tibetan Plateau Atmospheric Scientific Experiment), and more sensitivity experiments were conducted to evaluate the effect on the numerical simulations after all these new data were assimilated into the numerical model. The numerical simulation results indicate that the Threat Score (TS) for the simulated rainfall in the numerical experiments with both the automatic sounding observation only at three stations and with the new data after the “interpolation guess” method has been higher than that in the control experiment without data assimilation, with the improvement of the TS in the experiment with the new method being more obvious than that in the experiment with the original method. (Zhang Shengjun, Xu Xiangde)
2.3 The correlation between Tibetan Convective Systems (TCS) and the hard rain over its downstream regions
A new definition of TCS was introduced to exclude the effects of cirrus and cirrostratus over the Tibet.Based on the new definition, 2032 TCSs were selected and analyzed to study their seasonal variation. The result shows that TCSs play an important role in precipitation over the Tibetan Plateau and its adjacent regions in all four seasons. By analyzing the three-dimensional structure of the water vapor flux, vorticity and divergence prior to and during the heavy rainfall events, the upstream “strong signals” related to heavy rainfall events were revealed. (Hu Liang, Xu Xiangde)
2.4 The use of potential/stream function to analyze the water vapor cycle over the Tibetan Plateau
Based on the understanding of climbing and deflective flows caused by large topography of the Tibetan Plateau (TP) and the “midair heat island” thermal-driven divergence-convergence structure, the kinetic fields were decomposed into stream function and potential function fields. The atmospheric water tower over the TP can be clearly depicted from the water vapor flux and its regional-to-global multi-scale characteristics can be analyzed. The wind vectors of potential function can portrait the regional water vapor fluxes into and out of the TP and their three-dimensional physical diagram. Meantime, the wind vectors of the stream function can anatomically reflect the dynamic structure of the atmospheric circulation, particularly the anticyclonic-aloft-cyclonic-beneath coupled kinematic structure. With this analysis framework, we examined the dynamic structure caused by the TP topography, its unique atmospheric circulation, and the wave- flow interaction. We further illustrated impact of the dynamic and thermodynamic processes over the TP on the regional-to-global water vapor cycle and the sink and source of the multi-scale transport of water vapor (Fig. 3). (Xu Xiangde)
2.5 The integrated model of moisture transport in heavy rainfall in eastern China
The spatial distribution of summer rainstorm frequency in eastern China is higher in the southeast and lower in the northeast, which is very similar to the distribution of the “staircase” topography. The similarity in the pattern of the three-step staircase topography and the rain bands suggests a strong link between the rainstorm frequency and seasonal migration of Meiyu, moisture transport by monsoonal flow, dynamic and thermodynamic influence of large-scale topography. It is showed that column-integrated moisture transport and moist flow pattern in the summer over eastern China yield great in fluence on the frequency of extreme rainstorms. (Xu Xiangde)
2.6 The Three-River Headwaters Region moisture sources, pathways and its spatio-temporal structure
The major moisture sources contributed to the Three-River Headwaters Region (TRHR) summer water vapor with relatively short transport timescales (less than 7 days) are mainly originated from the Tibetan Plateau and its northwestern regions, while the moisture transport with longer timescale (8–10 days) could be tracked back from the long-distance oceanic regions, particularly the Bay of Bengal and Arabian Sea. There are two moisture channels: One is related to the moisture located in the southern Indian Ocean crossing the equator nearby the Somalian coastal region; another stems from the central and western Asia (Fig. 4). (Chen Bin).
2.7 Collaborative influences of the Tibetan Plateau and the Pacific/Atlantic on the interannual variations of the land monsoon in the Northern Hemisphere
The Tibetan Plateau (TP) heating can modulate the vertical circulations between the Tibetan Plateau and the Pacific, and therefore regulates the condensation latent heat and dry adiabatic heat over the Pacific, which leads to mid-upper-tropospheric temperature anomalies in situ and ultimately affects the interannual variability of the summer Asian-Pacific Oscillation (APO). The precipitation over the Asian monsoon region was significantly and negatively correlated with that over the mid-latitudes of North America, and was positively correlated with that over the North American monsoon region, constituting an intercontinental contrasting Asian-North American (CANA) precipitation anomaly pattern. The CANA precipitation anomaly pattern was closely related to the land heating of Eurasian (including the Tibetan Plateau) and North America and sea surface temperature (SST) anomalies in the tropical central and eastern Pacific during spring and summer. (Liu Ge, Zhao Ping, Chen Junming)
3 Heavy rainfall research
3.1 Progress of the South China Monsoon Rainfall Experiment
Since 2013, the Heavy Rainfall Research Group at LaSW/CAMS has been leading the South China Monsoon Rainfall Experiment (SCMREX), a unique program for improving heavy rainfall forecasts over South China during the pre-summer rainy season through field campaigns and research on physical mechanisms and convection-permitting modeling, which was endorsed by the World Meteorological Organization (WMO) as a Research Demonstration Project (RDP) of the World Weather Research Programme (WWRP). The SCMREXRDP (2013–2018) consists of four major components: Field campaign, database management, studies on physical mechanisms of heavy rainfall events, and convection-permitting numerical experiments including impact of data assimilation, evaluation/improvement of model physics, and ensemble prediction. During 1 May–15 June 2016, the SCMREX-2016 intensive observing period (IOP) ran continuously with more portable instruments than those participated in the 2013–2015 IOPs. All the datasets from the operational network and portable instruments have been collected and archived in the SCMREX database with both hardware and data management being upgraded. The SCMREX website (http://scmrex.cma.gov.cn) is also improved in this year with description and images (radar, satellite, and lightning) of major heavy rainfall events during the previous IOPs being added. Moreover, new results are achieved by the studies on physical mechanisms of heavy rainfall, impact of radar data assimilation on QPF, improvement of model cloud microphysics schemes,and development and evaluation of convection-permitting ensemble forecast system. In October 2016, Chief Scientist of SCMREX RDP, Dr. Luo Yali, made a progress report at the WMO Tropical Meteorological Research Working Group Meeting, which was highly praised by the experts at the meeting including the chair of the WMO Monsoon Panel, Prof. Chie-Pei Chang. The progress of SCMREX during 2013–2015 is summarized in a paper that is published in theBulletin of American Meteorological Society. (Luo Yali)
3.2 Studies on heavy rainfall during the pre-summer rainy season
Utilizing the newest, comprehensive observations collected during the SCMREX IOPs, studies by the Heavy Rainfall Research Group suggest that extreme daily rainfall in South China during the pre-summer rainy season was produced by long-lived MCSs with a line alignment of convective cells that favored persistent and large rainfall accumulation over the same region. The characteristics of the extreme-rain-producing MCSs during SCMREX that led to heavy rainfall (duration, organizational patterns, and quasi-stationary behavior) appear to be attributable to the characteristics of the environmental dynamic and thermodynamic conditions during the pre-summer rainy season. Namely, these systems occurred in prevailing low-level southwesterly monsoonal flows providing sufficient moisture, even without the presence of an LLJ, over the complex underlying surfaces in South China (e.g., land/sea contrast, and mountains near the coasts and inland facilitating continuous convective initiation), and within a series of feedbacks from MCSs (i.e., convectively generated cold out flow boundaries where continuous convective initiation usually takes place), as discussed by Wang et al. (2014) and Wu and Luo (2016). As an example, Fig.5 shows how we estimate the depth of a mesoscale cold outflow boundary based on radar observations combined with surface mesoscale analysis.The diurnal cycle of rainfall (DCR) over South China during the pre-summer rainy season is also examined.Three propagating modes accounting for the pre-summer DCR are found: (i) An eastward- or southeastwardpropagating mode occurs mostly over southwestern China that is associated with the enhanced transport of warm and moist air from tropical origin and the induced low-level convergence; (ii) A quasi-stationary mode over the east of South China appears locally in the warm sector with weak-gradient flows; (iii) An inland propagating mode occurs during the daytime in association with sea breezes along the southern coastal regions,especially evident throughout the post monsoon-onset period (Fig. 5). (Luo Yali, Bao Xinhua, Jiang Zhina)
3.3 Synoptic analysis of extreme hourly precipitation in China
Synoptic situations associated with extreme hourly precipitation over the extensive eastern China from Hainan Island to Northeast China are investigated using rain gauge data, weather maps, and composite radar reflectivity data, with both objective and subjective approaches to identify the types of synoptic patterns.Seasonal variations of hourly precipitation (0.1 mm h-1) suggest complicated regional features in the occurrence frequency and intensity of rainfall. The 99.9th percentile is thus used as the threshold to define the extremehourly rainfall for each station. The extreme rainfall is the most intense over the southern coastal areas and the North China Plain. About 77% of the extreme rainfall records occur in summer with a peak in July (30.4%)during 1981–2013. Nearly 5800 extreme hourly rainfall records during 2011–2015 are classified into four types according to the synoptic situations under which they occur: The tropical cyclone (TC), surface front,vortex/shear line, and weak-synoptic forcing. They contribute 8.0%, 13.9%, 39.1%, and 39.0%, respectively,to the total occurrence and present distinctive characteristics in regional distribution and seasonal or diurnal variations. The TC type occurs most frequently along the coasts of Southeast and South China and decreases progressively toward inland China; the frontal type is distributed relatively evenly in the east of 104°E; the vortex/shear line type shows a prominent center over the Sichuan Basin with two high-frequency bands extending from the center southeastward and northeastward, respectively; the weak-synoptic type occurs more frequently in Southeast, Southwest, and North China, and in the easternmost area of North China. Occurrences of the weak-synoptic type have comparable contributions from mesoscale convective systems and smallerscale storms with notable differences in their preferred locations. (Luo Yali)
3.4 Characteristics of cloud-to-ground lightning and its relationship with rainfall over central and eastern China
The cloud-to-ground (CG) lightning climatology and its relationship with rainfall over central and eastern China are examined, using 32 million CG lightning flashes data and TRMM (Tropical Rainfall Measuring Mission) measurements during a 6-year period of 2008–2013. Results show substantial spatial and temporal variations of flash density across China. Flash counts are the highest (lowest) in summer (winter) with the lowest (highest) proportion of positive flashes. CG lightning over North China is more active only in summer,whereas in winter CG lightning is more active only in the Yangtze River Valley. The highest CG lightning density exceeding 9 and more than 70 CG lightning days yr-1are found in the northern Pearl River Delta region, followed by the Sichuan Basin, the Yangtze River Delta and the southeastern coast in order. Lowerflash-density days occur over mountainous regions due to the development of short-lived afternoon storms,while higher-flash-density days, typically associated with nocturnal thunderstorms, appear over the North China Plain and Sichuan Basin. The highest CG lightning flashes take place in August whereas monthly convective rainfall peaks in May or July. Flash rates during the warm season are typically maximized in the afternoon hours in coincidence with a convective rainfall peak except for Sichuan Basin and its surrounding mountainous areas where a single late-night convective rainfall peak dominates. Much less lightning activity corresponds to a late night to morning rainfall peak over plains in eastern China due to the increased proportion of stratiform rainfall during that period. (Xia Rudi)
3.5 Characteristics of the temporal and spatial distributions of precipitation over Hainan Island
The causes of the temporal and spatial distributions of precipitation over Hainan Island, including the influences of environmental conditions on the temporal distribution of precipitation and the combined effect of synoptic winds, orography and sea-breeze circulation on the spatial distribution of precipitation,are investigated and discussed, based on the statistical analyses of 5-year high-resolution surface and sounding observations and numerical experiments. The results show that the high humidity and convective available potential energy (CAPE), unstable atmospheric stratification, low free convection level (LFC) and weak vertical wind shear associated with southwesterly during April–September lead to large amounts of precipitation over Hainan Island, along with the beneficial effect of sea-breeze front’s (SBF’s) convergence tendency under weak synoptic wind conditions. Pronounced precipitation is apt to occur over the leeward side of the mountain under the in fluences of weak synoptic winds, low mountain and sea-breeze circulation.Moreover, different propagation features are shown for precipitation depending on different synoptic wind directions. (Liang Zhaoming)
3.6 Analysis of the detailed structure of the squall line over South China
Based on dual-Doppler weather radar retrieved wind, the mechanism and 3D structure of the squall line on 24 April 2007 in Guangdong Province were analyzed. The conceptual model of the squall line was also developed. In the wide trailing stratiform region, the rear-to-front cold in flow enters the squall line below the altitude of 3 km. The storm-relative front-to-rear warm flow enters the squall line from the lower and middle level of the leading edge. Above 7.5 km height, part of the front-to-rear in flow moves forward and part of the in flow slopes gradually into the trailing stratiform region. (Zhou Haiguang)
4 Typhoon research
4.1 The relationship between sea surface temperature and maximum potential intensi fication rate of tropical cyclones over the North Atlantic
An empirical relationship between sea surface temperature (SST) and the maximum potential intensification rate (MPIR) of tropical cyclones (TCs) over the North Atlantic is developed based on best track TC data and observed SST during 1988–2014. Similar to the empirical relationship between SST and the maximum potential intensity (MPI) of TCs previously documented, results from this study show a nonlinear increasing trend of MPIR with SST. That is the IR showing a general increasing trend with increasing SST as well with a more rapid increasing trend with higher IR when SST is greater than 27 ℃.The analysis shows that about 29% of Atlantic TCs reach 50% of their MPIR, and only 6% reach 80% of their MPIR at the time when they are at the lifetime maximum intensification rate. Moreover, a TC tends to have a larger intensification rate during its lifetime when it is located in a higher SST region and lower VWS, indicating that SST is not only critical for TC IR but also determines the MPIR. In addition, a theoretical basis for the MPIR has also been provided based on a previously constructed simplif ed dynamical system for TC intensity prediction, and the theoretical result is well in agreement with the observational f tted MPIR with longer data records over a wide range of SST. (Xu Jing, Wang Yuqing)
4.2 A statistical analysis of the relationship between UTCL and tropical cyclone track and intensity change over Western North Paci fic
The geographical and temporal characteristics of upper tropospheric cold lows (UTCLs) and their relationship with tropical cyclone (TC) track and intensity changes over the Western North Pacific (WNP)during 2000–2012 are examined using the best track TC data and global meteorological re-analysis data. An analysis of the two datasets shows that 73% of 346 TCs coexist with UTCLs, and 21% of them coexist with TCs within an initial cut-off distance of 15º, within which interactions could occur. By selecting those coexisted systems within this distance, we find possible in fluences of UTCLs on TC track and intensity changes,depending on their relative distance and on the sectors of UTCLs where TCs are located. Results show that the impact of UTCLs on TC directional changes are statistically insignificant when averaged within the 15º radius.However, left-turning TCs within 5º distance from the UTCL center tend to occur abrupt turnings. Results also show that TCs seem to interact with an UTCL during their early development stages. Intensifying (weakening)TCs are more distributed in the southern (northern) sectors of UTCLs. In addition, rapid intensifying TCs take place in the east-southeastern and south-southwestern quadrants of UTCLs, whereas rapid weakening cases appear in the western semicircle of UTCLs (Fig. 6).(Li Ying, Wei Na, Zhang Dalin)
5 Lightning research
5.1 Study on the relationship between lightning activity and structure of convective clouds in Qinghai-Tibet Plateau
Based on the observation of the home-grown Total-Sky Cloud Imager, the cloud cover and cloud type over Shigatse are analyzed and found to change with seasons. Meanwhile, the dataset of Precipitation Features(PFs) derived from the observation of TRMM satellite is introduced to study the structures of clouds with lightning and without lightning over the Tibet Plateau. The area of PFs with lightning is an order of magnitude larger than that of the PFs without lightning. The horizontal area of PFs with lightning is generally above 1400 km2over the northeastern plateau, while the minimum is below 500 km2over the southeast (centered near 29°N, 97°E). Over the plateau, cloud height of PFs with lightning is 2−4 km higher than that of PFs without lightning. The maximum cloud height of PFs with lightning is over southern-central plateau with the value above 12 km, and minimum height is less than 10 km near the southern Tibetan region. The maximum height of 20 dBz radar reflectivity over the plateau is similar and slightly smaller than that over the plain to the south of Himalaya region, but the maximum height of 40 dBz radar reflectivity over the plateau is higher than that over the plain. PFs with lightning over western and northeastern plateau have larger mean lightning density than in other regions. (Zhang Yijun, Zheng Dong, Lü Weitao, Meng Qing, Yang Jun, Yao Wen, Ma Ying, Wang Fei)
5.2 Assimilation of special observation data and research on detecting and forecasting methods for severe thunderstorms
(1) The empirical relationship between flash rate, water vapor mixing ratio and graupel mixing ratio was used to adjust the model relative humidity, which was then assimilated using the three-dimensional variation data-assimilation method in WRF-3DVar system in cycling mode with 10 min intervals. A short-range lightning prediction platform was constructed based on the WRF-Electric model. Two flood season prediction experiments were carried out and the prediction results were preliminarily assessed. The basic scheme which blended the Lightning Nowcasting and Warning System (CAMS_LNWS) and mesoscale numerical weather prediction was designed to improve the 0−12 hour lightning prediction (Fig. 7). (Xu Liangtao, Yao Wen, Zhang Rong)
(2) Based on the comprehensive analysis on the data of radar and lightning from 10 mesoscale convective systems (MCSs), it has been found that the first return stroke currents of stratiform cloud-to-ground (CG)lightning flashes are usually greater than that of convective lightning flashes. Most of stratiform CG lightning flashes strike the ground under the verge of or around the area in stratiform region of MCS, where the reflectivity core (≥30 dBz) locates in the height range of 3−6 km. This characteristic of reflectivity core is consistent with that of brightband. It suggests that the charge structure of the stratiform region with brightband may have an important in fluence on initiation or propagation of stratiform lightning. This result provides a vital evidence for research of the relationship between stratiform lightning and brightband and a theoretical basis for the development of stratiform CG lightning warning (Fig. 8). (Wang Fei)
5.3 The temporal and spatial relationship between the initial characteristics of lightning and the thunderstorm structure
The location method and technology of lightning Low-Frequency Electric-f led Detection Array (LFEDA),which is running in Guangdong with the aim to detect the lightning activity in three-dimensions, were furtherimproved. Based on LFEDA, we conducted the lightning observational experiment, obtained good data and then investigated the performance of LFEDA and obtained some preliminary results. The LFEDA shows a fine performance in the location of the triggered lightning flashes (TLFs) which were carried out in the inner of the network of the LFEDA, with the detection efficiency for TLFs and return strokes being 100% and 95%,respectively, and the average location error being 102 m. The combination of the three-dimensional locations of the total lightning during the evolution of thunderstorms with the radar echo also support the reliable performance of LFEDA. In addition, two examples including an intra-cloud lightning and the leader of a cloudto-ground lightning are exhibited, while some parameters associated with the initial propagation of channels are also counted according to the location data. The analysis proves that LFEDA is capable of describing the three-dimensional channel of lightning to some extent.
Flash initiations within a supercell cluster during 10–11 May 2010 in Oklahoma were investigated based on observations from the Oklahoma Lightning Mapping Array and the Norman, Oklahoma, polarimetric radar(KOUN). The flash initiations at positions dominated by graupel, dry snow, small hail and crystals accounted for 44.3%, 44.1%, 8.0% and 3.0% of the total flashes, respectively. During the tornadic stage of the southern supercell in the cluster, flash initiations associated with graupel occupied the main body, the right flank and the forward flank of the supercell, while those associated with dry snow dominated the outskirts of the adjacent forward anvil, right anvil and rear anvil. The flash initiations associated with small hail were concentrated around the main updraft, particularly toward its front side. Highly dense flash initiations were located in the regions overlying the differential reflectivity (ZDR) arc and right anvil. The average initial height of the flashes decreased gradually from the rear to the front and from the right to the left flanks, while the height range over which initiations occurred reached a maximum at the front of the updraft. The flashes that were initiated in the adjacent forward anvils were the largest on average, followed by those in the regions ahead of the updraft and near the ZDR arc. This study supports the concept of charge pockets and further deduces that the pockets in the right anvil are the most abundant and compact due to the frequent flash initiations, small-sized flashes and thin layers including flash initiations. (Zheng Dong, Zhang Yang, Zhang Yijun, Meng Qing, Zhang Wenjuan, Xu Liangtao, Huang Zhigang)
5.4 Model study on the relationship between the updraft and the charging and discharging processes in thunderstorms
Using a 3D charging-discharging numerical model, the relationship between the updraft and the charging and discharging processes in thunderstorms was analyzed. The results show that the enhancement of updraft restricts the strengthening of lightning activity (here represented by the neutralized charge rate of lightning flashes per minute) while the promoting effect of updraft to lightning activity is still dominant as observations. In the simulation case, the non-inductive charging process with high charging efficiency always occurs within or near the updraft region with the updraft speed less than 20 m s-1. In addition, the height of updraft core agrees with the height of reversion temperature roughly in most of lightning activity. It can be used to separate the regions within which graupel is charged with opposite polarity through the non-inductive charging process. (Wang Fei)
5.5 Dynamical processes and structural evolution in severe thunderstorms
The developments and especially convective initiation (CI) of two local severe storms over the Beijing metropolitan region under unfavorable larger-scale conditions are examined using various observations and high-resolution model simulations. Results reveal that the important roles of the UHI effects, mountain morphology, and convectively generated pressure perturbations in determining the CI location and timing of isolated thunderstorms during the summer months. An analysis of larger-scale environments associated with high rainfall rates and high frequency of cloud-to-ground (CG) lightning flashes (HRHL), high rainfall ratesand low frequency of CG lightning flashes (HRLL), and low rainfall rates and high frequency of CG lightning flashes (LRHL) shows that the upper-level jet with anomaly divergence on its right side and the western Pacific subtropical high were favorable for HRHL and HRLL events. The horizontal wind shear and convective instability in the lower troposphere were important for the three categories of events, but their intensities were the weakest in LRHL events. Front activities related closely only to HRHL events. For events with high lightning activities, the lower atmosphere was warmer and wetter than its surrounding areas. Thunderstorm events with high frequency of flash needed better lifting condition, while HRLL events needed small convective inhibition. LRHL events also needed small 0−6 km vertical wind shear and HRHL events needed large CAPE.
Observational and modeling studies are performed to confirm the types of precipitation particles of lightning initiation, and the associated density, altitude and vertical extent in supercell thunderstorms. A conceptual model was developed to describe the relationship between the characteristics of lightning initiation and vertical structures of the supercell storms. It is also found that the climatology of CG lightning activity with strong or weak electric currents differs significantly in their own characteristics and spatio-temporal structures, depending upon the season and underlying surface conditions. (Zhang Dalin)
5.6 Research of lightning discharge process, development of lightning detection technology and conduction out field experiment
During Guangdong Comprehensive Observation Experiment on Lightning Discharge (GCOELD),significant progress in success rate of artificial triggered lightning, detailed observations of lighting discharge process, observations of total flash in thunderstorm and research on lightning physical mechanism has been gained. The specific progress is as follows. (1) The numbers and success rate of triggered lightning are 13 and 72%, respectively, both reaching relatively high levels. (2) Continuous interferometer is developed for detailed positioning of lightning channel, and the corresponding system consisting of a three antenna array is set up, which helped to describe the process of lightning discharge in a detailed and high time-resolution way.(3) We have made a further improvement of LFEDA (Low Frequency Electric-field Detection Array), with which, from June to November, acquired different impulse information during intra-cloud lightning, cloud to ground lightning and NBE events in Conghua. By analyzing these acquired data, we made it possible to get a preliminary 3-dimension positioning result for the total flash. Besides, we have investigated several installation sites for LEFDA in the plateau area, and also built 2 substations for testing. (4) A new sight was built for the development of irregular impulse and precursor impulse related to the initiate of leaders; at the same time, the relevance between M-component and continuous current in large charge transfer progress was discovered. (5)We have significantly improved the optical observation ability for the high-speed leader development process and the ability to record the completed electromagnetic radiation field signals of different magnitudes as well.Due to these updates, we revealed the detailed characteristics of leader development process, meanwhile displayed the two basic connection modes for the downward negative leaders and upward connecting leaders in negative cloud to ground flashes (Fig. 9). (Lü Weitao, Zhang Yang, Zheng Dong, Zhang Yijun, Yao Wen, Ma Ying, Huang Zhigang, Xu Liangtao, Qi Qi)
6 Model and reanalysis data
6.1 Research on weather-climate uni fied model
After the survey of the current international trend of dynamical core development, we selected the icosahedral mesh as the basis of dynamical core development. An icosahedral mesh generator and solvers ofthe transport and shallow water equations are developed. A conservative Two-step Shape-Preserving Advection Scheme (TSPAS) is generalized on the icosahedral mesh. Results show that this scheme works well in such an unstructured grid. The performance is comparable to the previous prototypes on the rectangular mesh.For model physical parameterization, a new correlated k-distribution radiation scheme (BCC_RAD) was incorporated to improve the radiation energy imbalance at the top of model atmosphere (TOA). Results show that the TOA residual energy is greatly reduced, and the shortwave cloud radiative forcing over East Asia is also improved by using BCC_RAD scheme. Based on the NCAR CESM model and the coupler CPL7 and replacing the atmospheric and oceanic components, we developed a new coupled system with new atmosphere,ocean, land and ice components, which allow us to master the high-resolution coupled simulation technique.The MPI-M hydrological model was incorporated into the coupled model to achieve the runoff into the ocean,thus close the global water cycle and the model emerges as a complete climate system model. Based on the previous version of the coupled model, we introduced the EnOI-IAU assimilation scheme developed by LASG/IAP to assimilate the observed temperature and salinity prof le data (weakly coupled assimilation) and perform decadal climate prediction experiments (Fig. 10−11). (Zhang Yi, Chen Haoming, Rong Xinyao, Li Jian)
6.2 Program for tackling key problems in East Asia regional atmospheric reanalysis data
The system for East Asia regional atmospheric reanalysis data has been built and some preliminary tests were made. Based on the system, long term simulations from June to August in 2014 were accomplished,and a background error (BE) covariance matrix was built based on the simulations. Besides, the new BE was compared with the default BE which is given by the Gridpoint Statistical Interpolation (GSI) system.In addition, the assimilation structure is optimized, and a series of assimilation tests for East Asia regional atmospheric reanalysis data have been launched. In order to show the characteristics of the East Asia regional atmospheric reanalysis data, the key datasets of sounding, GPS/Met, satellite, radar observations, which are not included in the GTS (Global Telecommunication System), were assimilated. A lot of data assimilation experiments were launched by combining the data with field experiments. A whole month experiment was carried out by introducing the data from the third Tibetan Plateau Atmospheric Scientific Experiment(TIPEX-Ⅲ). The cloud microphysical properties over South China have been investigated, and the East Asia regional atmospheric reanalysis data system has been optimized using the observations from the South China Monsoon Rainfall Experiment (SCMREX). (Liang Xudong, Yin Jinfang, Chen Feng, Liu Ying, He Huizhong,Zhou Haibo, Hao Shifeng)
7 Information network support
Upon completion of the CAMS,s keystone project “Scientific research data sharing platform”, we have integrated the South China Monsoon Rainfall Experiment (SCMREX) data sharing website and the third Tibetan Plateau Atmospheric Scientific Experiment website, in use since the 2016 rainy season. We have also completed more than 10 information security check jobs. Building Intensive website group upgraded and expanded high capacity storage system to improve data service support. We have completed the operational maintenance, management and technical support of the CAMS,s information system, ensuring zero security issues (Fig.12). (Gao Mei, Zhang Wenhua, Li Bin, Li Feng, Zhao Shenghua, Zhu Kongju)