The Effect of Chlorophyll Concentration of Paddy Rice on the Fluorescence Spectrum
2016-07-12YANGJianGONGWeiSHIShuoDULinSUNJiaSONGShaleiMAYingying
YANG Jian, GONG Wei, 2, SHI Shuo, 2, DU Lin, 3,SUN Jia, SONG Sha-lei, MA Ying-ying, 2
1. State Key Laboratory of Information Engineering in Surveying, Mapping and Remote Sensing,Wuhan University, Wuhan 430079, China
2. Collaborative Innovation Center of Geospatial Technology, Wuhan 430079, China
3. School of Physics and Technology, Wuhan University, Wuhan 430072, China
4. Wuhan Institute of Physics and Mathematics, Chinese Academy of Sciences, Wuhan 430071, China
The Effect of Chlorophyll Concentration of Paddy Rice on the Fluorescence Spectrum
YANG Jian1, GONG Wei1, 2, SHI Shuo1, 2, DU Lin1, 3,SUN Jia1, SONG Sha-lei4, MA Ying-ying1, 2
1. State Key Laboratory of Information Engineering in Surveying, Mapping and Remote Sensing,Wuhan University, Wuhan 430079, China
2. Collaborative Innovation Center of Geospatial Technology, Wuhan 430079, China
3. School of Physics and Technology, Wuhan University, Wuhan 430072, China
4. Wuhan Institute of Physics and Mathematics, Chinese Academy of Sciences, Wuhan 430071, China
In order to enhance the monitoring of paddy growth, utilize the fertilizer more efficiently, increase crop yield and improve the quality of grain, thus the system of laser-induced fluorescence (LIF) was built. The system was designed to study the relationship between the rice leaf chlorophyll content and fluorescence ratio. In this paper, the samples came from the second upper leaves of paddy in shooting stage and the cultivated area was located in Jianghan plain of China. Firstly, the Kjeldahl method combined with the formula which was described by Zivcak et al. was utilized to calculate the chlorophyll content of paddy, then the fluorescence spectrum of paddy leaf with different chlorophyll content by the instrument of laser-induced fluorescence (the wavelength of excitation 355 nm). Fluorescence spectra of paddy leaf with different chlorophyll content were collected and then a fluorescence spectra database was established. It is discussed that the relationship between the ratio of fluorescence (F740/F685is the ratio of fluorescence intensity of 740 nm dividing that by 685 nm) and the chlorophyll content of paddy. It is found that the effect of chlorophyll content on the fluorescence spectral characteristics is evident. The results demonstrated that it has the tightly positive correlation between the fluorescence ratio (F740/F685) and chlorophyll content of paddy leaf. The determination coefficient (R2) can reach up to 0.901 3 and 0.912 5 at tillering stage and shooting stage, respectively. The experimental analysis showed that the LIF technology has the advantages of convenient, quick and nondestructive, and it has the potential for quantitative monitoring of crop growth.
Laser-induced fluorescence; Paddy rice; Chlorophyll concentration; Quantitative analysis
Introduction
Paddy rice is one of the most important crops in China. Therefore, it is significant to boost production of paddy rice. In the last few decades, some investigations demonstrated that the chlorophyll concentration of paddy rice leaf is a key influential factor for improving grain yield. It is essential to monitor the chlorophyll concentration of paddy rice leaf in the research of agriculture. The technology of laser induced fluorescence (LIF) was proposed by Brewster[1]which could be employed to analyze the photochemical processes running at the level of thylakoid membranes producing Nicotinamide Adenine Dinucleotide Phosphate (NADPH) and adenosine triphosphate (ATP)[2]. What’s more, it could also be utilized to acquire the photosynthesis information of light energy absorption, photochemical reaction and excitation energy transfer[3]. At present, the technology of LIF has been attracted widely attention in remote sensing field and a large number of studies have been done on the monitoring of vegetation growth status and nutrient stress based on chlorophyll fluorescence[4-5].
A few researches demonstrate that the fluorescence spectra of vegetation, which were induced by ultraviolet (UV) excitation light source, have three main fluorescent peaks. The center wavelengths of these fluorescent peak values are 460, 685 and 740 nm, respectively[6]. Researchers found that the center wavelength at 460 nm that is due to the NADPH and trans-b-carotene. In addition, it has also been mentioned that the origin of red fluorescence was chlorophyll and that it had two peaks, one at 685 nm that is due to the photosynthetic reaction of photosystem Ⅱ and another at 740 nm that is due to photosystem Ⅰ[7]. Thus, the chlorophyll content of plant strongly influences the shape of fluorescence spectra. In addition, the remotely sensed chlorophyll fluorescence is tightly correlated with the carbon assimilation rate, the fluorescence ratioF740/F685(F740,F685-intensity of fluorescence at 740 and 685 nm, respectively) was therefore proposed to study the effect of chlorophyll concentration on the production of photosynthesis[8]. For examples, Zivcak et al.[9]discussed the effect of nitrogen deficiency on wheat photosynthetic function based on chlorophyll fluorescence, and Rogers et al.[10]used the LIF to quantitatively analyze the dissolved organic matter concentration in natural waters.
At present, a large number of researches have been done on the detection of plant biomass production and nutrient stress based on fluorescence spectra of vegetation[11], but few investigations have been conducted on the quantitative monitoring of paddy rice chlorophyll concentration. In this paper, the Kjeldahl method combined with the formula which was described by Zivcak et al.[9]was utilized to verify the chlorophyll concentration of paddy rice leaf. A systematic set of LIF spectra data was measured under 355 nm excitation light and the relationship between chlorophyll concentration and fluorescence ratio (F740/F685) was analyzed. Numerical and experimental results showed that there are a tight linear correlation between chlorophyll concentration and fluorescence ratio (F740/F685), the determination coefficient (R2) can reach up to 0.901 3 and 0.912 5 at tillering stage and shooting stage, respectively. Thus, it will be a useful method for detecting quantitatively the chlorophyll concentration of paddy rice leaf, and has great potential for development of precision agriculture.
1 Theory and experiment
1.1 Theory
According to the previous studies, the laser induced fluorescence intensity of plant can be presented as[11]
(1)
Whereλiandλare the excitation wavelength and the fluorescence emission wavelength, respectively;I0(λi) is the intensity of excitation light;A(λi) is the specific absorption coefficient of chlorophyll at incident light wavelength;ρis the concentration of chlorophyll in leaf;δis the fluorescence efficiency at detection wavelength;k1andk2are the extinction coefficients at detection wavelength and incident wavelength of excitation light, respectively.
The exponential function is integrated over the leaf thicknessZ. From the above Eq. (1), the LIF intensity depends on the chlorophyll concentration of plant leaf, and the species of samples. The principle shows that it is possible to analyze and monitor the chlorophyll concentration of paddy rice by using the LIF technology.
1.2 LIF Instrument
Fig.1 is the schematic diagram for the measurement of fluorescence spectra. The excitation source is Nd∶YAG laser with a wavelength of 355 nm, output power of 1.5 mJ, and width per pulse of 5 ns. The fluorescence emission spectra of paddy rice leaf range from 360 to 800 nm with sampling interval of 0.5 nm. Emission fluorescence collected by a telescope and then entered the spectrometer through a single-mode fiber optic with a diameter of 200 μm and 25° angular field of view. In addition, the 355 nm long-pass edge filter was placed between the telescope and the fiber to eliminate the effects of light reflected from the laser. The relationship between the normalized fluorescence intensity and the wavelength is showed in Fig.2.

Fig.1 Schematic of LIF system PC: personal computer; SP: spectrograph; S: sample
2 Results and Discussion
2.1 Fluorescence Spectrum Analysis
The paddy rice was sowed on 27 April, and then transplanted on 1 June, 2014. The experimental rice field is situated in Suizhou City, in the province of Hubei, China. The area is seated in the middle reaches of the Yangze River[5]. The leaf chlorophyll content was obtained spectrophotometrically from acetone extract, and calculated using the equation which was described by Zivcak et al.[9]. Fig.2 is fluorescence spectra of paddy rice leaf with the 355 nm excitation light in different chlorophyll concentration. In Fig.2, the chlorophyll concentration are 1.8, 2.16, 2.41, 2.78, 3.24, 3.83 and 4.66 mg·g-1(designated asa,b,c,d,e,fandg), respectively. It is shown that the fluorescence spectra of paddy rice have three main fluorescence peak values at 460, 685 and 740 nm, respectively. In addition, fluorescence peak values at wavelength of 685 and 740 nm, mainly emitted by chlorophyll, increase with the increasing of chlorophyll concentration. The variation tendency is similar to the studying of Janusauskaite, et al.[12]and demonstrate that different chlorophyll concentration can be identified based on fluorescence spectra.
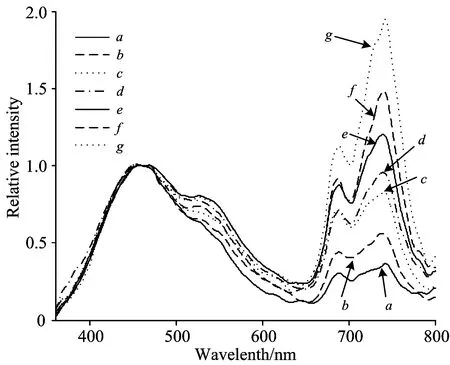
Fig.2 The relationship between the emission wavelength and the relative fluorescence intensity (normalized to 1 at 460 nm) with different chlorophyll concentration of paddy rice leaf at tillering stage
a: 1.8 mg·g-1;b: 2.16 mg·g-1;c: 2.41 mg·g-1;d: 2.78 mg·g-1;e: 3.24 mg·g-1;f: 3.83 mg·g-1andg: 4.66 mg·g-1
2.2 Quantitative Analysis of Chlorophyll Concentration
Fig.2 shows the effect of chlorophyll concentration on the features of fluorescence spectra. Then, the fluorescence peak values at wavelength of 685 and 740 nm were extracted to calculate the fluorescence ratio (F740/F685). Fig.3 shows the correlation between chlorophyll concentration and fluorescence ratio at tillering stage [Fig.3(a)] and shooting stage [Fig.3(b)], respectively.

Fig.3 The relationship between chlorophyll concentration and fluorescence ratioF740/F685
(a):Tillering stage; (b):Shooting stage
Fig.3 indicates that there is a tight linear correlation between the fluorescence ratio (F740/F685) and the chlorophyll concentration of paddy rice leaf. The coefficient of determination (R2) can be reached up to 0.901 3 and 0.912 5 at tillering stage and shooting stage, respectively. The root mean square error (RMSE) is 0.122 5 and 0.136 7 at tillering stage and shooting stage, respectively. Numerical and experimental results demonstrate that the technology of LIF can be utilized to quantitatively monitor the chlorophyll concentration of paddy rice leaf.
3 Conclusions
In conclusion, the effect of chlorophyll concentration of paddy rice leaf on the fluorescence spectra was analyzed quantitatively in this paper. Fluorescence spectra show that the fluorescence peak values (685 and 740 nm) will increase with increasing of chlorophyll concentration. These characteristics of fluorescence spectra will be helpful to monitor the nutrient stress of paddy rice. In addition, the fluorescence ratio (F740/F685) also was utilized to quantitatively analyze the variation of paddy rice leaf chlorophyll concentration at two different growth periods (tillering stage and shooting stage). Numerical and experimental results demonstrated thatF740/F685have a strong linear correlation with chlorophyll concentration (R2=0.901 3 and RMSE=0.122 5 at tillering stage;R2=0.912 5 and RMSE=0.136 7 at shooting stage). Thus, the technology of LIF can be not only employed to monitor vegetation status, but also utilized to detect quantitatively the chlorophyll concentration of vegetation. Owing to these advantages of non-destructive and rapid, this method will be useful for precision agriculture in remote sensing field.
[1] Rosema A, Snel J, Zahn H, et al. Remote Sensing Environment,1998,65(2): 143.
[2] Du G Y, Li W T, Li H, et al. Journal of Plant Biology, 2012,55(2): 159.
[3] Tremblay N, Wang Z, Cerovic Z G. Agronomy for Sustainable Development, 2011,32(2): 451.
[4] Zhou Lina, Yu Haiye, Zhang Lei, et al. Spectroscopy and Spectral Analysis, 2014, 34(4): 1003.
[5] Yang J, Shi S, Gong W, et al. Plant Soil and Environment,2015,61(4): 182.
[6] Krause G H, Weis E. Photosynthesis Research, 1984,5(2): 139.
[7] Schreiber U, Schliwa U, Bilger W. Photosynthesis Research, 1986,10(1-2): 51.
[8] Günther K, Dahn H G, Lüdeker W. Remote Sensing Environment, 1994,47(1): 10.
[9] Zivcak M,Olsovska K, Slamka P, et al. Plant Soil and Environment, 2014,119(3): 210.
[10] Rogers S R, Webster T, Livingstone W, et al. Estuaries and Coasts, 2012,35(4): 959.
[11] Yang J, Gong W, Shi S, et al. RSC Advances,2015,5: 56932.
[12] Janusauskaite D, Feiziene D. Acta Agriculture Scandinavica Section B-Soil and Plant Science, 2012,62(1): 7.
S511
A
水稻叶绿素浓度对荧光光谱的影响
杨 健1,龚 威1,2,史 硕1,2,杜 霖1,3,孙 嘉1, 宋沙磊4,马盈盈1,2
1. 武汉大学测绘遥感信息工程国家重点实验室,湖北 武汉 430079
2. 地球空间信息技术协同创新中心,湖北,武汉 430079
3. 武汉大学物理科学与技术学院,湖北 武汉 430072
4. 中国科学院武汉物理与数学研究所,湖北 武汉 430071
为了加强对水稻生长状况的监测,指导水稻的田间施肥,提高施肥利用效率,以增加农作物产量、提高粮食品质,实验室搭建了基于激光诱导荧光技术的荧光探测系统,以研究水稻叶片的叶绿素含量与荧光峰值比之间的相关性。文中测量样本为水稻分蘖期和拔节期的倒二叶,栽培地区位于中国江汉平原。文中先采用凯氏定氮法和相应公式结合测得水稻叶片的叶绿素含量(mg·g-1),再用搭建的荧光探测系统采集了水稻叶片不同叶绿素含量的荧光光谱(激发波长为355 nm)。获得了水稻叶片在不同叶绿素含量下的荧光光谱数据库,定量分析了荧光峰值比F740/F685(荧光谱峰740 nm、685 nm处的荧光强度比)与叶绿素含量的相关性,发现叶绿素含量的变化对荧光光谱特性影响明显。由实验数据分析可知荧光参数中的峰值比(F740/F685)与叶绿素含量呈现很好的线性正相关,相关系数(R2)在水稻的分蘖期和拔节期分别达到了0.901 3和0.912 5。实验分析结果表明诱导荧光光谱技术具有方便、快捷、无损等优点,在农作物生长状况的遥感定量监测等方面也具有一定发展潜力。
激光诱导荧光;水稻;叶绿素含量;定量分析
2015-08-03,
2015-12-11)
Foundation item:National Natural Science Foundation of China (NSFC) (41401498, 41127901) and Program for Innovative Research Team in University of Ministry of Education of China (IRT1278),Chengguan Project of Wuhan (2014070404010198)
10.3964/j.issn.1000-0593(2016)10-3410-04
Received:2015-08-03; accepted:2015-12-11
Biography:YANG Jian, (1988—), PhD, State Key Laboratory of Information Engineering in Surveying, Mapping and Remote Sensing, Wuhan University e-mail: wind_yang@whu.edu.cn
猜你喜欢
杂志排行
光谱学与光谱分析的其它文章
- Gd靶激光等离子体光源离带辐射及其等离子体演化的研究
- Probing the Binding of Torasemide to Pepsin and Trypsin by Spectroscopic and Molecular Docking Methods
- Mn(Ⅱ)-5-Br-PADAP共沉淀-火焰原子吸收光谱法测定虾、贝样中的镉
- Near Infrared Spectroscopy Study on Nitrogen in Shortcut Nitrification and Denitrification Using Principal Component Analysis Combined with BP Neural Networks
- 内蒙古草原植被最大光能利用率取值优化研究
- 健康和糖尿病大鼠红细胞荧光光谱非线性程度差异