Near Infrared Spectroscopy Study on Nitrogen in Shortcut Nitrification and Denitrification Using Principal Component Analysis Combined with BP Neural Networks
2016-07-12HUANGJianHUANGShanZHANGHuaHUANGXianhuaiZHANGYongTAOYongTANGYuchaoWANGMeng
HUANG Jian, HUANG Shan, ZHANG Hua, HUANG Xian-huai*,ZHANG Yong, TAO Yong, TANG Yu-chao, WANG Meng
1. School of Environment and Energy Engineering, Anhui Jianzhu University, Hefei 230601, China
2. Key Laboratory of Anhui Province of Water Pollution Control and Wastewater Reuse,Anhui Jianzhu University, Hefei 230601, China
Near Infrared Spectroscopy Study on Nitrogen in Shortcut Nitrification and Denitrification Using Principal Component Analysis Combined with BP Neural Networks
HUANG Jian1,2, HUANG Shan1,2, ZHANG Hua1,2, HUANG Xian-huai1,2*,ZHANG Yong1,2, TAO Yong1,2, TANG Yu-chao1,2, WANG Meng1,2
1. School of Environment and Energy Engineering, Anhui Jianzhu University, Hefei 230601, China
2. Key Laboratory of Anhui Province of Water Pollution Control and Wastewater Reuse,Anhui Jianzhu University, Hefei 230601, China
To achieve efficient nitrogen removal and rapid detection of ammonia nitrogen and nitrite nitrogen, principal component analysis and neural networks were used to establish quantitative analysis model of ammonia nitrogen and nitrite nitrogen in shortcut nitrification and denitrification based on near infrared spectroscopy—BP neural networks model. The results showed that ammonia nitrogen concentration decreased from 45.3 to 2.7 mg·L-1after aerobic, and nitrite nitrogen concentration increased from 0.01 to 19.6 mg·L-1, while nitrite nitrogen concentration decreased from 19.6 to 1.2 mg·L-1after anoxic, which means that rapid nitrification and denitrification are successfully achieved. The principal component analysis of the original near infrared spectra for water samples showed the first 13 principal components represented the information of the original spectrum data, with cumulative contribution rate being 95.04%. In this way, redundant information can be eliminated to reduce the number of dimensions in the model. The spectral data matrix is accordingly reduced from 192×2203 to 192×13, which contributes greatly to easier calculations and improves the accuracy of the model. The correction results of BP neural networks model showed the coefficient of determination for ammonia nitrogen and nitrite nitrogen concentration was 0.950 4 and 0.976 2 respectively, with the root mean square error of calibration being 0.016 6 and 0.010 9. BP neural networks model yields predicted values fitting well with the expected values for ammonia nitrogen and nitrite nitrogen concentration, withR2being 0.974 0 and 0.981 4 respectively, with the root mean square error of prediction being 0.033 7 and 0.028 7, suggesting that BP neural networks model had a good prediction results for ammonia nitrogen and nitrite nitrogen concentration. The study demonstrated that ammonia nitrogen and nitrite nitrogen concentration can be rapidly predicted with BP neural networks based analysis of the near infrared spectroscopy of the water sample in shortcut nitrification and denitrification, which may provide timely and flexible control to shortcut nitrification and denitrification operation according to the ammonia nitrogen and nitrite nitrogen concentration changes, and makes a quick and effective detection technique for denitrification.
Shortcut nitrification and denitrification; Ammonia nitrogen; Nitrite nitrogen; Near infrared spectroscopy; Principal component analysis; Neural networks
Introduction
Shortcut nitrification and denitrification process is to control the nitrification reaction in the nitrite nitrogen generation stage and then denitrification, and the restraint of nitrite nitrogen to nitrate nitrogen is crucial for efficient denitrification[1-2]. Therefore, it is significant to establish a rapid detection method to monitor the transformation of nitrogen for shortcut nitrification and denitrification process.
Traditional detection methods for analysis of ammonia and nitrite nitrogen are expensive, and tend to generate secondary contamination. In addition, these methods often fail to reflect the operations in time. Near infrared spectroscopy features easy detection, rapid analysis and no need of chemical agents[3-4]. As a result, it is now becoming increasingly popular He Jincheng et, al utilized infrared spectroscopy for the quantitative analysis of BOD5, COD and pH[5]. Stephens A B et, al established an anticipation mode for rapid analysis of BOD5with infrared spectroscopy[6]. Liu Hongxin et, al also set up a quantitative model to determine total nitrogen and total phosphorus in water based on infrared spectroscopy[7-8]. Higher accuracy can be reached by combining principal component analysis and BP neural networks[9-11]. BP neural networks is an artificial non-linear multivariate correction model[12]. It calculates input data and uses the algorithm of error inverse propagation to realize multilayer feedforward neural networks that embraces highly non-linear projection between input and output. It features high accuracy, and is both reliable and transferable. Thus, it is widely used in multicomponent analysis. However, if all the spectroscopic data is directly input into BP neural networks, too many iterations and calculations are likely to cause over-fitting in the established model, which may result in less accuracy. Principal component analysis is very powerful in data compression and information retrieval[13]. It reduces the dimensions of the spectroscopic data and the size of the networks, increasing, as a result, the operation speed. But so far, there are only limited studies on combined principal component analysis and BP neural networks of quantitative analysis on ammonia and nitrite nitrogen.
The experiment runs in aerobic/anaerobic states alternately to study the transfer pattern of ammonia and nitrite nitrogen in shortcut nitrification and denitrification, and uses combined principal component analysis and BP neural networks method to rapidly estimate the change in concentrations during denitrification so as to adjust the system operation accordingly.
1 Experimental materials and methods
1.1 Experiment instruments
The experiment uses a sequencing batch sludge reactor that runs in alternately aerobic/anaerobic states. The reactor is made of perspex with a volume of 4 L. Aeration in the reactor is achieved with an electromagnetic air pump. The volume of aeration is controlled by a rotameter. A motor keeps the sludge and water stirred all the time. The reactor is shown in Fig.1. The reactor runs 3 cycles per day: feed water for 15 min, aeration stirring for 240 min, anaerobic stirring for 60 min, settling for 60 min, drainage for 10 min, stand-by for 95 min. Sludge has a concentration of 4 000 mg·L-1. The reactor run 250 d, including 80 d for nitrosomas acclimation and 170 d for shortcut nitrification and denitrification.
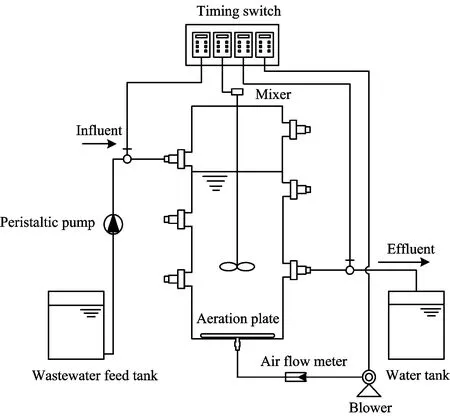
Fig.1 Schematic diagram of experimental setup
1.2 Experimental water quality
Domestic sewage is used as feed water into the reactor. COD is 220 mg·L-1, ammonia nitrogen is 30 mg·L-1, phosphate is 5 mg·L-1, pH is 8.0, nitrate is 0.01 mg·L-1, nitrite is 1.98 mg·L-1. At the initial state of experiment, ammonia nitrogen is 30 mg·L-1and is increased later to 70 mg·L-1for the sake of nitrosomas accumulation. The reactor is fed with 2 L for every cycle.
1.3 Analytical methods and instruments
COD is measured with dichromate titration. Ammonia nitrogen is measured with Nessler’s agent method. Nitrate is measured with UV spectrophotometry. Nitrite is measured by N-(1-naphthyl) ethylenediamine spectrophotometry. DO is measured by using an HQ30D portable DO detertor. The near infrared analytical instrument is BRUKER Fourier transform infrared spectrometer with spectrophotometry range of 4 000~12 500 cm-1and resolution of 8 cm-1and 32-time scanning.
1.4 Establishment Method of the correction model of near infrared spectroscopy
192 water samples taken from 8 stable cycles are used as calibration samples during the shortcut nitrification and denitrification. The samples are filtered by 0.45 μm filters to eliminate disturbance of suspended solids. Each filtered water sample is divided into two groups: one is for chemical analysis to measure ammonia nitrogen and nitrite; the other is to be scanned with near infrared spectroscopy for further study through combining principal component analysis and BP neural networks so as to set up establish the correction model, i.e., the BP networks model.
Another 24 water samples, which are not used for calibration model, are used as validation samples taken from other stable cycles during the shortcut nitrification and denitrification. These water samples are also filtered by 0.45 μm filters. Later, each sample is divided into two parts. One is measured by chemical methods for ammonia nitrogen and nitrite concentrations, which will be used as chemical values to test model (expected output of the model). The other is scanned with near infrared spectroscopy and the spectroscopy data will be used as the input of the neural networks after principal component analysis to testify the validity of BP neural networks model. The evaluation of BP neural networks is based on coefficient of determination(R2), root-mean-square-error of cross validation (RMSECV)and root-mean-square-error of prediction (RMSEP).
2 Results and discussion
2.1 Change of nitrogen in stable period
小灶河铜锑矿点,共发现4条铜锑矿化体,长约15~280m,宽约2~20m,主要有孔雀石化、辉铜矿化、黄铜矿化、褐铁矿化,孔雀石呈斑点状、浸染状附在岩石裂隙面上,辉铜矿、黄铜矿呈斑点状集合体赋存在灰岩内部,铜的品位在0.2%~3.71%之间,锑的品位在0.1%~1.09%。
Fig.2 shows the change in nitrogen (ammonia nitrogen, nitrate and nitrite) during the stable period in shortcut nitrification and denitrification process. During the aerobic period after the water was fed, ammonia nitrogen decreased from 45.3 to 2.7 mg·L-1, the concentration of nitrites increased from 0.01 to 19.6 mg·L-1. During this period the nitrate nitrogen was inhibited. During anaerobic period, the nitrite nitrogen decreased from 19.6 to 1.2 mg·L-1, which clearly indicated that the system was going through shortcut nitrification and denitrification.
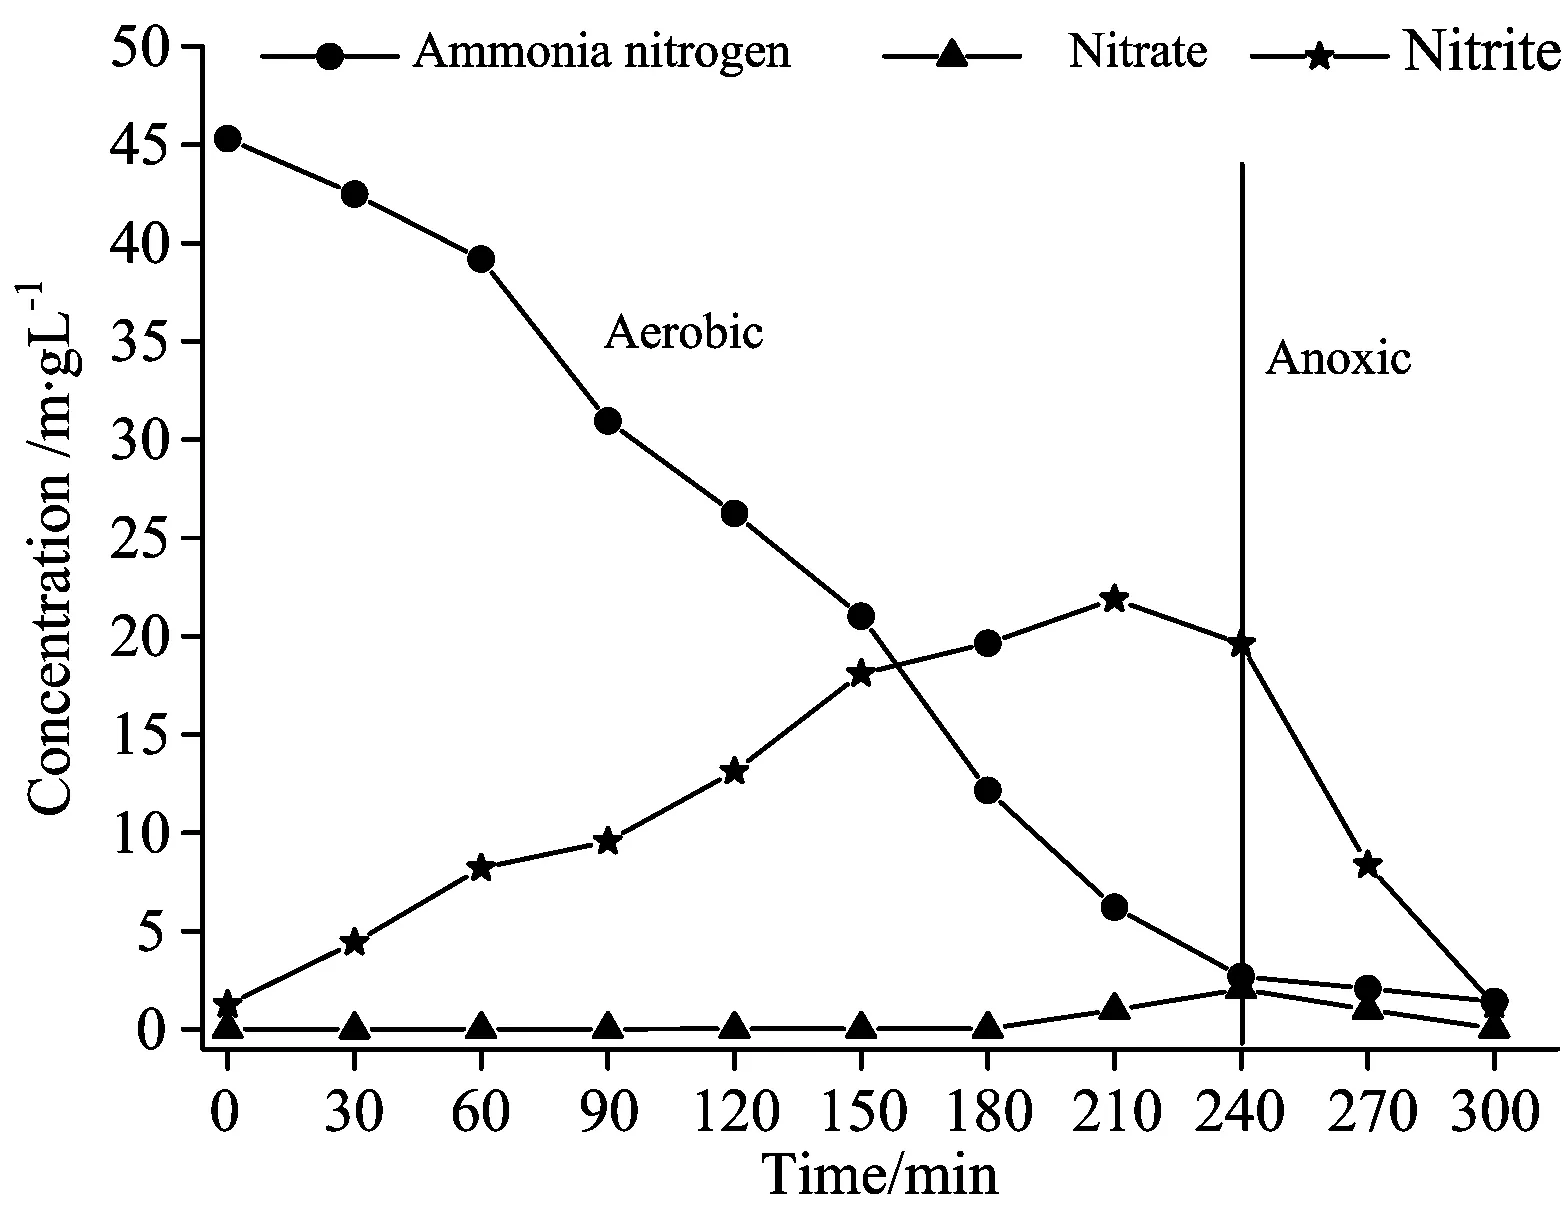
Fig.2 Changes of nitrogen in the stable period
2.2 Principal components analysis of near infrared spectroscopy data
The original spectroscopy of correction samples is shown in Fig.3. The spectroscopy of different samples all show a similar trend, despite some minor differences. The only difference occurs in the 6 500~7 000, 4 000~5 400 cm-1region. The reason is probably that the near infrared spectroscopy of nitrogen is covered by that of water[14]. Thus it is necessary to extract the principal components from the spectroscopy data using principal components analysis method. Fig.4 shows the percentage of contribution after principal components analysis of original spectroscopy data. The threshold valve of accumulated contribution is set as 0.95, then the first 13 principal components have the accumulated contribution of 95.04%. Therefore, these 13 components can represent major information of original spectroscopy data. Thus, the size of spectroscopy data matrix is simplified from 192×3 203 to 192×13, the calculations are also tremendously facilitated.
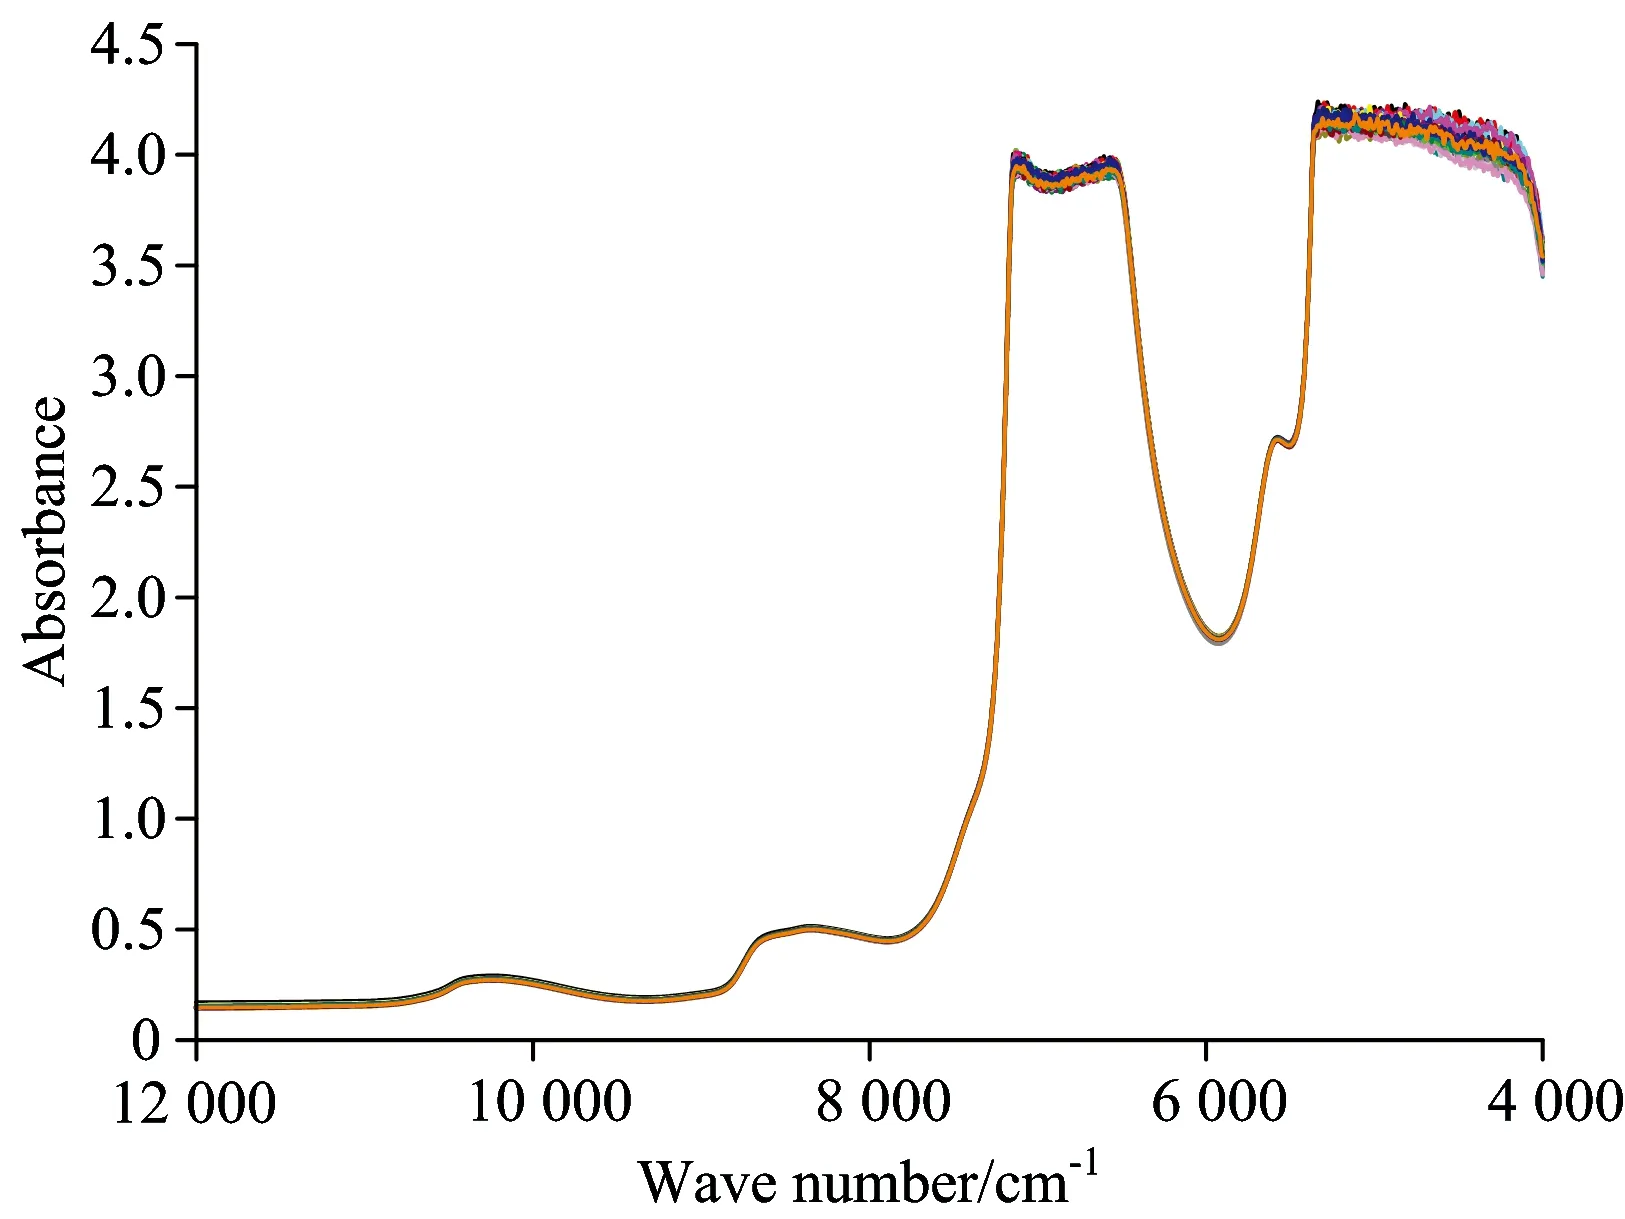
Fig.3 Original near infrared spectra of water samples
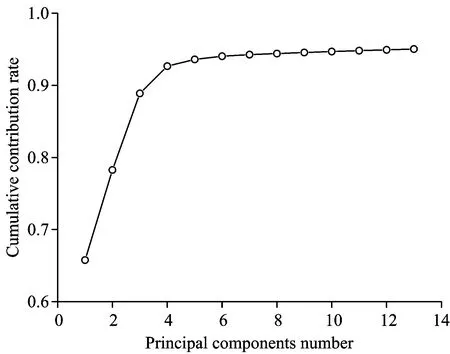
Fig.4 Change of cumulative contribution rate
2.3 Selection of parameters of BP neural networks model
The BP neural networks model of ammonia and nitrite nitrogen are set up based on the results of principal component analysis. 3-layer BP neural networks are established, with the 192 water samples as training set and the 24 correction samples as testing set. The node number of input layer is 13 since there are 13 principal components. In the output layer there is one node, representing the concentrations of ammonia and nitrite nitrogen, respectively. So far, there is no universal formula to determine the number of nodes of the hidden layer, and therefore previous researches are referred to for the sake of setting the number of nodes. The empirical formulam=(n+L)0.5+a(mis the node of hidden layer,nis the node of input mayer,Lis the node of output layer,ais a constant ranging from 1 to 10) yields the number of node of hidden layer, which ranges between 4.75~13.74, then we tested the formular within this range. The neurons transfer function in the hidden layer is hyperbolic tangent sigmoid transfer function, the neurons transfer function in the output layer is linear transfer function, a network training function is trainlm, learning rate is set to 0.1, maximum iteration is 1 000, anticipation error is 0.000 1. The initial weight and threshold values randomly set and trained. Whenm=5, the prediction is the best.
2.4 Establishment of BP neural networks model
BP neural networks model are shown in Fig.5. Fig.5(a) is an ammonia nitrogen correction model. RMSECV andR2indicate that the model for ammonia nitrogen has higher fitting precision, the measured values fit well with the estimated values, withR2=0.950 4, RESECV=0.016 6. Fig.5(b) shows the nitrite nitrogen correction model. It can be found that the predicted values of the model are also close to the measured value, withR2=0.976 2, RMSECV=0.010 9.These showed that BP neural networks model is accurate.
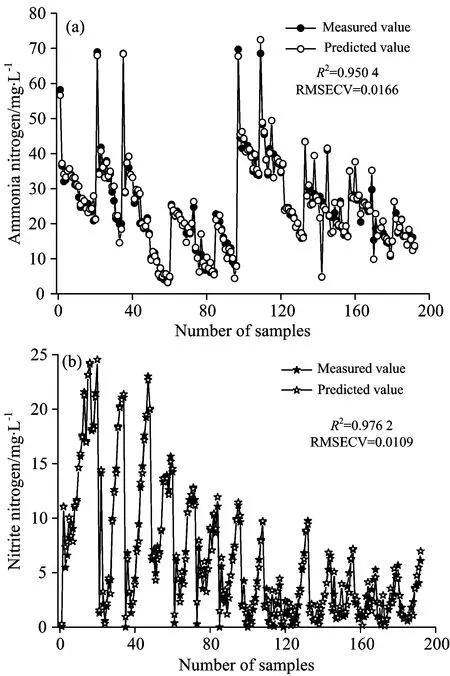
Fig.5 Establishment of BP neural networks model
2.5 Evaluation of BP neural networks model
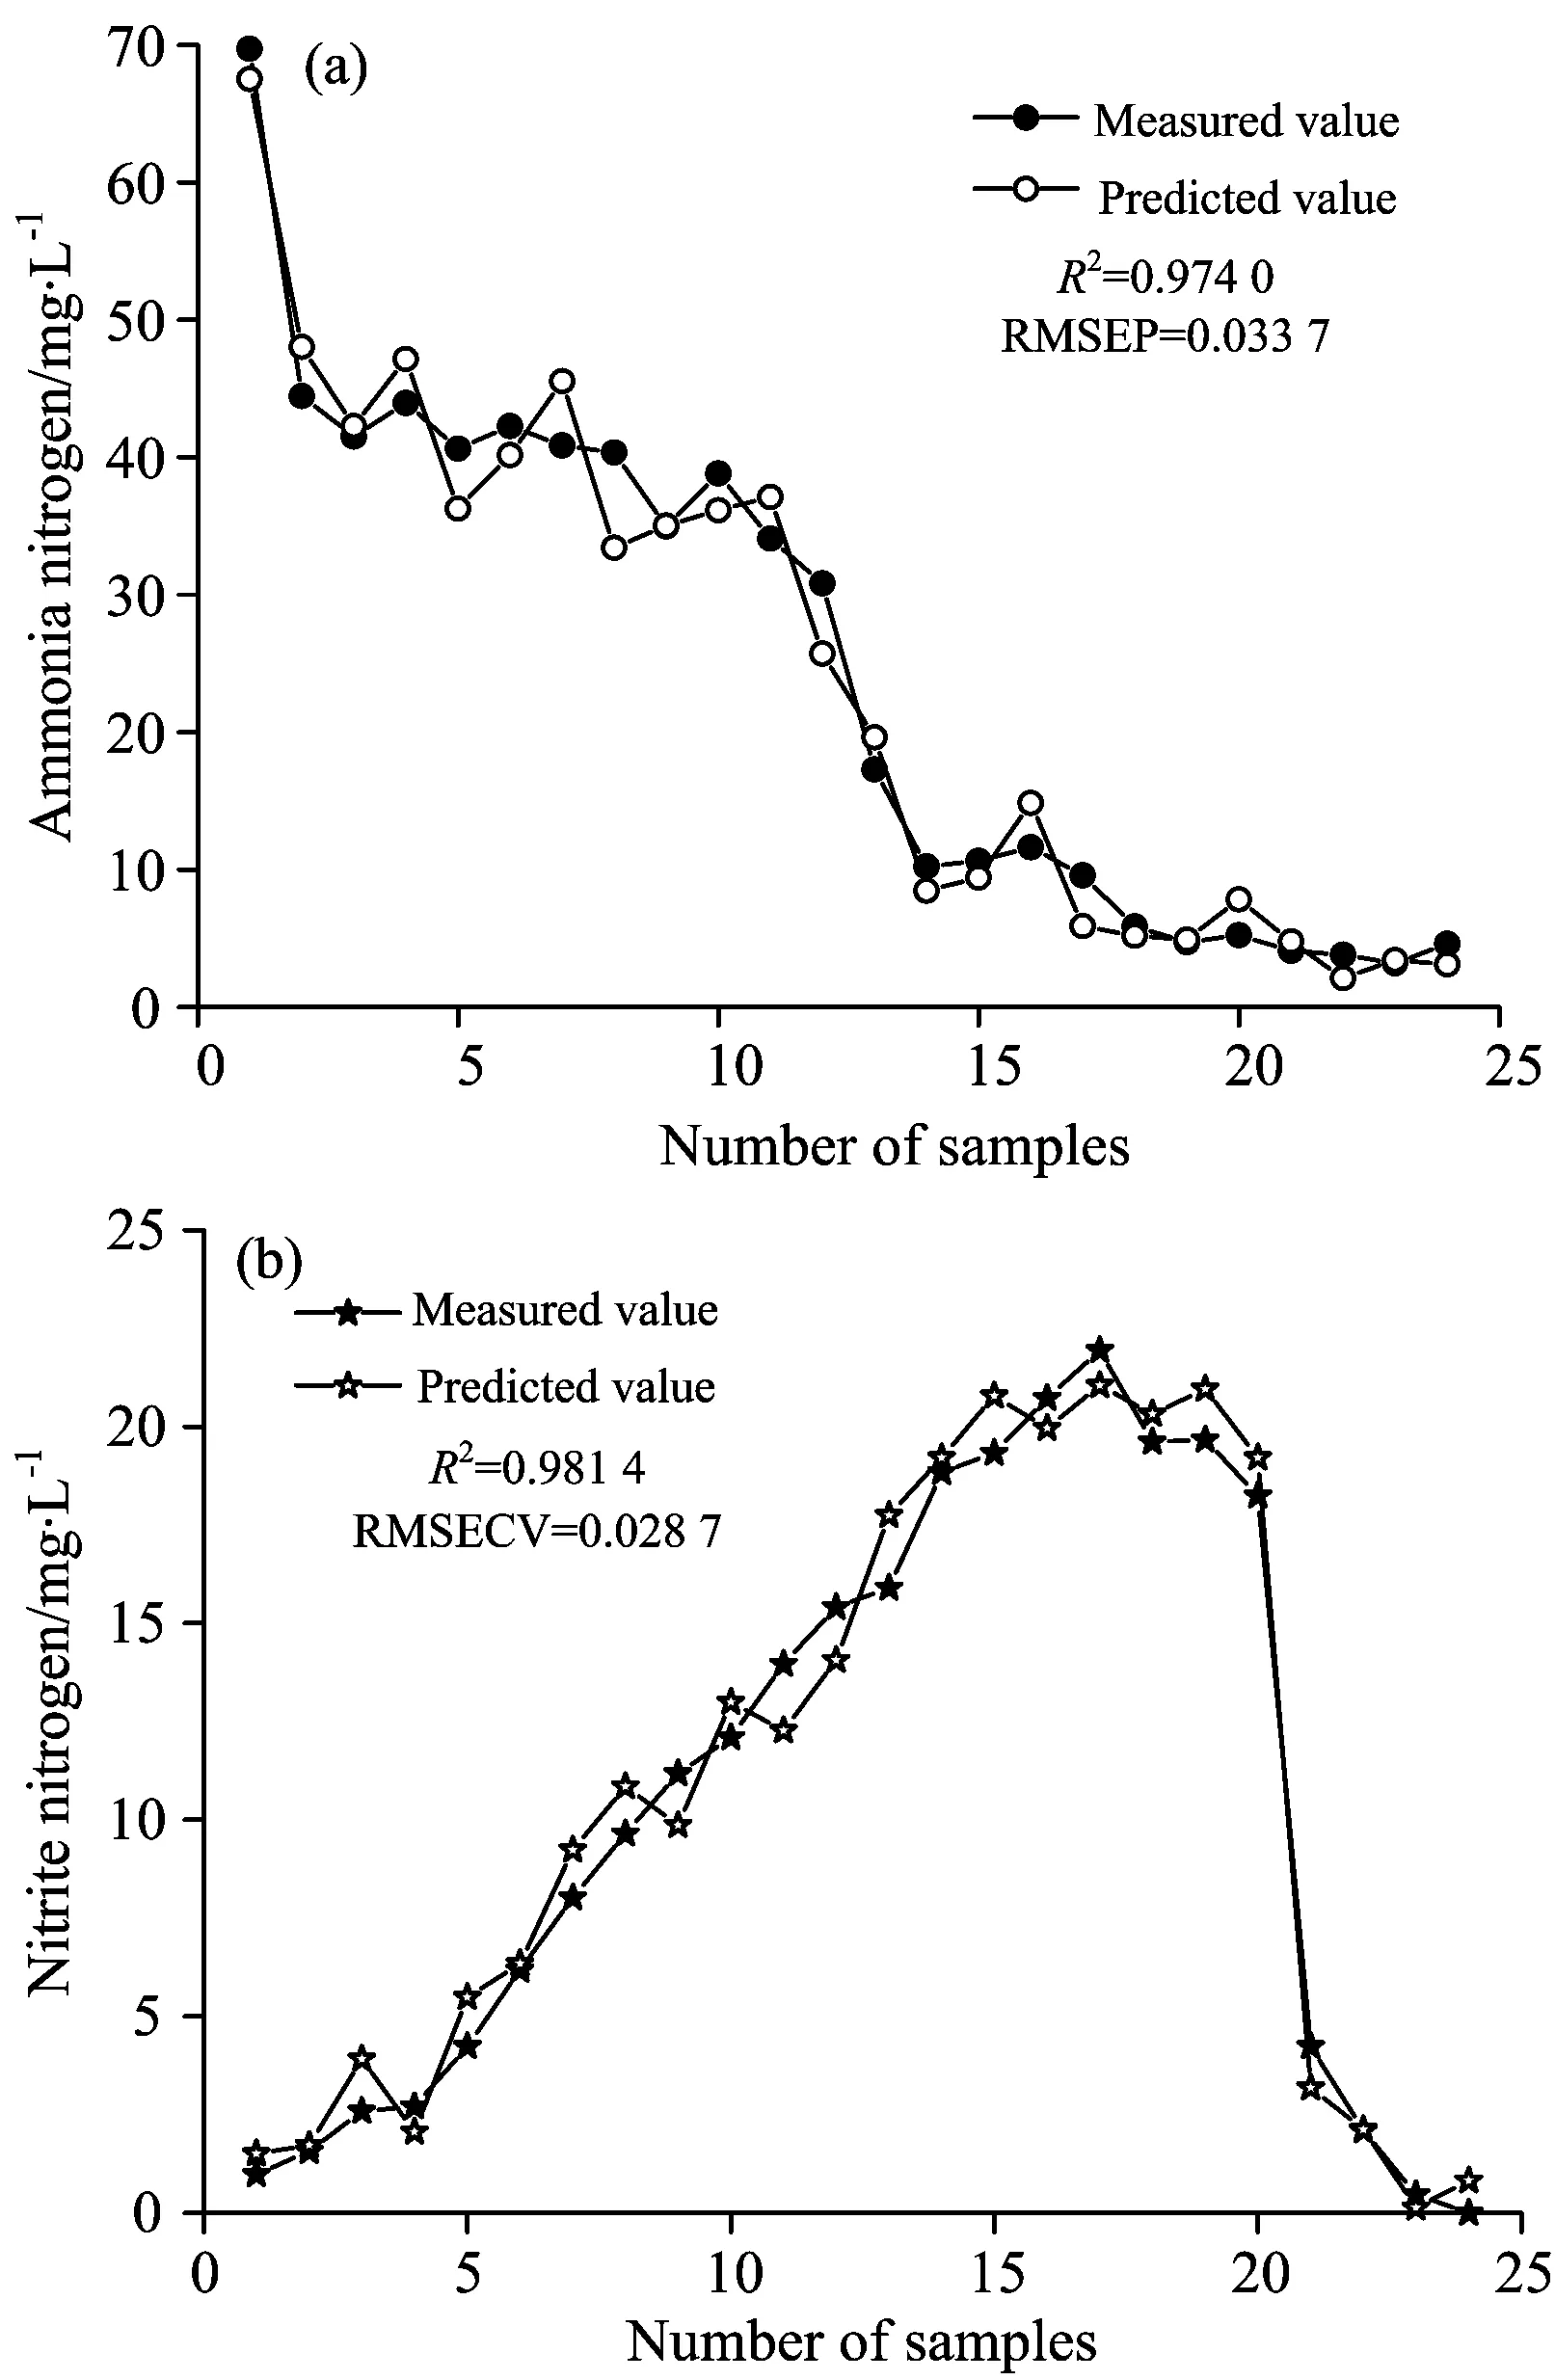
Fig.6 Test of BP neural networks model
3 Conclusion
(1)Stable period is well achieved in shortcut nitrification and denitrification process. When ammonia nitrogen is 70 mg·L-1, nitrite nitrogen is 0.01 mg·L-1, nitrate nitrogen is 1.98 mg·L-1, ammonia nitrogen is 45.3 mg·L-1after influent and then decreased to 2.7 mg·L-1, nitrite nitrogen increased to 19.6 mg·L-1after aerobic period, and nitrate nitrogen is inhibited; nitrite nitrogen decreased to 1.2 mg·L-1after anaerobic period.
(2)The dimension of original spectrophy data was reduced by using the principal component analysis method. The first 13 principal components make a contribution of 95.04%, which means that they may provide the information of the original spectroscopy. In this way, unimportant information can be ruled out, thus the model was simplified and the operation of the BP neural networks were speed up while their accuracy were increased.
(3)BP neural networks model showedR2for ammonia nitrogen and nitrite nitrogen concentration are 0.950 4 and 0.976 2 respectively, with the root mean square error of calibration being 0.016 6 and 0.010 9. BP neural networks model yields predicted values fitting well with the expected values for ammonia nitrogen and nitrite nitrogen concentration, withR2being 0.974 0 and 0.981 4 respectively, with the root mean square error of prediction being 0.033 7 and 0.028 7. These statistics indicates that the BP neural networks can precisely predict the change of ammonia and nitrite nitrogen in shortcut nitrification and denitrification process.
[1] LI Ling-yun, PENG Yong-zhen, YANG Qing, et al. China Environmental Science, 2009,(3): 312.
[2] ZHI Xia-hui, HUANG Xia, LI Peng, et al. China Environmental Science, 2009,(5): 486.
[3] GAO Rong-qiang, FAN Shi-fu. Analytical Instrumentation, 2002, (3): 9.
[4] Balabin R M, Safieva R Z. Analytica Chimica Acta, 2011, 689(2): 190.
[5] HE Jin-cheng, YANG Xiang-long, WANG Li-ren, et al. Acta Scientiae Circumstantiae, 2007, 27(12): 2105.
[6] Stephens A B, Walker P N. Transactions of the ASAE, 2002, 45(2): 451.
[7] LIU Hong-xin, ZHANG Jun, WANG Ba-guang, et al. Optics and Precision Engineering, 2009, 17(3): 525.
[8] LIU Hong-xin, ZHANG Jun, WANG Ba-guang, et al. Journal of Analytical Science, 2008, 24(6): 664.
[9] WU Jiang, HUANG Fu-rong, HUANG Cai-huan, et al. Spectroscopy and Spectral Analysis, 2013, 33(6): 1537.
[10] YU Ze-bin,, SHI Li-ling. Journal of Guilin University of Technology, 2012, 32(2): 189.
[11] WANG Chun-juan, FENG Li-hua, LUO Wei. Journal of Water Resources and Water Engineering, 2012, 23(6): 6.
[12] ZHANG Yan. Water Sciences and Engineering Technology, 2014,(3): 63.
[13] SHANG Shou-peng, YAO Xin-feng, YAO Xia, et al. Chinese Journal of Analytical Chemistry, 2009,(10): 1445.
[14] SHI Feng, WANG Xiao-chuan, YU Lei, et al. MATLAB Neural Network Analysis of 30 Cases. Beijing: Beihang University Press, 2010. 9.
O657.3
A
主成分分析结合BP神经网络对短程生物脱氮中氮的近红外光谱研究
黄 健1,2,黄 珊1,2,张 华1,2,黄显怀1,2*,张 勇1,2,陶 勇1,2,唐玉朝1,2,王 萌1,2
1. 安徽建筑大学环境与能源工程学院,安徽 合肥 230601
2. 安徽建筑大学水污染控制与废水资源化安徽省重点实验室,安徽 合肥 230601
为实现高效短程生物脱氮及氨氮和亚硝酸盐氮的快速检测,采用主成分分析结合BP神经网络的方法建立短程生物脱氮工艺中氨氮和亚硝酸盐氮的近红外光谱定量分析模型(BP神经网络模型)。工艺运行结果表明:原水经过好氧阶段氨氮从45.3 mg·L-1下降到2.7 mg·L-1,亚硝酸盐氮从0.01 mg·L-1上升到19.6 mg·L-1,硝酸盐氮受到抑制;在缺氧段亚硝酸盐氮从19.6 mg·L-1下降至1.2 mg·L-1,系统实现了良好的短程生物脱氮效果。水样原始光谱主成分分析表明:前13个主成分代表了原始光谱数据的信息,其累计贡献率达到95.04%,排除了冗余信息且大大降低了模型的维数,光谱数据矩阵从192×2 203减少到192×13,大大降低了运算量并提高了模型的精度。BP神经网络模型校正结果显示:BP神经网络模型对氨氮、亚硝酸盐氮校正时的决定系数(R2)分别达到0.950 4和0.976 2,校正均方根误差(RMSECV)分别为0.016 6和0.010 9。BP神经网络模型预测结果显示:BP神经网络模型对氨氮、亚硝酸盐氮预测输出与期望输出之间的决定系数(R2)分别为0.974 0和0.981 4,预测均方根误差(RMSEP)分别为0.033 7和0.028 7,模型预测效果良好。研究表明,BP神经网络模型可以通过快速测定水样的近红外光谱数据预测短程生物脱氮工艺中氨氮和亚硝酸盐氮浓度,并根据氨氮和亚硝酸盐氮浓度变化及时、灵活地控制工艺的运行,为生物脱氮提供快速有效的检测技术和科学依据。
短程生物脱氮;氨氮;亚硝酸盐氮;近红外光谱;主成分分析;神经网络
2015-04-20,
2015-10-05)
Foundation item:Major Science and Technology Program for Water Pollution Control and Treatment of China(2014ZX 07303-003-09, 2014ZX07405-003-03), the Natural Science Project for Colleges of Anhui Province(KJ2016A817)
10.3964/j.issn.1000-0593(2016)10-3399-05
Received:2015-04-20; accepted:2015-10-05
Biography:HUANG Jian, (1980—), M.E, Associate professor of Anhui Jianzhu University e-mail: huangjian@zhjzu.edu.cn *Corresponding author e-mail: huangxh@ahjzu.edu.cn
*通讯联系人