Experimental study of breach process of landslide dams by overtopping and its initiation mechanisms*
2015-12-01YANGYang杨阳CAOShuyou曹叔尤YANGKejun杨克君LIWenping李文萍StateKeyLaboratoryofHydraulicsandMountainRiverEngineeringCollegeofWaterResourceandHydropowerSichuanUniversityChengdu60065China2KeyLaboratoryofEngineeringSedimentofMinis
YANG Yang (杨阳), CAO Shu-you (曹叔尤), YANG Ke-jun (杨克君), LI Wen-ping (李文萍). State Key Laboratory of Hydraulics and Mountain River Engineering, College of Water Resource and Hydropower, Sichuan University, Chengdu 60065, China2. Key Laboratory of Engineering Sediment of Ministry of Transport, Tianjin Research Institute for Water Transport Engineering, Tianjin 300456, China, E-mail: yangyangscu@63.com
Experimental study of breach process of landslide dams by overtopping and its initiation mechanisms*
YANG Yang (杨阳)1,2, CAO Shu-you (曹叔尤)1, YANG Ke-jun (杨克君)1, LI Wen-ping (李文萍)1
1. State Key Laboratory of Hydraulics and Mountain River Engineering, College of Water Resource and Hydropower, Sichuan University, Chengdu 610065, China
2. Key Laboratory of Engineering Sediment of Ministry of Transport, Tianjin Research Institute for Water Transport Engineering, Tianjin 300456, China, E-mail: yangyangscu@163.com
(Received June 30, 2014, Revised November 6, 2014)
The present paper studies the physics of the breach erosion process, particularly, the breach initiation process in overtopped landslide dams. Due to great complexities involved, only homogeneous landslide dams are considered. The flume experiments of dam overtopping are conducted to study the breach growth process. And in order to reveal the effects of the seepage during the breach development, the permeability characteristics of the dam materials are also taken into consideration. With the experimental observation, the details of the breach growth are examined, and the whole breach process could be distinguished into five stages, i.e.,Stage I, the seepage erosion, Stage II, the formation of the initial breach, Stage III, the erosion toward the head, Stage IV, the expansion and incision of the breach, and Stage V, the re-equilibration of the river channel through the breach. It is shown that once triggered the entire breach process goes continually without stop, which highlights the significant impact of the early stages on the later deformation of the dam. Evidence shows that the initial breach of the dam is most likely to take place in the downstream slope of the dam, near the upper edge of the seepage face. The experimental results show a “headcut” mechanism of the breach initiation.
experimental study, landslide dams, breach process, overtopping, breach initiation, seepage, headward erosion
Introduction0F
Massive landslide dams induced by the recent two earthquakes in west China (i.e., the Wenchuan Earthquake, 2008 and the Ya'an Earthquake, 2013)have once again attracted worldwide attentions with regard to the potential dam failure risks[1,2]. From the experience of historical events, a dam failure would generate destructive flash flood and debris flow, leading to catastrophic losses. It is recognized that accurate knowledge of the dam breach process is essential to help build an early warning system for the evacuation of people and property. And a better understanding of the dam breach development is required for an emergency preparedness for taking adequate engineering measures to prevent further damages.
Physically, the problems of dam breach are very complicated. In the first place, a landslide dam could fail in a variety of ways (e.g., the overtopping, the piping, the slope failures, etc.) due to its random formation and different inflow conditions. Even if the dam breaches in a specific mode, the key concerns of the breach process such as the breach initiation, the breach growth rate and the induced maximum flood discharge would be affected by two aspects of factors,the material aspect, including the dam grain size distribution, the dam structure and geometries, and the water aspect, including the inflow magnitude and the reservoir volume. Generally speaking, the dam breach process is the outcome of the water-sediment interaction involving these two factors.
A landslide dam usually consists of non-cohesive clast materials ranging a wide grain size distribution(e.g., from millimeters to meters and with the mean grain size in the order of 0.1 m)[3,4]. Such dominant non-cohesive property of the material grains would give rise to different eroding behaviors comparing with the man-made clay dams[5,6]. In addition, since the dam is made of non-cohesive materials, the seepage in the slopes is inevitable, and sometimes itcould even be the decisive cause for the dam failure,for instance, the piping[7]. However, according to Costa and Schuster[8], of all 55 natural dam failure cases they have reviewed, in over 50 cases, the dam was breached in the way of overtopping and in very rare cases the dam was breached by seepage (either by the piping or the slope failure), which indicates that the erosion from overflow during the flood events should be the principal cause of the dam failures. The following-up researches on the dam breach process mostly chose the overtopping mode as their background setting.
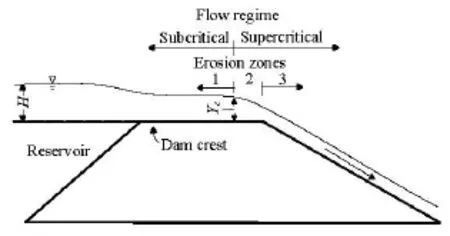
Fig.1 Flow regimes of the overtopped dam described by Powledge et al.[9]
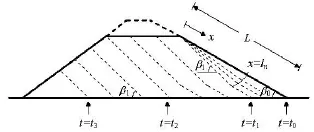
Fig.2 Breach growth process described by Visser[10]
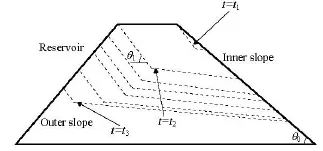
Fig.3 Breach growth development described by Yang et al.[12]
Powledge et al.[9]experimentally studied the mechanism of the flow regimes when an embankment dam was overtopped. Over the dam crest, they identified three regimes of the water flow and three corresponding erosion zones (see Fig.1). They demonstrated that the place near the downstream edge of the crest is the transition zone where the flow will transit from subcritical to supercritical regimes, and due to the high tractive stress, erosion is expected to initiate there or in the slope below. Visser[10]experimentally studied the breach growth by overtopping in sandy sea dikes. Based on some hypotheses and his experimental observation, he established a conceptual model of the process of the breach erosion in five stages (see Fig.2). In his observations, as the flow accelerates on the downstream slope, the breach will initiate when the sand grains at rest begin to be entrained as a suspended load by the high speed flow (at x=ln) and then erosion will progress and retreat in parallel until the whole dam is washed out. Coleman et al.[11]studied the overtopping breaching of non-cohesive homogeneous embankments in laboratory flumes. For an accurate estimation of a breach outflow hydrograph,their study focused on the deformation of the breach and the outflow discharge. It is shown that, in the varying process, the breach cross-sectional profile will maintain a parabolic shape. From their experimental data, they finally developed a set of dimensionless expressions for the prediction of the breach geometry and the discharge. More recently, Yang et al.[12]studied the overtopping breach growth processes in sand dams of quake lakes in laboratory experiments. Similar to Visser's[10]description, they presented a fourstage picture of the breach growth processes (see Fig.3). However, they demonstrated that the dam will not erode to the end, because, due to the finite reservoir volume, the water level will drop as the breach vertically incises until the flow is less erosive to carry away the bed materials, and finally the dam erosion ceases. Moreover their findings also emphasized the important role of the angle of repose of the sediment particles in the retreat erosion stage.
Apart from experimental researches, physicallybased mathematical models were also established for practical uses. The most popular physically-based mathematical models for embankment dam breaching problems are the BREACH model and the BEED model[13]. Since many aspects of the breaching mechanism remain unclear, these models empirically preset the breach initiation and subsequent deformation behaviors. For example, they assume that the breach initiates in a regular profile (e.g., rectangular, triangular,or trapezoid) and its shape remains nearly unchanged during the enlargement. And they also assume that the breach erodes down and retreats at a steady rate. With the combination of the weir formula and the bed-load type erosion formulas, this kind of models are applied to calculate the breach process and the outflow hydrograph. The accuracy of these models highly relies on the parameters such as the soil erodibility and the flow resistance. More recently, Chang and Zhang[14]developed a similar model to simulate the overtopping erosion process of landslide dams especially with consideration of the layered dam structure of varying erodibility along the depth direction. And they reproducedthe breaching process of the famous Tangjiashan landslide dam.
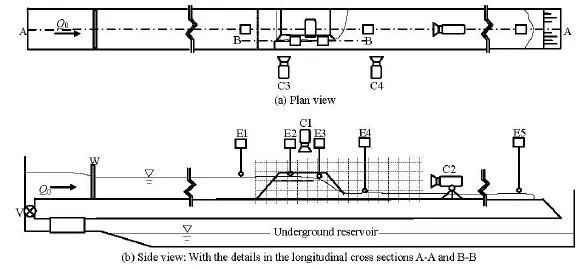
Fig.4 Experimental layout
From the above review, one may see the state of the art of the study of the dam breach process. Some of the results may be applied to the breach process of a landslide dam, but others may not. It should be noted that none of these researches have considered the effects of the seepage on the dam breach process. As stated earlier, because of the non-cohesive property of the dam materials, the seepage in dam slopes is unavoidable. Without consideration of the seepage,some of the erosion mechanisms would not be revealed when a dam is overtopped. And another point is that it is essential to determine how the breach initiates to help reliably determine how long it takes for a breach to develop to a critical point, which in turn can help emergency planners in establishing the flood risk and the potential warning time for areas downstream. However, from the literature review, it is seen that,except for Visser[10], who explicitly pointed out the formation and the location of the initial breach, the quantitative knowledge of the initiation processes for overtopping is very rare. And moreover, in view of the research background, even Visser's[10]theory is questionable to be applied to decide the initial breach point of a landslide dam. In his experiments, the water level was preset as a constant the same as the sea level and it would not drop with the breach growing, which is hardly the case in landslide dams. Thus the suspended mechanism of the initial breach may no longer be valid.
For the rare and inadequate knowledge of the breach process in landslide dams, further study is of importance. The objective of the present study is to investigate the physics of the breach erosion process,particularly, the breach initiation process in overtopped landslide dams. Due to the great complexities involved, only homogeneous landslide dams are considered. The flume experiments of dam overtopping are conducted to study the breach growth process. In order to reveal the effects of the seepage during the breach development, the permeability characteristics of the dam materials are also considered. Finally based on the experimental results, the mechanism of the breach initiation is discussed in details.
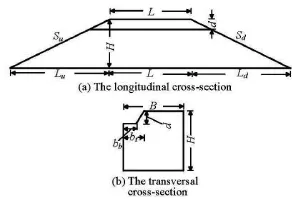
Fig.5 Cross-section profiles of the dam
1. Experimental study of the breach growth process
1.1 Experimental layout and setup
Experiments are performed in a flume with two glass sidewalls and a steel bed, about 16 m long, 0.3 m wide and with an average slope of S=0.003. As shown in Fig.4, the dam is located about 8 m downstream the triangle weirW . The weir is used to verify the inlet discharge Q0. E1-E5 are automatic electric water-level probes, and they are deployed to measure the stage hydrographs along the flume. C1-C4 are digital video cameras which are to capture the dam breach process from three different perspectives(i.e., C1 from the top, C2 from the downstream, and C3 and C4 from the sides). Along the dam site,0.05 m×0.05 m grids are painted on the glass side wall in order to help observation and measuring.
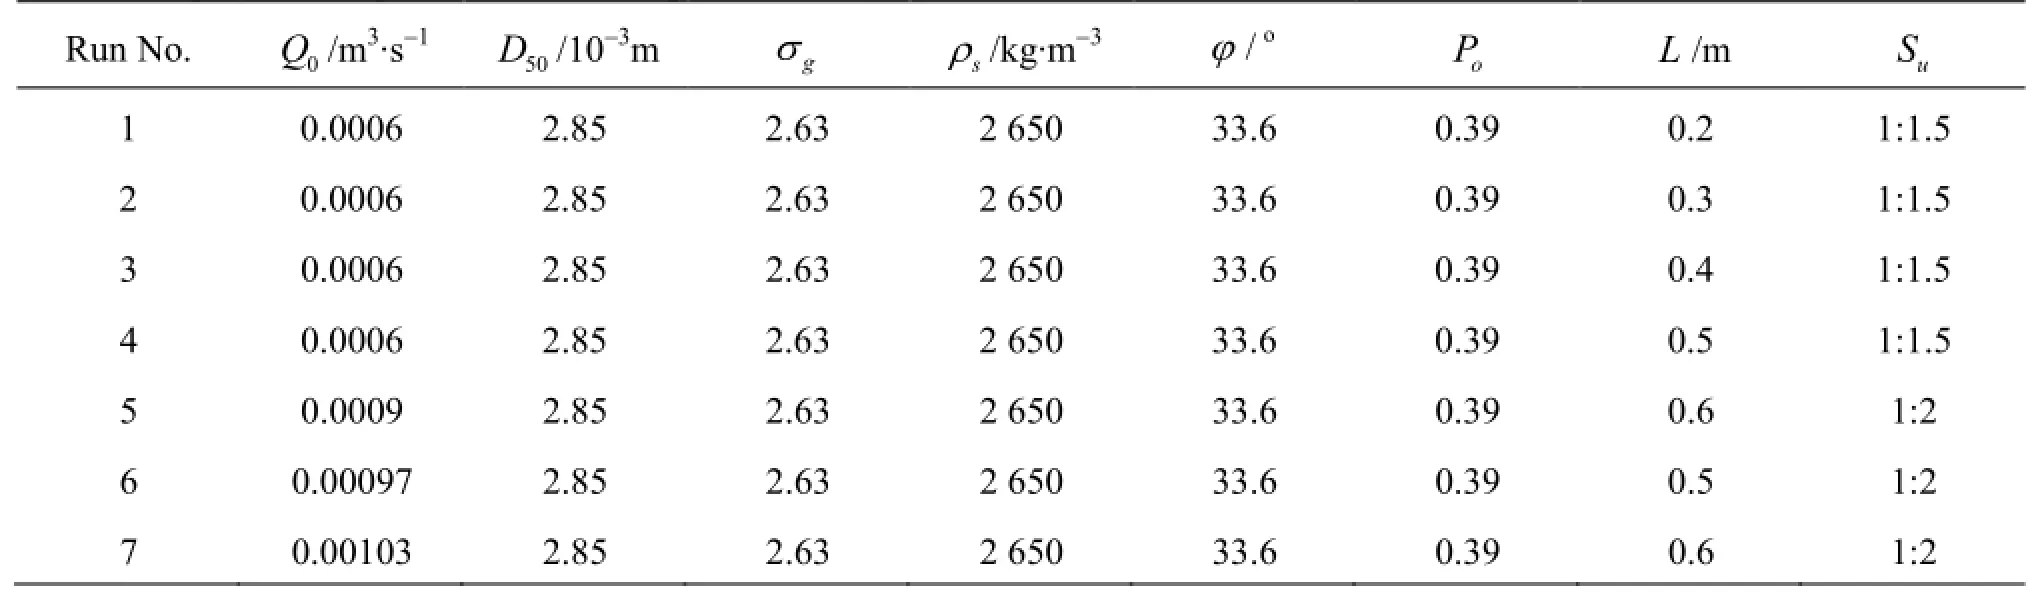
Table 1 Experimental parameters in the present study
Figure 5 shows the geometric dimensions of the dam. Except for the length of the dam crestL and the upstream slope Su, which vary in different Runs, all other (longitudinal and cross-sectional) dimensions remain the same. The dam heightH is 0.3 m, the dam widthB is 0.3 m, the downstream slope Sdis 1:2.5(see Table 1).
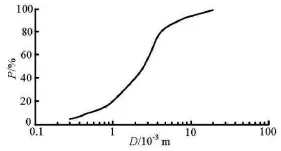
Fig.6 Grain size distribution in the present study
The sediment materials used for the dams are artificially graded (see Fig.6, whereP is the percentage finer by weight). During construction, each dam is compacted with the same compact force (i.e., by keeping the same dry density of the material ρd≈ 1610 kg/m3). After a dam is built, a trapezoidal pilot channel of fixed geometry is dug in the crest, bordering upon one side of the flume walls (see Fig.5(b)). The depth of the channeld is 0.05 m, the top width btis 0.1 m, and the bottom width bbis 0.05 m. It should be noted that the pilot channel is not a preset initial breach, instead, it is dug to lead the water to flow to the side wall. Such an arrangement not only maximizes the possible lateral erosion within the limited flume width but also enables a better condition for observation.
Values of other relevant experimental parameters are also listed in Table 1, where Q0is the inlet discharge,D50is the mean diameter of the dam materials, σgis the geometric standard deviation of the particle size,ρsis the solid density,φis the friction angle and Pois the porosity of the dry sediment samples.
In order to simulate the practical overtopping process of landslide dams, we start each experiment from the beginning of the reservoir impoundment. The valve Vis turned on and the inlet discharge is preset to a given value Q0. As the water in the reservoir rises to a certain level, a distinguished saturation line is formed (as seen from the side wall), then the video cameras and the water-level probes are switched on to capture, respectively, the pictures and the real-time variation of the water level. Through a frame-by-frame analysis, the video acquired could provide a series of profiles of the dam erosion process.
It is known that the water balance equation for a reservoir is dV/dt=Qin-Qout, whereVis the volume of the reservoir,Qinis the inflow discharge, and Qoutis the outflow discharge (herein ignoring the impact of the rainfall, the evaporation and other factors). Thus in the present experiment, the outflow discharge Q (including the seepage discharge Qseepageand the overflow discharge through the breach Qbreach) could be calculated as follows:
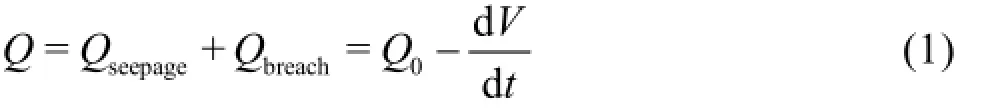
where Q0is the inlet discharge,dV/dtis the variation rate of the reservoir volume in the flume.
1.2 Dam breach process and experimental results
Generally speaking, as shown in Fig.7, the breach growth in sand dams could be described in five stages, namely, Stage I, the seepage erosion, Stage II,the formation of the initial breach, Stage III the erosion toward the head, Stage IV the expansion and the incision of the breach, and Stage V the re-equilibrium of the river channel through the breach.

Fig.7 General erosive stages observed in the experiments (images (a)-(d) are from the experiment Run 6, while (e) is from Run 5, and(f) from Run 2)
As Stage I starts, the water level in the reservoir begins to rise at a low rate. Since the water level has not reached the elevation of the pilot channel, there is no overflow except for the seepage going through the dam. After the seepage in the dam is well developed,the water begins to release from the downstream slope. The higher the water level is, the larger the magnitude of the seepage becomes. It is seen that along with the released water, “seepage-induced transport”[15]works:small amount of sand grains in the seepage face begin to move downwards partly by individual grain motions but mostly by the intermittent shallow mass wasting (see Fig.7(b)). However it should be pointed out that the seepage-induced transport is so weak and so slow that the erosion in the downstream slope remains almost negligible and poses no threat to the stability of the slope. Then Stage I ends when, the water level reaches the invert point of the pilot channel.
Stage II starts when the rising water enters the pilot channel and forms an overflow. However the amount of the overflow is quite small and it is almost in a way of creeping downstream. The time for the overflow to take going through the entire pilot channel depends on the length of the channel, which is in proportion to the length of the dam crest. At the moment that the overflow exits the pilot channel (see Fig.7(c)),the velocity of the water begins to accelerate. Despite the fact that the velocity of the flow is relatively high,the overflow is not erosive enough to cause an extensive damage to the downstream slope due to the limited quantity. Only a discernable gully is formed soon after the flow exits the pilot channel. In the meanwhile,the seepage as described in Stage I still works at the lower region of the downstream slope. As soon as the overflow reaches the upper edge of the seepage face,considerable breach occurs and Stage II ends.
The spot where the overflow meets with the upper edge of the seepage face when Stage III begins is taken as the initial breach point, about which the process quickly develops in the downstream slope face. It could be seen that above the point, the gully gets deepened sharply and widened slightly, while beneath it since the sediment is flushed downstream, the breach outlet in the downstream face spreads fast laterally from near the observation side wall to the opposite side, forming an alluvial fan. In this Stage, the erosion of the dam mainly happens within the developing gully. The gully bed retreats and flattens gradually. At the same time the water level in the reservoir is still rising, thus such erosion toward the head would continue and become a little more severely as the overflow discharge increases. In the end of Stage III,when the erosion toward the head reaches the entrance of the pilot channel, the water level in the reservoir reaches its maximum and an entire breach channel is formed (see Fig.7(d)). In addition, comparing with the distinct erosion toward the head upstream the initial breaking point, the elevation of the initial breaking point drops little during the whole stage (see Fig.9).
Stage IV, i.e., the breach expansion and incision stage, is the main stage of the breach growth, and it starts when the entrance of the breach channel begins to be eroded down. From this moment on, the water level begins to drop with the decrease of the elevation of the breach channel entrance, and thus the outflow of the flood water continues increasing and surpasses the inlet discharge Q0. However, the quickly enlarged flow discharge makes the whole bed of the breach channel more erodible. Focusing on the entrance of the breach channel, the highly erosive flow washes away the remained sediment there and enables the breach entrance to expand and incise. Simultaneously in turn, the magnified breach entrance allows much more flood water to release from the reservoir and again causes further erosion. Down below the breachentrance, similar erosional process (i.e., in both lateral and vertical directions) takes place in the whole breach channel. Due to the high gradient of the channel bed, the sediment-laden flow is quite torrential. It could be easily understood that the sediment phase is mostly transported as the contact load, supported by frictional and collisional grain-grain interactions, and without the stream-wise sorting during the transport. Apart from the previously described erosional process,one significant distinguished phenomenon happens in the breach channel is that the lateral collapse: the sediment bulks slip apart from the dam body and fall into the breach channel (see Fig.7(e)). And the larger the discharge grows the more frequently the lateral collapse becomes. Since the reservoir is of a finite volume,when the breach of the dam grows to a certain degree,the outflow discharge reaches its maximum. Afterwards, the outflow discharge begins to decrease and the erosional process in the breach channel turns weak. At the moment when the eroding down process stops at the breach entrance, Stage IV ends.
The last stage of the breach process is the reequilibrium. When it begins, the breach through the dam has almost reached its final dimensions (Fig.7(f)). The stream power becomes too small to cause considerable lateral erosion and thus the collapse is halted. As the flow discharge reduces, the stream width reduces as well. It could be seen that a part of the side bank of the breach channel which used to be under the water has now been exposed to air and in addition, the slope of it is much more flattened comparing with the adjacent steep side wall above. Slowly, the flow discharge becomes equal to Q0, and when an armored layer forms in the channel bed, the whole breach process ends.
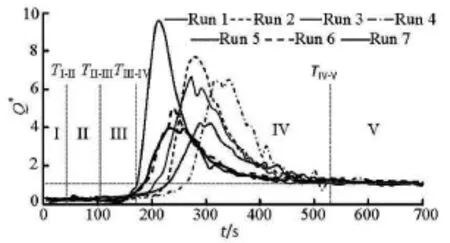
Fig.8 Hydrographs of the outflow in different experimental runs
Figure 8 shows the outflow hydrographs from the breach.Q∗represents the dimensionless outflow discharge:Q∗=Q/ Q, whereQis the outflow discha-0rge and Q0is the inlet discharge. The time origin herein is set at the moment when the water depth reaches 0.24 m in each experimental run. In order to clarify the similarity, the time intervals of different breach stages are separated by vertical dashed lines, and TI-II,TII-III,TIII-IVand TIV-Vare notated as the transitional moments for every two adjacent stages, respectively (in fact the separation shown in Fig.8 is just simplified and is a schematic diagram, for instance, in each experiment, the transitional point from Stage III to Stage IV should be the intersection of the hydrograph curve with the horizontal line Q∗=1).
However, it could be seen that each hydrograph goes from a very low flow at early stages (i.e., in Stages I and II,Q∗≈0.14-0.39) to the outburst after the dam is overtopped (i.e., in Stage IV,Q∗≈4-9.58 at the peak) and in the end it returns to the magnitude of Q∗=1. The differences of the hydrograph shapes during the flood period are mainly caused by the differences of the inlet discharges and the dam dimensions. Apparently it is shown that for the same inlet discharge, a shorter length of the dam crest would lead to a quicker and higher flood peak (i.e., Run 1- Run 4) and the style of the peak tends to vary from a multimodal to a unimodal one. Reversely for the same crest length of the dam, a larger inlet discharge would also result in a quicker flood peak (i.e., Run 4 vs. Run 6 and Run 5 vs. Run7).

Fig.9 Breach growth process in the dams (the breach profiles are recorded every 10 s)
The flash flood induced by a gradual breaching is controlled by the deformation of the breach, thus highly depends on the interactions between the dam materials and the flows. Figure 9 shows the eroding process of the dam in the longitudinal profile for the experiment Run 1 and Run 7.Tmax,Tmax1and Tmax2arethe flood peak moments and TII-III,TIII-IVand TIV-Vare as previously defined.
Figure 9 indicates that the channel bed may retreat in parallel after the erosion toward the head reaches the entrance of the breach (i.e., after the moment TIII-IV), and such a finding is similar to that reported by Visser[10]and Yang et al.[12]. However in the present study it is shown that the retreat slope would not maintain at the angle of repose (as shown by Visser[10]and Yang et al.[12]), but at a much smaller angle.
3. Mechanisms of breach initiation by overtopping
It is clear that once triggered, the entire breach process goes continually without stop, which highlights the prominent impact of the initial developing erosive manner (caused by the small flow discharge in Stages I, II and III) on the later breach evolution and flash flood. The outflow consists of two parts in the early stages: the seepage flow and the overflow (seepage exists in Stage I only), and they are at the same order of magnitude and then neither could be ignored.
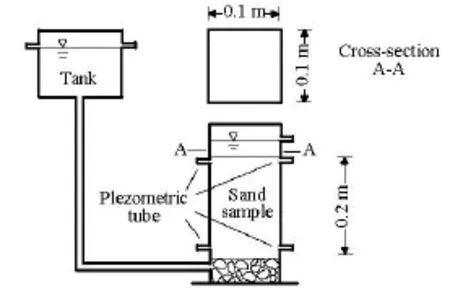
Fig.10 Experimental apparatus for the measurement of the coefficient of permeability
3.1 Seepage flow in the dams
Generally speaking, for a porous medium, a basic physical equation could be written as[16]

whereJ is the seepage gradient,Vis the average seepage velocity,K is the universal coefficient of permeability with the dimension of speed, andm is a parameter that identifies the flow condition and varies from 1 to 2. For instance, if m=1, the seepage flow is laminar, and the famous linear Darcy's law holds, and if m=2, the flow condition will be turbulent, and if m=1-2, it means that the flow condition is transitional. Taking the logarithm on both sides of Eq.(2), we have
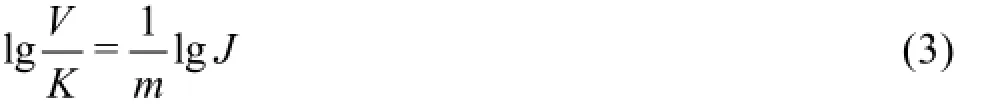
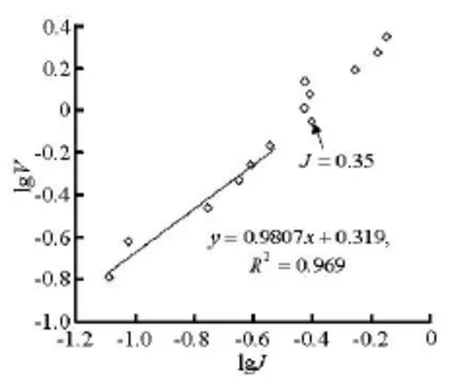
Fig.11 Plot oflgV versuslgJ
In order to investigate the seepage characteristics of the dam material, an additional experiment is carried out similar to Darcy's, measuring the coefficient of permeability. The test apparatus is shown in Fig.10. To maximize the similar state of stress, the sediment sample is kept of the same dry density as that used for the dam construction. Different hydraulic gradientsJ are produced by shifting the tank to different elevations, and the average seepage velocitiesV are measured by the volumetric method. It is observed that when Jis small, clear seepage water from the sediment sample comes out evenly, no significant sediment movement is observed in the container. AsJ grows larger, a couple of small sands begin to get washed out from inside the sample and at J=0.35, a considerable spring hole is caused by piping. The measurement does not terminate until more spring holes are formed and the static sand face of the sample becomes rolling and totally unstable. The datalgV versuslgJare plotted in Fig.11.
Figure 11 shows that whenJ is less than 0.35, the data measured are well along a straight line of the slope very close to unity, which indicates that the flow condition in the sample is laminar and is a Darcy flow. And thus the coefficient of permeability Kcould be calculated as 0.0209 m/s.
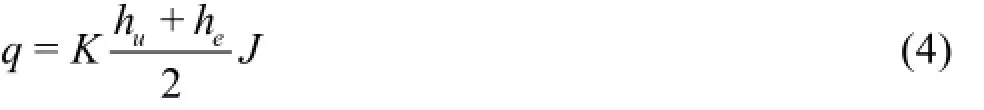
Table 2 lists the main seepage parameters recorded at TI-IIin the dam breach experiments, where huis the water depth before the dam,heis the height measured from the bottom to the upper edge of the seepage face,J is the average seepage gradient,Q∗is the dimensionless seepage discharge, and qm(= Q*Q/ B)is the measured seepage discharge per unit width. It could be seen that the average seepage gradient in each experimental run is far less than 0.35,and that is to say, during Stages I through II the seepage in the dam is the Darcy flow. Herein the famous and simple Dupuit's Equation[16]is applied to calculate the seepage discharge per unit width at the TI-II. Asalso listed in Table 2, the comparison of the calculated values of the seepage discharge per unit width (i.e., qc) with the measured ones (i.e.,qmreconfirms that that the seepage flow in the dam follows the Darcy's law.
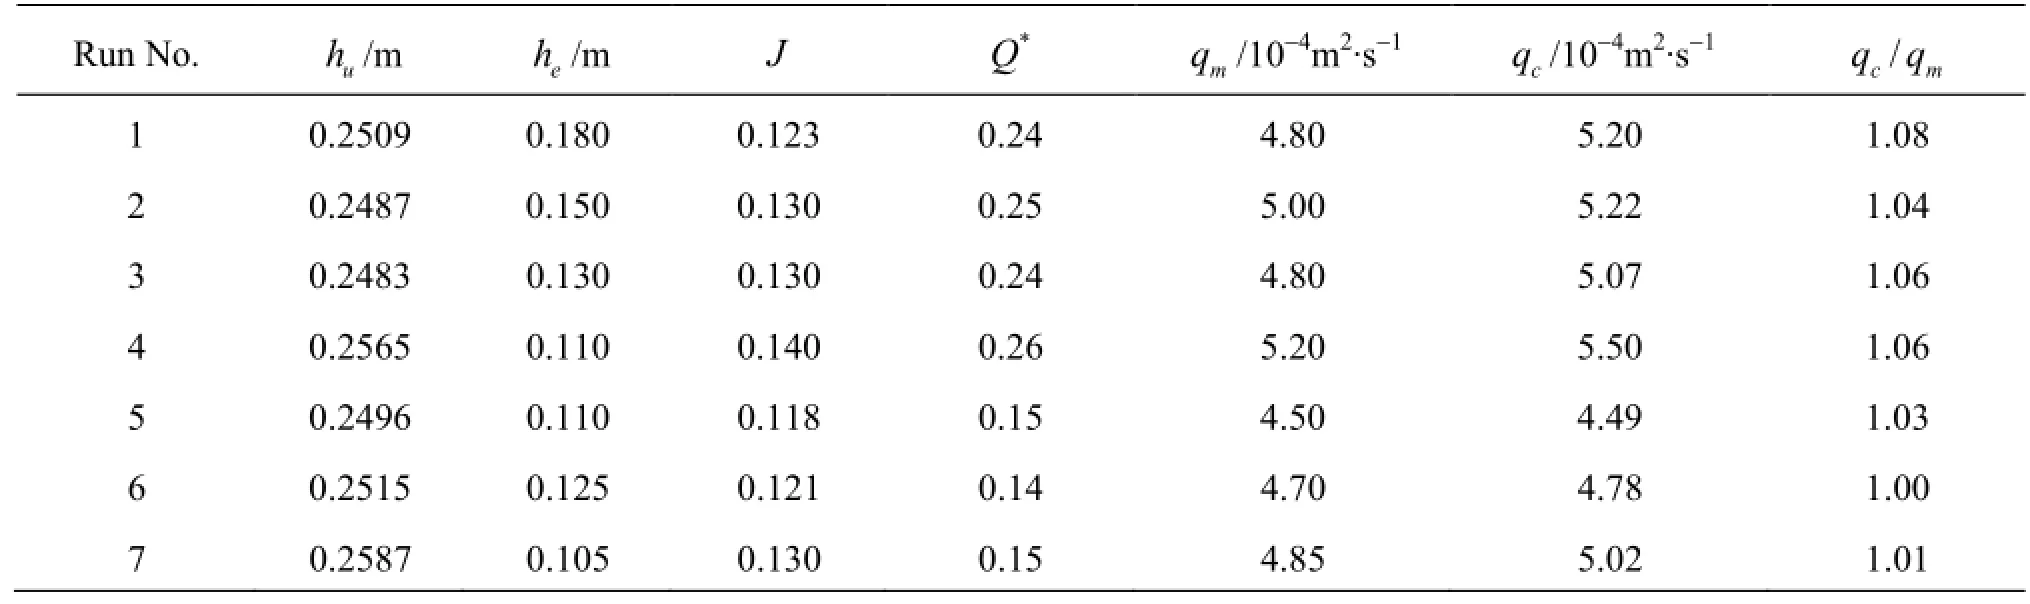
Table 2 Major seepage parameters at the moment TI-II
3.2 Stress state of the sediment in the seepage face
Now, consider a 2-D element near to the seepage face in the downstream slope of the dam in Stage I as shown in Fig.12.
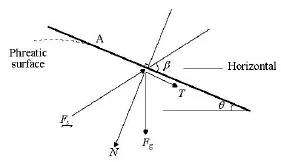
Fig.12 Stress state of the sediment element in the seepage face
Besides the gravitational force (per unit width) Fg, the emergent seepage will impose a force per unit width Fson the element. Their resultant force could be thus divided into two components, respectively, the tangential forceT and the normal forceN. Using the Coulomb failure theory, the factor of safety against failure could be written as
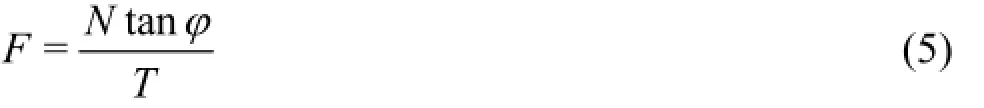
with T=Fgsinθ+Fscosβand N=Fgcosθ-Fssinβ, whereθis the slope angle,βis the angle between the seepage force and the slope, andφis the angle of internal friction, which for non-cohesive materials is generally considered as equal to the angle of repose φ0.
Since it is the Darcy flow in the dam, and the element is thoroughly infiltrated, the seepage force[16]and the gravitational force could be written as
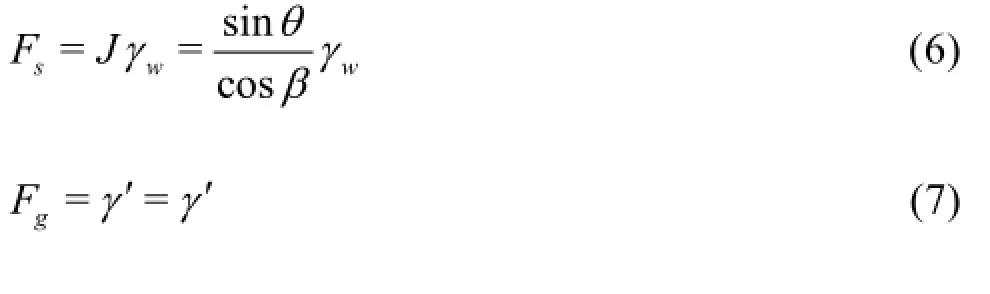
whereJ is the average seepage gradient,γwis the unit weight of water, andγ′is the effective unit weight of the sediment element. Now Eq.(5) could be expressed as
Typically, at the upper edge of the seepage face(i.e., the element is settled at Point A in Fig.12), the angleβis thought to be zero and with the element moving downward[16],βturns larger. The value ofβ is in the range of [0,90)in the seepage face. If the slope is stable under the seepage, it is at least required that the safety factor is no less than unity, thus we have
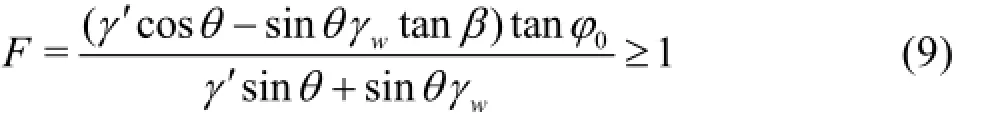
Rearranging Eq.(6), we obtain

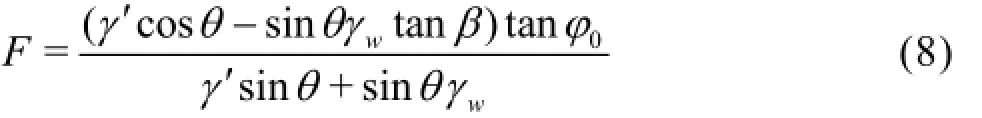
where γsatis the saturated weight of the sediment element. It could be seen that on the right side of Expression (9), except for the angleβ, other variables are all constants. Thus it could be inferred that the larger βis, the smallertanθwill be. Under the critical condition F =1,tanθreaches its maximum at β= 0 (i.e., at the upper edge of the seepage face, see Point A in Fig.12), and then it will decrease all the way to zero at the end of the dam slope due to the variation of β. As for the experimental setup in the present study,[tanθ]max=(γ′/γsat)tanφ0≈0.37,[θ]=arctan0.37≈20.3o, that is to say, the maximaxmum slope angle, which could hold at A. Now an interesting phenomenon would appear: if the preset of the downstream slope of the dam is steeper than[θ]max, a gap of discontinuity is surely to take shape at A, otherwise if the present slope is equal to or smaller than [θ]max, then no discontinuity would form but the slope will gradually turn milder from the upper edge of the seepage face to the bottom end (see Fig.13).
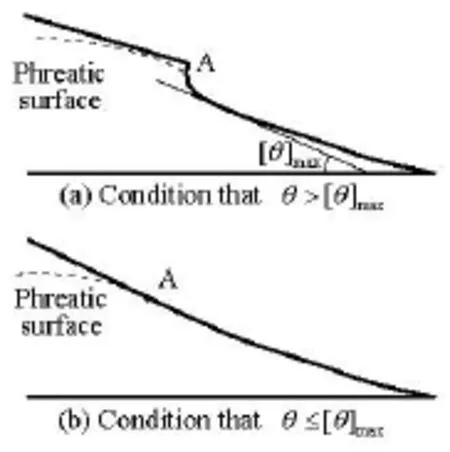
Fig.13 Slope deformation under seepage

Fig.14 Stress state of the sediment under both overflow and seepage flow conditions
In the present study, the downstream slope is preset as arctan0.4, which is a little greater than[θ]max=arctan0.37, then the slope in the seepage face needs to adjust, that explains the reason for the previously observed “intermittent described shallow mass wasting” (see Fig.7(b) and Fig.11(a)) It should be noted that the deformed slope becomes generally stable, and such a change in the profile of the slope would provide a more erodible condition for the subsequent breach process.
3.3 Threshold of the sediment under both overflow and seepage flow
Figure 14 shows the stress state of the sediment on the slope under both overflow and seepage flow conditions around the moment TII-III, where FDis the drag force induced by the overflow,Fsand Fgare, respectively, the seepage force and the gravitational force as previously defined,θis the slope angle,α? is the angle between the seepage force and the horizontal line,δis the angle between the perpendicular line (to the drag force) and the segment (connecting the sediment centroid with the rotating point).
Since the non-uniform sediment condition is considered in the present study, for simplicity, we apply the definition of equivalent sediment diameter D[17].eqThus the equation of the incipient motion of the sediment could be written as
The critical drag force FDcould be interpreted as
where CDis the drag force coefficient, and τcis the critical shear stress. From Eq.(6) and Eq.(7), the seepage force and the gravitational force could be expressed as
where Csand Cgare the coefficients related to the grain shape and the exposure,J is the average seepage gradient,γwis the unit weight of water, and γsis the unit weight of the sediment material. Substituting Eq.(12)-Eq.(14) into Eq.(11), and after rearranging, we obtain,
Table 3 Dimensionless critical shear stress on a slope with/without the consideration of seepage
Equation (15) is the expression of the dimensionless critical shear stresstaking the effects of both the slope and the seepage into consideration. It could be seen that on right hand side of Eq.(15), the first item represents the slope factor, and the second item represents the seepage factor. Given the condition that no seepage exists, Eq.(15) reduces as
Due to the random location of the sediment as shown in Fig.14, the relative position of the concerned sediment grain with the adjacent ones is uncertain, and the value of angleδwill also change accordingly. Yang[18]derived the formula for the mathematical expectation ofδby applying Han and He's relative exposure function[19]and it is E(tanδ)=1.11. If we assume that Cs=Cg, and similar to Eq.(10), taking the critical condition for F =1, we have

It is shown that from the upper edge of the seepage face downward, if taking no consideration of the effect of the seepage in the sediment threshold, the lower the place is, the smallerθwould be and the larger the critical shear stress (i.e.,) would become, which means that the sediment herein is harder to incipient.
On the contrary, however, if considering the effect of the seepage, the critical shear stress (i.e.,) would decrease with the reduction ofθ, which means that in the lower part of the slope the sediment is easier to incipient. The ratio ofandindicates that the existence of seepage has largely promoted the sediment incipient motion on the slope, and moreover,the lower it is, the greater contribution of the seepage to the sediment incipient would be.
3.4 Formation of the initial breaching point
In fact, Eq.(16) could also be applied to describe the critical shear stress that is required for the sediments upstream the upper edge of the seepage face. It could be seen that taking the upper edge of the seepage face as a distinguishing point (i.e., the point A in Fig.12 and Fig.13), only 0.7 to 0.395 times of the threshold stress is needed for the lower part as compared with the upper part (see Table 4). In the end of Stage II, when the overflow coming along the slope from the gully reaches the distinguishing point, a significanterosion with different manners would appear (see Fig.15): in the upstream, the little discontinuity (see Fig.13(a), i.e., as shown in the present experiment)will rapidly develop into a headcut[20-23]while in the downstream, an intense flush of the sediment will take place.
Fig.15 A sketch of the breach initiation
Additionally, even given the situation as shown in Fig.13(b), due to the different stress states for the sediments on both sides of the distinguishing point,the overflow would definitely give rise to a quick formation of a discontinuity and then a headcut as well for the same mechanism as previously discussed. Therefore, we define this distinguishing point at the moment TII-IIIas the initial breaching point. And from that time on, the dam will experience mega deformation and breaching.
4. Conclusions
In this paper, experimental and theoretical studies are carried out for the breach process of homogeneous non-cohesive dams by overtopping. Based upon the experimental results, a five-stage conceptual model is established to interpret the whole breach process, i.e.,Stage I, the seepage erosion, Stage II, the formation of the initial breach, Stage III the erosion toward the head, Stage IV the expansion and incision of the breach, and Stage V the re-equilibration of the river channel through the breach. It is shown that once triggered, the entire breach process goes continually without stop, which highlights the significant impact of the early stages on the later deformation of the dam.
The investigation reveals that the seepage flow through the dam in early stages is the Darcy flow, and it plays an important role in the breach initiation. Analysis shows that the initial breach of the dam is most likely to take place in the downstream slope of the dam, and more specifically, it would be near the upper edge of the seepage face. It is the first time that the exact initial breach location is identified with a strong evidence from both experimental observations and theoretical considerations. However, one has to accept that the Darcy flow condition of the seepage flow derived in the present study mainly based on the choice of the dam material. Although it could be consistent with the situation in many dams in nature, there are exceptions. Thus, further study of non-Darcy flow conditions is desirable.
In addition, it is shown in the present study that the erosion toward the head is the main pattern that the breach develops. In Stage IV, it is once again shown that the parallel retreat phenomenon might be an essential and decisive manner in the dam erosion. However due to the limitation of the experimental apparatus, the hydraulics in the developing breach channel is not fully revealed. In the follow-up research we will focus on this part of job.
[1] YIN Y., WANG F. and SUN P. Landslide hazards triggered by the 2008 Wenchuan earthquake, Sichuan,China[J]. Landslides, 2009, 8(2): 139-152.
[2] XU Q., FAN X. and HUAHG R. et al. Landslide dams triggered by the Wenchuan Earthquake, Sichuan Province, south west China[J]. Bulletin of Engineering Geology and The Environment, 2009, 68(3): 373-386.
[3] LIU Nin, ZHANG Jian-xin and LIN Wei et al. Draining Tangjiashan Barrier Lake after Wenchuan Earthquake and the flood propagation after the dam-break[J]. Science in China Series E:Technological Sciences, 2009,52(4): 801-809.
[4] CUI P., ZHU Y. and HAN Y. et al. The 12 May Wenchuan Earthquake-induced landslide lakes: Distribution and preliminary risk evaluation[J]. Landslides,2009, 6(3): 209-223.
[5] ZHANG Jian-yun, LI Yun and XUAN Guo-xiang et al. Overtopping breaching of cohesive homogeneous earth dam with different cohesive strength[J]. Science in China Series E: Technological Sciences, 2009, 52(10):3024-3029.
[6] ZHU Y.ong-hui, VISSER P. J., VRIJLING J. K. et al. Experimental investigation on breaching of embankments[J]. Science China Technological Sciences, 2011,54(1): 148-155.
[7] SINGH V. P. Dam breach modeling technology[M]. Boston, USA: Kluwer Academic Publishers, 1996, 34-45.
[8] COSTA J. E., SCHUSTER R. L. The formation and failure of natural dams[J]. Geological Society of America Bulletin, 1988, 100(7): 1054-1068.
[9] POWLEDGE G., RALSTON D. and MILLER P. et al. Mechanics of overflow erosion on embankments Part II:Hydraulic and design considerations[J]. Journal of Hydraulic Engineering, ASCE, 1989, 115(8): 1056-1075.
[10] VISSER P. J. Breach growth in sand-dikes[D]. Doctoral Thesis, Delft, The Netherlands: Delft University of Technology, 1998.
[11] COLEMAN S. E., ANDREWS D. P. and WEBBY G. Overtopping breaching of noncohesive homogeneous embankments[J]. Journal of Hydraulic Engineering,ASCE, 2002, 123(9): 829-838.
[12] YANG F., ZHOU X. and LIU X. et al. Experimental study of breach growth processes in sand dams of quake lakes[J]. Journal of Earthquake and Tsunami, 2011,5(5): 445-459.
[13] DANG C., CHU N. and DING Y. Predictive uncertainty of peak outflow relations for landslides dam breach[J]. Environmental Earth Sciences, 2014, 72(11): 4265-4271.
[14] CHANG D. S., ZHANG L. M. Simulation of the erosion process of landslide dams due to overtopping considering variations in soil erodibility along depth[J]. Natural Hazards and Earth System Science, 2010,10(4): 933-946.
[15] FOX G. A., WILSON G. V. and SIMON A. et al. Measuring streambank erosion due to ground water seepage:Correlation to bank pore water pressure, precipitation and stream stage[J]. Earth Surface Processes and Landforms, 2007, 32(10): 1558-1573.
[16] HARR M. E. Groundwater and seepage[M]. New York, USA: Dover Publications Inc., 2011, 34-95.
[17] LIU Xing-nian. Gravel bed-load transport and its modelling[D]. Doctoral Thesis, Chengdu, China:Sichuan University, 2004(in Chinese).
[18] YANG Feng-guang. Study on the stochastic theory of sediment transport[D]. Dotoral Thesis, Chengdu,China: Sichuan University, 2009(in Chinese).
[19] HAN Q., HE M. Stochastic theory of sediment motion[C]. The proceedings of the Eighth International Symposium on Stochastic Dydraulics. Beijing, China,2000.
[20] HANSON G. J., COOK K. R. and HUNT S. L. Physical modeling of overtopping erosion and breach formation of cohesive embankments[J]. Transactions of the ASAE, 2005, 48(5): 1783-1794.
[21] FRENETTE R., PESTOV I. Flow and erosive stresses at the base of a headcut[J]. Journal of Hydraulic Engineering, ASCE, 2005, 131(2): 139-141.
[22] CHEN L. K., CHEN S. C. Retrogressive erosion and longitudinal profile evolution in noncohesive material[J]. International Journal of Sediment Research,2006, 21(2): 113-122.
[23] ZHAO G., VISSER P. J. and PEETERS P. et al. Headcut migration prediction of the cohesive embankment breach[J]. Engineering Geology, 2013, 164(18): 18-25.
* Project supported by the National Natural Science Foundation of China (Grant Nos. 51479128, 51279117).
Biography: YANG Yang (1986- ), Male, Ph. D.
LI Wen-ping,
E-mail: liwpzy@126.com
猜你喜欢
杂志排行

水动力学研究与进展 B辑的其它文章
- An effective method to predict oil recovery in high water cut stage*
- Impact of bridge pier on the stability of ice jam*
- Implicit large eddy simulation of unsteady cloud cavitation around a planeconvex hydrofoil*
- Prediction of ship-ship interactions in ports by a non-hydrostatic model*
- Flow hydrodynamics in embankment breach*
- The variations of suspended sediment concentration in Yangtze River Estuary*