Enhancing Structural Stability and Pervaporation Performance of Composite Membranes by Coating Gelatin onto Hydrophilically Modified Support Layer*
2014-07-18WUHong吴洪LUXia芦霞LIXianshi李宪实LIYifan李奕帆ZHAOCuihong赵翠红andJIANGZhongyi姜忠义
WU Hong (吴洪), LU Xia (芦霞), LI Xianshi (李宪实), LI Yifan (李奕帆), ZHAO Cuihong (赵翠红)and JIANG Zhongyi (姜忠义),2,**
1Key Laboratory for Green Chemical Technology of Ministry of Education, School of Chemical Engineering and Technology, Tianjin University, Tianjin 300072, China
2Synergetic Innovation Center of Chemical Science and Engineering (Tianjin), Tianjin 300072, China
3Tianjin Key Laboratory of Membrane Science & Desalination Technology, Tianjin 300072, China
Enhancing Structural Stability and Pervaporation Performance of Composite Membranes by Coating Gelatin onto Hydrophilically Modified Support Layer*
WU Hong (吴洪)1,2,3, LU Xia (芦霞)1, LI Xianshi (李宪实)1, LI Yifan (李奕帆)1, ZHAO Cuihong (赵翠红)1and JIANG Zhongyi (姜忠义)1,2,**
1Key Laboratory for Green Chemical Technology of Ministry of Education, School of Chemical Engineering and Technology, Tianjin University, Tianjin 300072, China
2Synergetic Innovation Center of Chemical Science and Engineering (Tianjin), Tianjin 300072, China
3Tianjin Key Laboratory of Membrane Science & Desalination Technology, Tianjin 300072, China
The interfacial compatibility of composite membrane is an important factor to its structural stability and separation performance. In this study, poly (ether sulfone) (PES) support layer was first hydrophilically modified with poly(vinyl alcohol) (PVA) via surface segregation during the phase inversion process. Gelatin (GE) was then cast on the PVA-modified PES support layer as the active layer followed by crosslinking to fabricate composite membranes for ethanol dehydration. The enrichment of PVA on the surface of support layer improved interfacial compatibility of the as-prepared GE/PVA-PES composite membrane. The water contact angle measurement and X-ray photoelectron spectroscopy (XPS) data confirmed the surface segregation of PVA with a surface coverage density of ~80%. T-peel test showed that the maximal force to separate the support layer and the active layer was enhanced by 3 times compared with the GE/PES membrane. The effects of PVA content in the support layer, crosslinking of GE active layer and operating parameters on the pervaporative dehydration performance were investigated. The operational stability of the composite membrane was tested by immersing the membrane in ethanol aqueous solution for a period of time. Stable pervaporation performance for dehydration of 90% ethanol solution was obtained for GE/PVA-PES membrane with a separation factor of ~60 and a permeation flux of ~1910 g·m−2·h−1without peeling over 28 days immersion.
surface segregation, composite membrane, interfacial stability, pervaporation, ethanol dehydration
1 INTRODUCTION
Pervaporation, as a novel and green separation process, has great potential applications in dehydration of aqueous-organic mixtures [1, 2], removal of trace volatile organic compounds from aqueous solution [3, 4], and separation of organic-organic solvent mixtures [5, 6]. It is expected that composite pervaporation membranes composed of a thin active layer and a chemically different asymmetric porous support layer, will give high flux and high selectivity simultaneously. However, the interfacial incompatibility of the two layers due to their different hydrophilicity is prone to cause severe disintegration, rapidly reducing pervaporation performance [7].
A number of approaches have been adopted to improve the structural stability of the composite membranes including modification of both active layer and support layer. For active layer, modification methods include cross-linking of the top layer [8, 9], multi-layer structure strategy [10], and integrally skinned structure approach [11]. The modification of active layer often exerts an unfavorable effect on the pervaporation performance by adding diffusion resistance. The modification of support layer can be conducted prior to [12], during [13], or after [14] the membrane formation process. Among these methods, modification during membrane formation seems to be particularly prominent because of its stable structure and easy operation. The modification of support layer can improve the interfacial compatibility and consequent structural stability and mechanical property with little impact on pervaporation performance. Surface segregation as a simple and effective modification method, has been successfully used in hydrophilic modification of composite membrane support layer [15, 16]. In typical non-solvent phase inversion process for membrane fabrication, thermodynamic and kinetic driving forces make relatively more hydrophilic polymer move in the casting solution and enrich at the interface, resulting in a more hydrophilic membrane surface.
Gelatin (GE), as a green polymer membrane material, has been extensively applied in pharmacology and cosmetic due to its good water-solubility, nontoxicity, no irritation, and good biocompatibility. Yoshikawaa et al. used gelatin to blend with poly-(amide imide) for dehydration of aqueous 2-propanol mixtures with relatively high permselectivity [17]. The permselectivity toward water increased with gelatin mass content until reached around 14.0%. Teli et al. blended gelatin and chitosan to prepare pervaporation membranes for dehydration of 1,4-dioxane [18]. The introduction of gelatin improved the morphology andductility of chitosan [19]. Gelatin is a good membrane material for pervaporative dehydration because of its high hydrophilicity. Fabrication of composite membrane with a thin active layer and a mechanically stable support layer is required for industrial applications to meet the requirements of large flux and sufficient selectivity. Therefore, the interfacial stability plays a determinate role in long-term operational stability.
The aim of this study is to enhance the interfacial compatibility and structural stability of the gelatin/ poly(ether sulfone) (GE/PVA-PES) composite membrane by hydrophilic surface modification of poly(ether sulfone) (PES) support layer. Poly(vinylalcohol) (PVA) is introduced to the surface of asymmetric PES support membrane through segregation during the phase inversion process. To suppress the swelling of GE active layer, glutaraldehyde (GA) is utilized as the cross-linker. Pervaporation dehydration of ethanol aqueous solution is investigated over a wide range of operating temperature and feed concentration to demonstrate the effects of PVA content and cross-linking degree on the separation performance of the composite membranes.
2 EXPERIMENTAL
2.1 Materials
Gelatin (type A, from porcine skin, Bloom 300, isoelectric point pI=8.5) was purchased from Sigma-Aldrich, USA. PES 6020P (Mw=29000) was purchased from BASF Co. (Germany) and dried at 110 °C for 12 h before use. Glutaraldehyde (50%, by mass), HCl, absolute alcohol and poly(vinyl alcohol) [PVA, with an average degree of polymerization of (1750±50)], were obtained from Tianjin Guangfu Fine Chemical Research Institute, China. All the reagents were of analytical grade and used without further purification. Deionized water was used throughout all experiments.
2.2 Membrane preparation
2.2.1 Preparation of PVA-PES asymmetric support membranes
PVA and PES polymers were dissolved separately in dimethyl sulfoxide (DMSO) to get solutions with mass concentrations of 10% for PVA and 25% for PES. The solutions were stirred for 4 h at temperature of 60 °C and then left for 6 h to allow complete release of bubbles. The two polymer solutions were mixed at a specific ratio and stirred for 2 h to ensure a homogeneous mixing. The mixture was cast on a steel plate and immediately immersed into coagulation bath of deionized water. The membrane was peeled off from the steel plate, rinsed with water and dried for use.
2.2.2 Preparation of GE/PVA-PES composite membranes
GE solution was prepared by dissolving gelatin in deionized water at 60 °C and cooling down to 30 °C. A certain amount of GA solution (2.5%, by mass) was added to the GE solution. Then, the upper side of the formerly prepared PVA-PES asymmetric support membrane was fixed on a glass plate and soaked in the GA-GE mixture solution for a period of time, taken out, rinsed with water and dried at room temperature. The as-prepared composite membranes were designated as GA(X)GE(Y)/PVA(A)-PES(B), where X, Y, A and B are the mass percents of GA (1.25%-5%), GE in aqueous solution (2%-6%), PVA (0-3%) and PES in cast solution (17%-20%), respectively.
2.3 Characterization
The chemical composition of the PVA-PES asymmetric membrane surface was analyzed by X-ray photoelectron spectroscopy (XPS, Mg Kα1254.0 eV, PHI-1600, USA) with the photoelectron takeoff angle of 90°. For the composite membrane, Fourier transform infrared (FT-IR) spectra were scanned (3200-800 cm−1) using a Nicolet 560 instrument equipped with attenuated total reflectance accessory and the morphology was observed using a field emission scanning electron microscope (SEM, Nanosem 430, FEI, USA).
The static contact angles of water on the PVA-PES membranes with various PVA contents were measured at ambient temperature using a contact angle goniometer (JC2000C Contact Angle Meter, Powereach Co., Shanghai, China). A water drop with a volume of 5 μl was dropped onto the membrane with a microsyringe. Six contact angles at different locations on each sample were recorded and three samples were measured for each membrane. The error of measurement for each sample was around ±5%.
To investigate the interfacial adhesion strength of composite membrane, T-peel adhesion strength test was carried out on a Micro Uniaxial Fatigue Testing system (MUT-1020, CMC). The membrane sample with a size of 8 mm (width)×20 mm (length) was used for measurement at a loading rate of 0.5 mm·s−1at room temperature. The displacement-dependent load curve was also recorded.
2.4 Pervaporation experiments
The apparatus and flow chart for pervaporation experiments were illustrated in Fig. 1. The effective membrane area in contact with the feed was about 28 m2. The feed solution was pumped across the membrane surface at a flow rate of 60 L·h−1. The pressure of downstream side was kept at 0.33 kPa by a vacuum pump, and the permeate vapor was collected in a liquid nitrogen cold trap. The permeation flux, g·m−2⋅h−1, was calculated by
where Q (g) is the total mass permeated in time t (h), and A (m2) is the effective membrane area.

Figure 1 Schematic diagram of the pervaporation equipment1—heater; 2—thermal couple; 3—feed tank; 4—feed pump; 5—rotor flowmeter; 6—membrane cell; 7—permeant collection tube; 8—liquid nitrogen trap; 9—drier; 10—buffer; 11—vacuum pump
The feed and permeate compositions were analyzed by HP4890 gas chromatography equipped with a column packed with GDX103 (Tianjin Chemical Reagent Co., China) and a thermal conductivity detector. The injector and detector temperatures were 220 °C and 250 °C, respectively. The oven was operated at variable-programmed temperature, from 180 °C to 240 °C at a rate of 20 °C·min−1. The separation selectivity of membrane is described by separation factor,

where P and F are the mass fractions of water (subscript W) and ethanol (subscript E) in the permeate and feed solutions, respectively. Unless otherwise specified, all the pervaporation experiments were performed using 90% ethanol aqueous solution at 353 K.
The pervaporation separation index (PSI) is calculated by

In order to elucidate the intrinsic separation properties of membrane materials excluding the influence of driving force, normalized permeation flux (permeance) and membrane selectivity are evaluated. When the driving force is taken into account, a transport equation for the pervaporation process is defined as follows according to the solution-diffusion model [20],

where Jiis the partial permeate flux of component i (i=W, E), Qiis the pressure-normalized permeation flux of component i through the membrane (the permeance, which equals the partial flux divided by partial pressure difference over the membrane), χiand yiare the mole fractions of component i in the feed and the permeate, respectively, γiis the activity coefficient of component i inthe feed and is calculated using VanLaar equations, is the saturation vapor pressure of pure i at the feed temperature determined from the Antoine equation, and ppermeateis the pressure on the permeate side. The membrane selectivity β is an intrinsic property of membrane material, defined as the ratio of water permeance over ethanol permeance,
2.5 Swelling measurements and sorption experiments
To investigate the effect of preferential sorption of permeate compositions on the membrane separation selectivity, the swelling experiment was performed. The homogeneous GE membranes were dried at room temperature, weighed and immersed in 90% ethanol solution at 80 °C for 24 h to reach sorption equilibrium. Then, the surface solution on the membrane samples were wiped off with tissue paper and the membrane samples were weighed again. The sorption experiments were repeated three times and the experimental error was within 5%. The degree of swelling (DS) is calculated by where Wsand Wdare the mass of the swollen and dry membranes (g), respectively.
The absorbed liquid in the membrane was then desorbed using a purge-and-trap apparatus, condensed in a liquid nitrogen trap, and analyzed by gas chromatography. The solubility selectivity (αS) is calculated by where M and F are the mass fractions of water (subscriptW) and ethanol (subscript E) in the membrane and feed solution, respectively.

Figure 2 XPS survey scan of the PVA (3)-PES (17) membrane surface
According to the solution-diffusion model, diffusion selectivity (αD) is calculated by αD=α/αS.
3 RESULTS AND DISCUSSION
3.1 Characterization of the support and composite membranes
3.1.1 XPS analysis of the support membrane surface Figure 2 shows the chemical composition of the PVA-PES support membrane surface determined by XPS analysis. The concentration of sulfur element on the PVA(3)-PES(17) membrane surface, which is attributed to the presence of PES, is determined to be 3.5%, which is an indicator of PES concentration. The near-surface coverage of PVA (φ) is calculated by
where NPESis the total mole number of C, O and S in a PES unit, NPVAis the total mole number of C, O and S in a PVA unit, and αSis the concentration of S element on membrane surface. The surface coverage of PVA for the PVA(3)-PES(17) membrane is calculated to be 80%, much higher than the relative content of PVA added to the membrane casting solution. The enrichment of PVA on membrane surface confirms the surface segregation during the phase inversion process.
3.1.2 Water contact angles of the support membranes The enrichment of PVA on the PVA-PES membrane surface may enhance the surface hydrophilicity. Water contact angle is an indicator to evaluate the effect of the addition of PVA on membrane surface hydrophilicity and the results are shown in Fig. 3. The pristine PES membrane with no PVA presents the highest water contact angle (76°), corresponding to the lowest hydrophilicity. With the increase of PVA content, the water contact angle decreases almost monotonously and reaches 54° at PVA content of 15%, which is 22° lower than that of pure PES membrane. The decrement of water contact angle confirms the successful hydrophilic modification on the support membrane by simultaneous segregation and enrichment of PVA to the membrane surface during phase inversion.
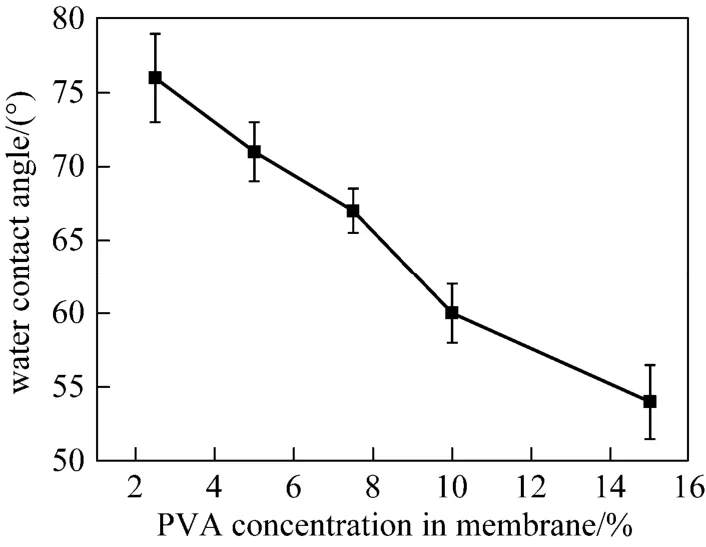
Figure 3 Water contact angles of the PVA-PES asymmetric support membranes with different contents of PVA
3.1.3 Morphology of the composite membrane
Figure 4 shows the cross-sectional morphology of the composite membranes prepared by casting GE solution on PES and PVA-PES support layer. The thickness of GE layer formed by the low concentration gelatine solution on PES and PVA-PES (a, b) is around 700 nm. The interfacial defects in the membrane using PES support (a) do not appear in that using PVA-PES support (b). For the composite membranes prepared using GE solution with a higher concentration (c, d), the gelatine layer is thick, with better interfacial boundary and transition region for the GE/PVA-PES membrane (d) compared to the GE/PES membrane (c). The introduction of PVA in PES support layer strengthens the interfacial adhesion and improves interfacial morphology.
3.1.4 FT-IR spectra of the composite membranes
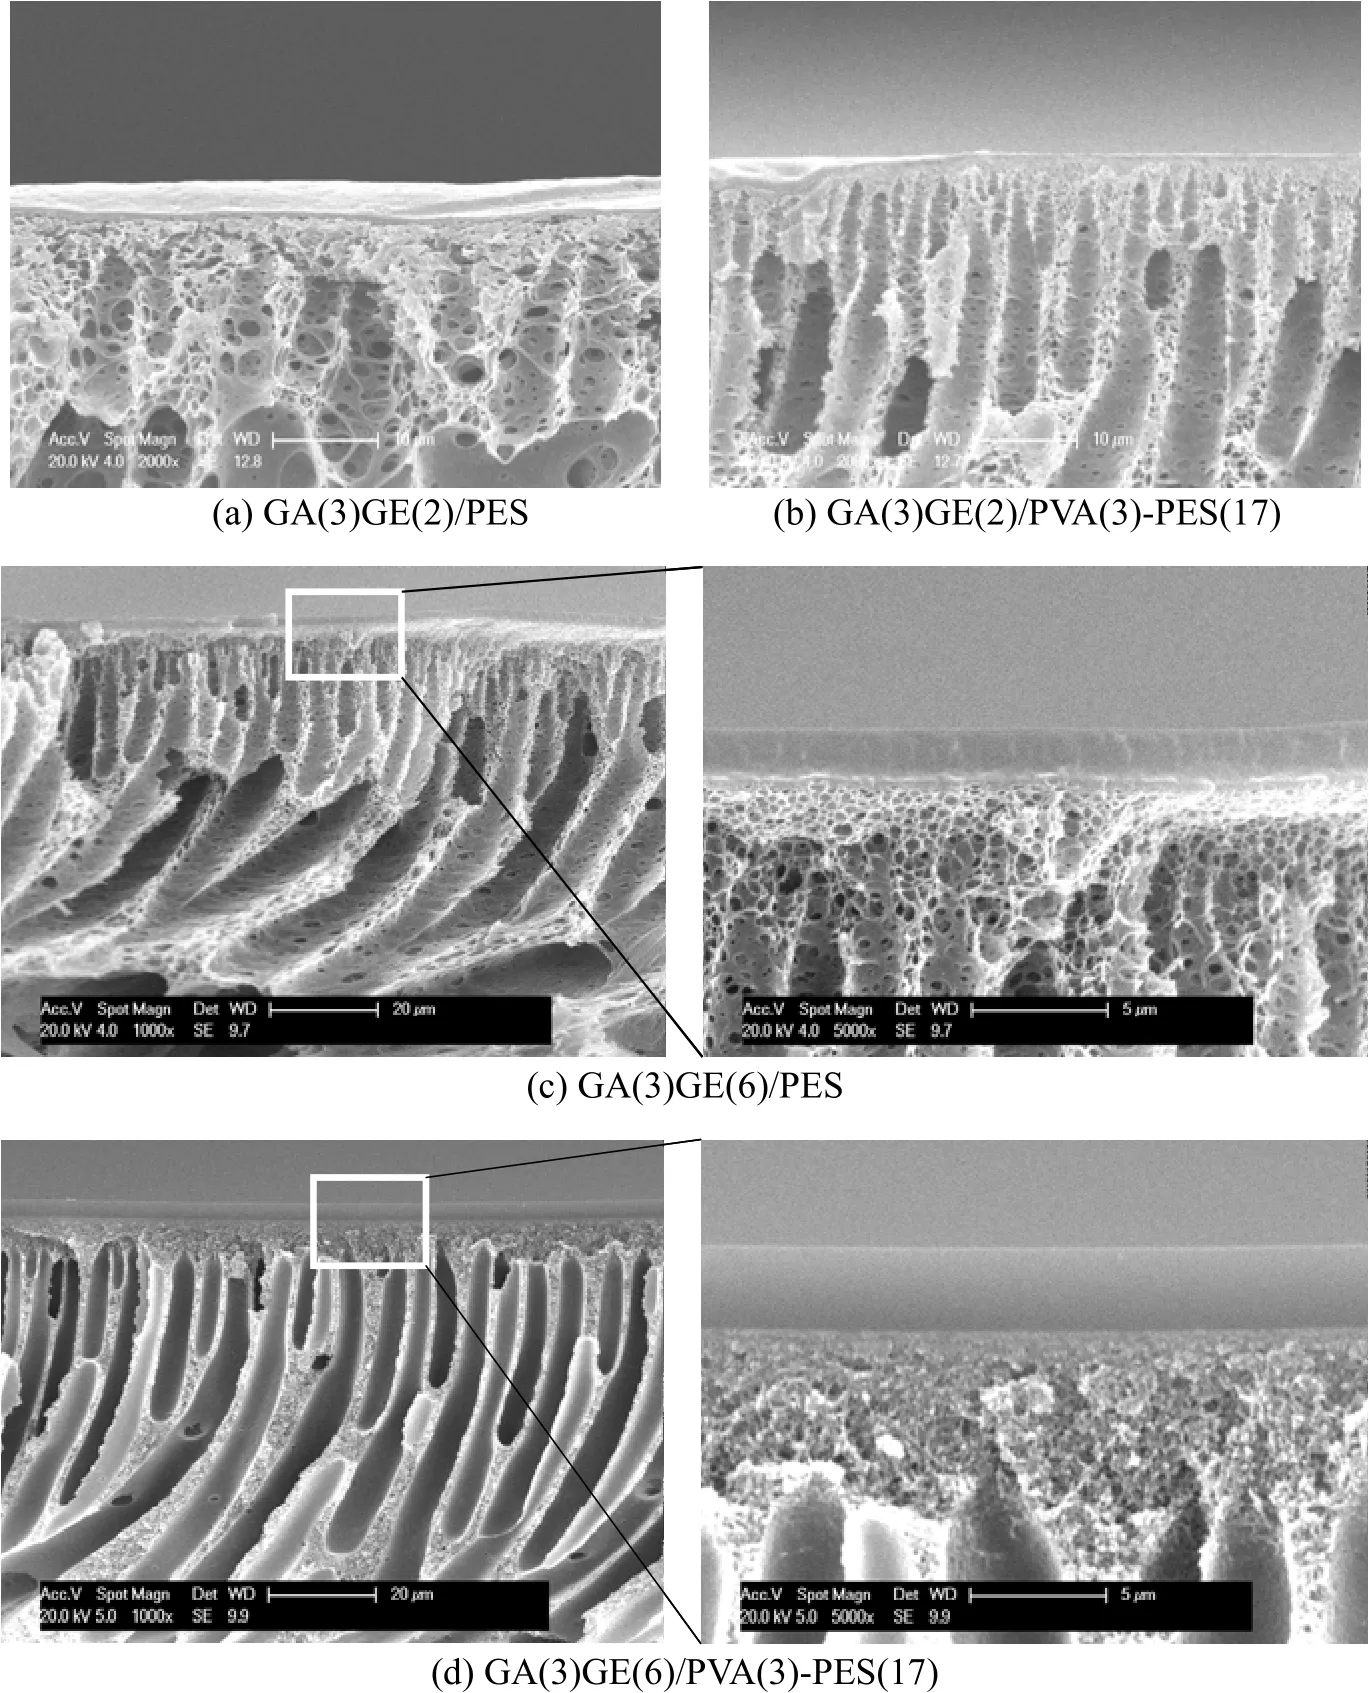
Figure 4 SEM images of the composite membranes

Figure 5 FT-IR spectra of composite membranes(a) PES; (b) GA(3)GE(2)/PES; (c) GA(3)GE(2)/PVA(3)-PES(17); (d) GA(3)GE(6)/PVA(3)-PES(17)
Figure 5 shows the FT-IR spectra of the PES membrane and the composite membranes with glutaraldehyde crosslinked gelatin layer and PVA-PES support layer. The absorption band at 1154 cm−1in the spectrum of PES (a) is assigned to OSO groups, and it still exists with a lower intensity in the spectrum of GE/PES membrane (b), indicating a non-uniform coverage of GE on the pure PES support due to the large difference in hydrophilic-hydrophobic property between the two layers. In comparison, this sulfone group band disappears in the spectrum of GE/PVA-PES composite membrane (c, d), suggesting a uniform and complete coverage of GE on the PVA-modified PES support layer. This improvement is attributed to the enhanced adhesive interaction between the more hydrophilic PVA-enriched support layer surface and the hydrophilic gelatin top layer.
3.1.5 T-peel adhesion strength of the composite membranes
The T-peel displacement-dependent load curve of the GE/PES and GE/PVA-PES membranes was measured as shown in Fig. 6 to investigate the adhesion strength between the active layer and the support layer. Typically, the peeling strength of GE/PVA-PES membrane (0.58 N) is three times that of GE/PES membrane (<0.18 N), so the hydrophilic surface modification of hydrophobic PES by PVA significantly enhances the interfacial adhesive strength.
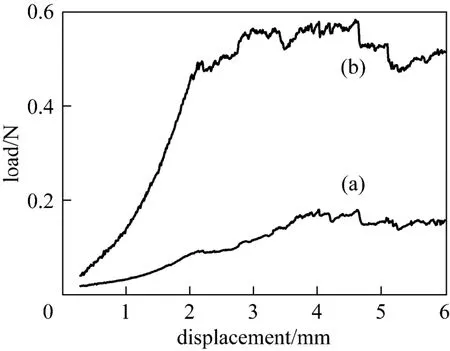
Figure 6 T-peel load-displacement curves for GA(3)GE(2)/ PES (a) and GA(3)GE(2)/PVA(3)-PES(17) (b) membranes
3.2 Pervaporation dehydration performance
3.2.1 Effect of cross-linking of GE layer
The gelatin layer is crosslinked with glutaraldehyde to improve the structural stability and separation performance in aqueous feed solution. The cross-linking degree is expressed as the molar radio of GA to GE monomer unit and its effects on the pervaporation performance of GE(2)/PVA-PES composite membranes with different GA contents are shown in Fig. 7. The separation factor increases with the increase of crosslinking degree, while the permeation flux decreases monotonically. Similar results were also reported for GA cross-linked poly(vinyl alcohol) membrane and sodium alginate membranes [21, 22].
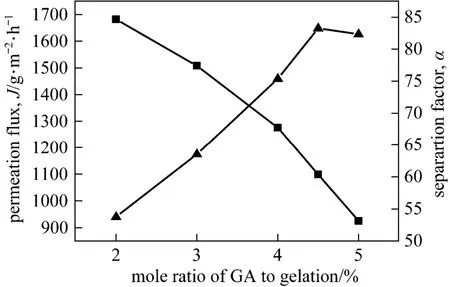
Figure 7 Effect of crosslinking degree on the pervaporation performance■ J; ▲ α

Figure 8 Effect of crosslinking degree on the membrane sorption selectivity and diffusion selectivitysorption selectivity;diffusion selectivity
The crosslinking results in a more compact polymer network structure and subsequently less swelling and a decrease in permeation flux [23]. It has been known that both the polymer network structure and the hydrophilicity/hydrophilicity property of membrane affect the separation factor. According to the solutiondiffusion mechanism, the separation factor can be expressed by the product of sorption selectivity and diffusion selectivity, i.e. α=αSαD. To further study the effects of crosslinking degree on the separation factor, its effects on the sorption selectivity and diffusion selectivity are analyzed and depicted in Fig. 8. The diffusion selectivity increases while the sorption selectivity decreases with the increase of cross-linking degree, clearly reflecting the two contrary effects of crosslinking on the variation trend of separation factor. Higher crosslinking degree leads to higher diffusion resistance for all the substances penetrating through the membrane, but this increase in resistance exerts a relatively greater influence on the diffusion of ethanol molecule since its kinetic radius (0.26 nm) is much larger than that of water molecule (0.13 nm) [24]. On the other hand, the increase in crosslinking degree reduces the hydrophilicity of membrane because of the addition of glutaraldehyde crosslinker and the consumption of hydrophilic groups on the gelatin chains. The above two effects increase the separation factor, reaching the maximum value of 83 at the crosslinking degree of 0.45.
3.2.2 Effect of PVA content in support layer
With the PVA chains segregated to the surface of PVA-PES support layer and enriched there, the PVA content will affect not only the interfacial adhesion with the gelatin top layer, but also the separation performance of the composite membrane. As shown in Fig. 9, the separation factor and permeation flux increase simultaneously with the increase of PVA concentration in the support layer. Higher hydrophilicity of the composite membrane due to the addition of hydrophilic PVA and thinner gelatin layer due to the enhanced interfacial adhesion increase both separation factor and permeation flux.
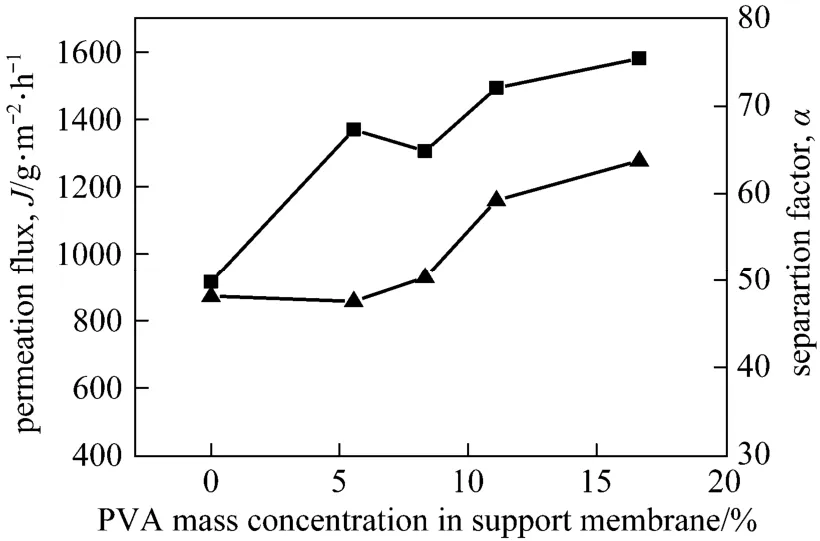
Figure 9 Effect of PVA concentration in support membrane on the pervaporation performance■ J; ▲ α
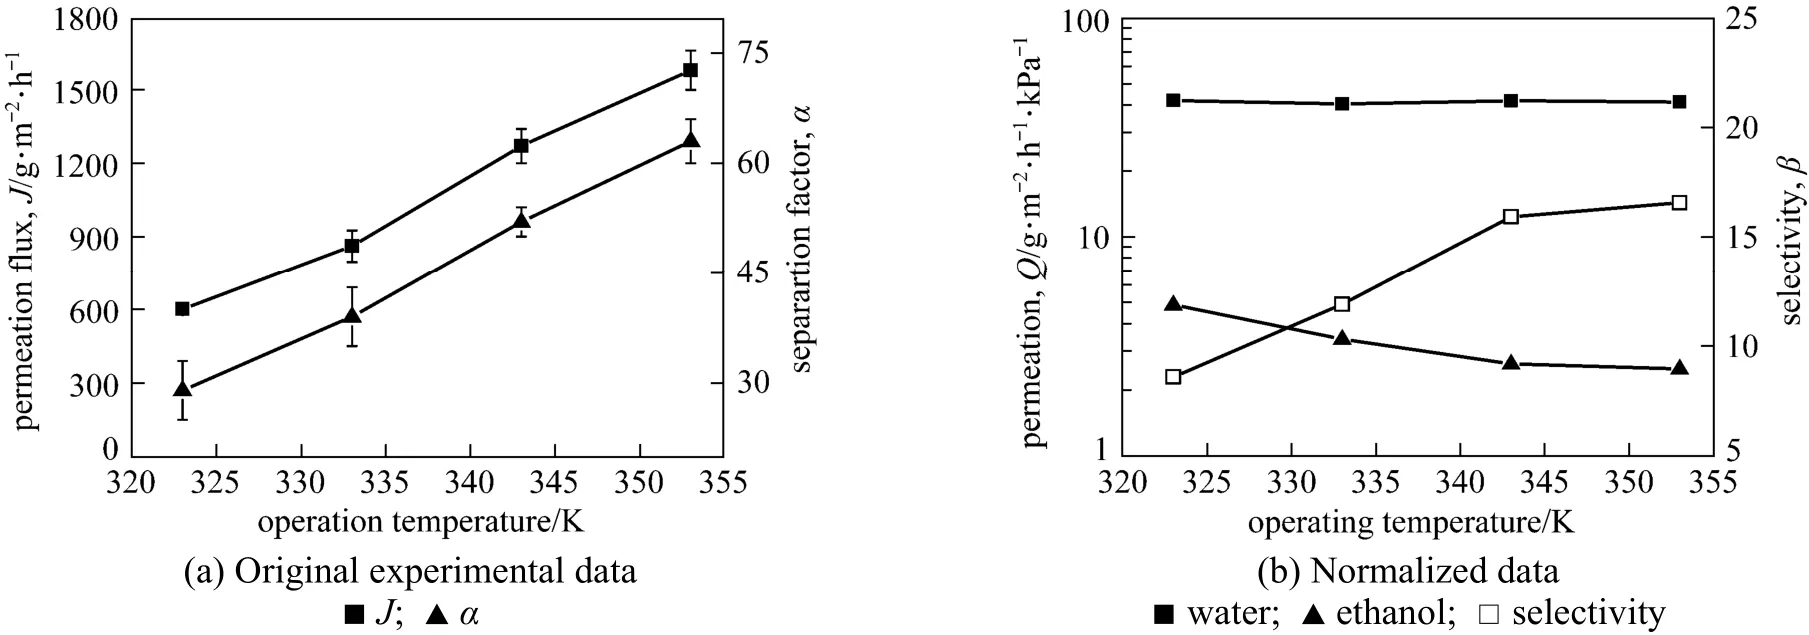
Figure 10 Effect of operating temperature on the pervaporation performance of the GA(3)GE(2)/PVA(3)-PES(17) membrane
3.2.3 Effect of operating temperature
Figure 10 depicts the effect of temperature on the permeation flux and separation factor of GA(3)GE(2)/ PVA(3)-PES(17) composite membrane for 90% ethanol aqueous solution with a flow rate of 60 L·h−1at downstream pressure of 0.3 kPa. Both the total permeation flux and separation factor increase with the operating temperature, from 600 g·m−2·h−1to 1580 g·m−2·h−1and from 30 to 63, respectively, as the temperature increases from 323 K to 353 K. Operating temperature affects the pervaporation performance by altering the membrane structure and separation driving force. To distinguish the contribution of these two factors, the normalized data reflecting the influence of variation in membrane structure are plotted in Fig. 10 (b) in terms of water permeance, ethanol permeance and selectivity. The normalized water permeance keeps constant within the temperature range and the ethanol permeance reduces slightly with the increase of temperature. Therefore, it is concluded that the increase of separation factor with temperature is mainly due to the enhanced driving force rather than the membrane itself. The saturation vapor pressure increases with temperature and enhances the transport driving force [25]. The dependence of permeation flux on temperature can be expressed by Arrhenius equation and the apparent activation energy (EP) is calculated accordingly,

where JP, AP, R and T are the permeation flux, pre-exponential factor, gas constant and temperature, respectively. The Arrhenius plots of lnJPversus temperature for water and ethanol are shown in Fig. 11. The good linearity for both water and ethanol flux in the given temperature range prove that the permeation behavior follows the Arrhenius law. The activation energy for water and ethanol are 35.1 and 9.5 kJ·mol−1, respectively. The much higher activation energy of permeation for water than that for ethanol indicates that the permeation rate of water will increase to a larger extent with the increase of temperature than that of ethanol, increasing the separation factor.
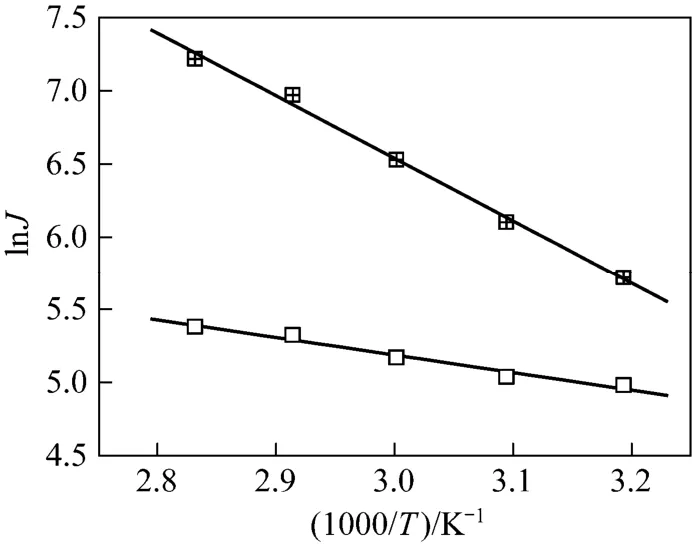
Figure 11 Arrhenius plots of permeation flux for separation of ethanol/water mixture by the GA(3)GE(2)/PVA(3)-PES(17) composite membranewater; □ ethanol
3.2.4 Effect of water concentration in feed

Figure 12 The effect of water concentration in the feed on the performance of GA(3)GE(2)/PVA(3)-PES(17) membrane■ total flux;water flux; □ ethanol flux; ▲ α
Figure 12 shows the effect of water mass concentration, ranging from 5% to 42%, in the feed on pervaporation properties of GC(3)GE(2)/PVA(3)-PES(17) composite membrane, with a flow rate of 60 L·h−1and downstream pressure of 0.3 kPa at 353 K. The water flux increases with water concentration in the feed while the ethanol flux decreases. This could be explained as follows. Large number of hydrophilic groups such as OH and NH2groups in the membrane resultsin more preferential interactions with water molecules rather than with ethanol molecules. Therefore, more water molecules diffuse through the membrane with the increase of water concentration in the feed. Meanwhile, the swelling of membrane also increases. As a result, the water flux and total flux increase with the water content in the feed. For the separation factor, it increases first with the increase of water concentration in the feed till 26% and then decreases due to over-swelling. At higher water concentration in the feed, more water molecules dissolve in the membrane, leading to a much looser network structure and subsequently a reduction in separation factor.
3.2.5 Operation stability test
In examining the long-term stability of the composite membrane, the membrane sample was immersed in 90% ethanol aqueous solution for 28 days and evaluated by pervaporation dehydration experiment at intervals. As shown in Fig. 13, the permeation flux and separation factor remained at about 1.9 kg·m−2·h−1and 60, respectively. No peeling was found for the GA-GE/PVA-PES composite membrane while peel-off occurred at the interface of GA-GE/PES composite membrane. This high operation stability proves the high structural stability of the composite membranes with the PVA-modified PES support layer.
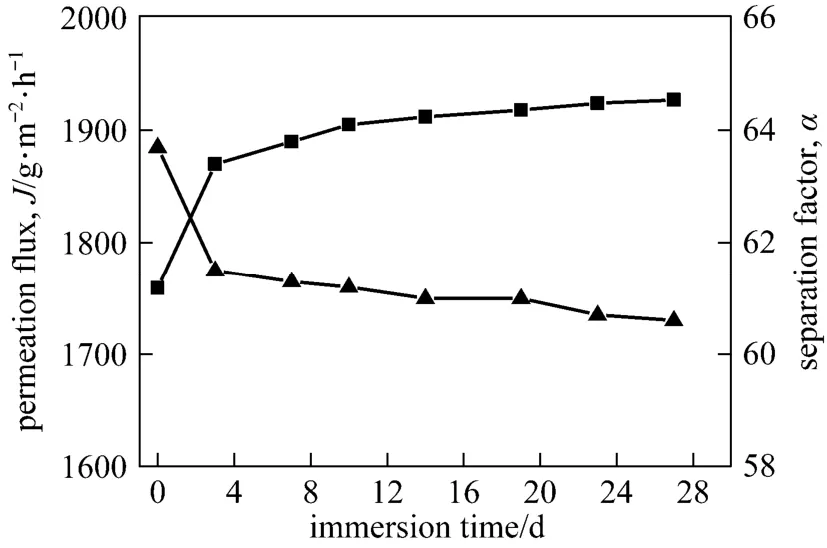
Figure 13 Effect of immersion time on the pervaporation performance of the GA(3)GE(2)/PVA(3)-PES(17) membrane■ J; ▲ α
4 CONCLUSIONS
This study demonstrates the enhancement of hydrophilicity of the support PES membrane and the structure stability of the composite membrane by the introduction of PVA. The dehydration performance of the GE/PVA-PES composite membrane is evaluated over a wide range of operating temperature and feed concentration. Based on the solution-diffusion model, the sorption process rather than diffusion process plays a dominant role in pervaporation dehydration of the composite membrane due to its high water sorption ability. The enhanced interfacial interaction, verified by T-peel test, renders the GE/PVA-PES membrane with desirable long-term operation stability, which shows good potential in practical applications.
REFERENCES
1 Chapman, P.D., Oliveira, T., Livingston, A.G., Li, K., “Membranes for the dehydration of solvents by pervaporation”, J. Membr. Sci., 318, 5-37 (2008).
2 Li, J.D., Chen, C.X., Han, B.B., Peng, Y., Zou, J., Jiang, W.J.,“ Laboratory and pilot-scale study on dehydration of benzene by pervaporation”, J. Membr. Sci., 203, 127-136 (2002).
3 Bengtsson, E., Tragardh, G., Hallstrom, B., “Concentration polarization during the enrichment of aroma compounds from a water solution by pervaporation”, J. Food Eng., 19 (4), 399-407 (1993).
4 Peng, M., Vane, L.M., Liu, S.X., “Recent advances in VOCs removal from water by pervaporation”, J. Hazard. Mater., 98, 69-90 (2003).
5 Smitha, B., Suhanya, D., Sridhar, S., Ramakrishna, M., “Separation of organic-organic mixtures by pervaporation—A review”, J. Membr. Sci., 244 (1), 1-21 (2004).
6 Enneking, L., Stephan, W., Heintz, A., “Sorption and diffusivity measurements of cyclohexane/benzene and cyclohexane/toluene mixtures in polyurethane membranes, model calculation of pervaporation process”, Ber. Bunsenges. Phys. Chem., 97 (7), 912-922 (1993).
7 Shao, P., Huang, R.Y.M., “Polymeric membrane pervaporation”, J. Membr. Sci., 287 (2), 162-179 (2007).
8 Guo, R.L., Fang, X., Wu, H., Jiang, Z.J., “Preparation and pervaporation performance of surface crosslinked PVA/PES composite membrane”, J. Membr. Sci., 322 (1), 32-38 (2008).
9 Zhan, X., Li, J.D., Huang, J.Q., Chen, C.X., “Pervaporation properties of PDMS membranes cured with different cross-linking reagents for ethanol concentration from aqueous solutions”, Chin. J. Polym. Sci., 27 (4), 533-542 (2009).
10 Chiou, J.J., “Composite gas separation membrane having a gutter layer comprising a crosslinked polar phenyl-containing-organopolysiloxane, and method for making the same”, U.S. Pat., 5286280 (1994).
11 Huang, R.Y.M., Feng, X., “Resistance model approach to asymmetric polyetherimide membranes for pervaporation of isopropanol/water mixtures”, J. Membr. Sci., 84, 15-27 (1993).
12 Freger, V., Gilron, J., Belfer, S., “TFC polyamide membranes modified by grafting of hydrophilic polymers: an FT-IR/AFM/TEM study”, J. Membr. Sci., 209 (1), 283-292 (2002).
13 Muraza, O., Rebrov, E.V., Khirnyak, T., Johnson, B., Kooyman, P., Lafont, U., “Mesoporous silica films as catalyst support for microstructured reactors: Preparation and characterization”, Chem. Eng. J., 135, S99-S103 (2008).
14 Yu, C.H., Kusumawardhana, I., Lai, J.Y., Liu, Y.L.,“PTFE/polyamide thin-film composite membranes using PTFE films modified with ethylene diamine polymer and interfacial polymerization: preparation and pervaporation application”, J. Colloid Interf. Sci., 336 (1), 260-267 (2009).
15 Wu, H., Li, X.S., Nie, M.C., Li, B., Jiang, Z.Y., “Integral PVA-PES composite membranes by surface segregation method for pervaporation dehydration of ethanol”, Chin. J. Chem. Eng., 19 (5), 855-862 (2011).
16 Wu, H., Li, X., Zhao, C.H., Shen, X.H., Jiang, Z.Y., Wang, X.F.,“Chitosan/sulfonated polyethersulfone-polyethersulfone (CS/SPES-PES) composite membranes for pervaporative dehydration of ethanol”, Ind. Eng. Chem. Res., 52, 5772-5780 (2013).
17 Yoshikawaa, M., Higuchia, A., Ishikawaa, M., “Vapor permeation of aqueous 2-propanol solutions through gelatin/Torlon®poly(amideimide) blended membranes”, J. Membr. Sci., 243, 89-95 (2004).
18 Teli, S.B., Gokavi, G.S., Tak, T., “Chitosan/gelatin blend membranes for pervaporation dehydration of 1,4-dioxane”, Sep. Sci. Technol., 44 (13), 3202-3223 (2009).
19 Zhao, J., Ma, J., Chen, J., Pan, F.S., Jiang, Z.Y., “Experimental and molecular simulation investigations on interfacial characteristics of gelatin/polyacrylonitrile composite pervaporation membrane”, Chem. Eng. J., 178, 1-7 (2011).
20 Wijmans, J.G., “Process performance=membrane properties plus operating conditions”, J. Membr. Sci., 220 (1-2), 1-3 (2003).
21 Guo, R.L., Hu, C.L., Li, B., Jiang, Z.Y., “Pervaporation separation of ethylene glycol/water mixtures through surface crosslinked PVA membranes: Coupling effect and separation performance analysis”, J. Membr. Sci., 289, 191-198 (2007).
22 Zhang, X.K., Pooljari, Y., Drechsler, L.E., Kuo, C.M., Fried, J.R., Clarson, S.J., “Pervaporation of organic liquids from binary aqueous mixtures using poly(trifluoropropylmethylsiloxane) and poly(dimethylsiloxane) dense membranes”, J. Inorg. Organomet. Polym., 18 (2), 246-252 (2008).
23 Devi, D.A., Smitha, B., Sridhar, S., Aminabhavi, T.M., “Pervaporation separation of isopropanol/water mixtures through crosslinked chitosan membranes”, J. Membr. Sci., 262, 91-99 (2005).
24 Tamai, Y., “Molecular simulation of permeation of small penetrants through membranes. 1. Diffusion coefficients”, Macromolecules, 27 (16), 4498-4508 (1994).
25 Sommer, S., Melin, T., “Influence of operation parameters on the separation of mixtures by pervaporation and vapor permeation with inorganic membranes. Part 1: dehydration of solvents”, Chem. Eng. Sci., 60 (16), 4509-4523 (2005).
10.1016/S1004-9541(14)60015-X
2013-09-01, accepted 2013-10-31.
* Supported by the New Century Excellent Talents in University (NCET-10-0623), National Natural Science Foundation for Distinguished Young Scholars (21125627), National Basic Research Program of China (2009CB623404), and State Key Laboratory for Modification of Chemical Fibers and Polymer Materials (Dong Hua University).
** To whom correspondence should be addressed. E-mail: zhyjiang@tju.edu.cn
猜你喜欢
杂志排行

Chinese Journal of Chemical Engineering的其它文章
- Influence of Design Margin on Operation Optimization and Control Performance of Chemical Processes*
- A Group Contribution Method for the Correlation of Static Dielectric Constant of Ionic Liquids*
- Measurement and Modeling for the Solubility of Hydrogen Sulfide in Primene JM-T*
- Photocatalytical Inactivation of Enterococcus faecalis from Water Using Functional Materials Based on Natural Zeolite and Titanium Dioxide*
- Kinetic Study on Extraction of Red Pepper Seed Oil with Supercritical
- Interaction Analysis and Decomposition Principle for Control Structure Design of Large-scale Systems*