黄海细纹狮子鱼种群特征的年际变化
2013-12-09陈云龙单秀娟周志鹏戴芳群李忠炉金显仕
陈云龙,单秀娟,周志鹏,戴芳群,李忠炉,金显仕,*
(1. 中国海洋大学水产学院, 青岛 266003; 2. 山东省渔业资源与生态环境重点实验室,中国水产科学研究院黄海水产研究所,青岛 266071;3. 广东海洋大学水产学院, 湛江 524088)
黄海细纹狮子鱼种群特征的年际变化
陈云龙1,2,单秀娟2,周志鹏2,戴芳群2,李忠炉3,金显仕2,*
(1. 中国海洋大学水产学院, 青岛 266003; 2. 山东省渔业资源与生态环境重点实验室,中国水产科学研究院黄海水产研究所,青岛 266071;3. 广东海洋大学水产学院, 湛江 524088)
根据1958—2010年冬季黄海渔业资源底拖网调查获得的细纹狮子鱼(Liparistanakae)生物学数据,对4个不同年代间黄海细纹狮子鱼的空间分布、相对资源密度、生长特征和繁殖特性等特征的年际变化进行了分析。结果表明:细纹狮子鱼在黄海北部主要分布在辽东半岛一侧50 m等深线附近,在黄海中南部1958—1959年集中分布在黄海中部,1985年其分布范围明显扩大,1993—1994年和1999年其分布区域发生北移,高产区集中在36°N以北,2005年重新扩散至整个黄海中南部,2010年主要分布在石岛东南部(35.5—36.5°N,123.5 —124.5°E)和江苏南部外海(33.5—34.5°N,123—124°E)的两个区域。出现频率以1985年最高,达87.5%,相对资源密度以1993—1994年最大,为15.5 kg/h。近10年相对资源密度与海表温度呈极显著负相关(Plt;0.01),出现频率和海表温度呈负相关关系(P=0.051)。1985年、1999—2001年、2005年和2010年平均体长分别为35.1、33.9、33.8 cm和32.3 cm,呈逐渐减小的趋势。除1985年外,雄性平均体长均显著大于雌性(Plt;0.05)。各年份性比均与1∶1无显著差异,但各体长组间差异较为明显。伴随着Ⅲ期所占的比例逐渐上升(6.7%—71.8%),细纹狮子鱼性成熟比例(Ⅳ期及以上)逐渐降低(51.1%—23.9%)。
细纹狮子鱼;生物学特征;空间分布;黄海
细纹狮子鱼属鮋形目Scorpaeniformes、狮子鱼科Liparidae、 狮子鱼属Liparis,大中型底层鱼类,广泛分布于东北太平洋近岸寒温带水域,以黄海中南部产量最高,东海北部为其分布南限[1- 3]。细纹狮子鱼属于低值鱼类, 国内无专门捕捞,长期作为底拖网的兼捕种,利用不足[3- 4]。在1975—1983年秋季太平洋鲱探捕中,细纹狮子鱼占试捕总渔获量的百分比从1975年的1.69%增至1982年的25.13%[5],现已成为黄海渔业资源优势种[6],在黄海食物网中占据关键地位[7]。目前,黄鮟鱇Lophiuslitulon和细纹狮子鱼Liparistanakae已经取代蓝点马鲛Scomberomorusniphonius、星康吉鳗Congemyriaster和带鱼Trichiuruslepturus等鱼类,成为黄海生态系统的顶级捕食者[8]。顶级捕食者的波动会通过食物网下行效应(top-down effect)影响其他种类的丰度[9],细纹狮子鱼具有季节性变动较大,生长迅速[10],生命周期相对较短,对外界环境变化响应较明显的特点,因此对其种群进行长期监测是十分有益且必要的。目前对细纹狮子鱼种群生物学变化的研究较少[11- 12],国内对其研究主要涉及摄食生态[13- 15]和寄生虫学[16],对其种群长期动态方面还未见报道。本文以黄海水产研究所自20世纪50年末以来的底拖网调查数据为基准,分析细纹狮子鱼资源长期动态,探讨外界环境对其种群丰度和生物学特征的影响,以期为黄海渔业生态系统的开发、管理和保护提供基础资料。
1 材料与方法
1.1 数据来源
数据来源于各年冬季黄海底拖网调查,调查时间为11月—2月初,翌年1月和2月调查数据归为前一年,共计17个航次,分别为1958、1959、1960、1985、1993、1994、1999、2000、2001、2002、2003、2004、2005、2006、2007、2009和2010年。调查范围为整个黄海(33°—39°N,121.5°—124.5°E),以37°N作为黄海北部和黄海中南部调查区的分界限。1958—1960年取样使用双船(约149.0 kW×2)底拖网,1985年至今采用“北斗”号调查船(1677.8 kW),船舶参数如表1。生物学测定细纹狮子鱼样品共计667 尾,分别为1985年97 尾;2000—2001年61 尾;2005年222 尾;2010年287 尾。生物学测定指标包括体长、体重、性别和性腺成熟度。
细纹狮子鱼(12月—2月)取样海域的年平均海表温度下载自哥伦比亚大学海洋环境数据库[http:// iridl. ldeo. columbia.edu],范围为32.5—36.5°N,121.5—124.5°E,分辨率为1°×1°。
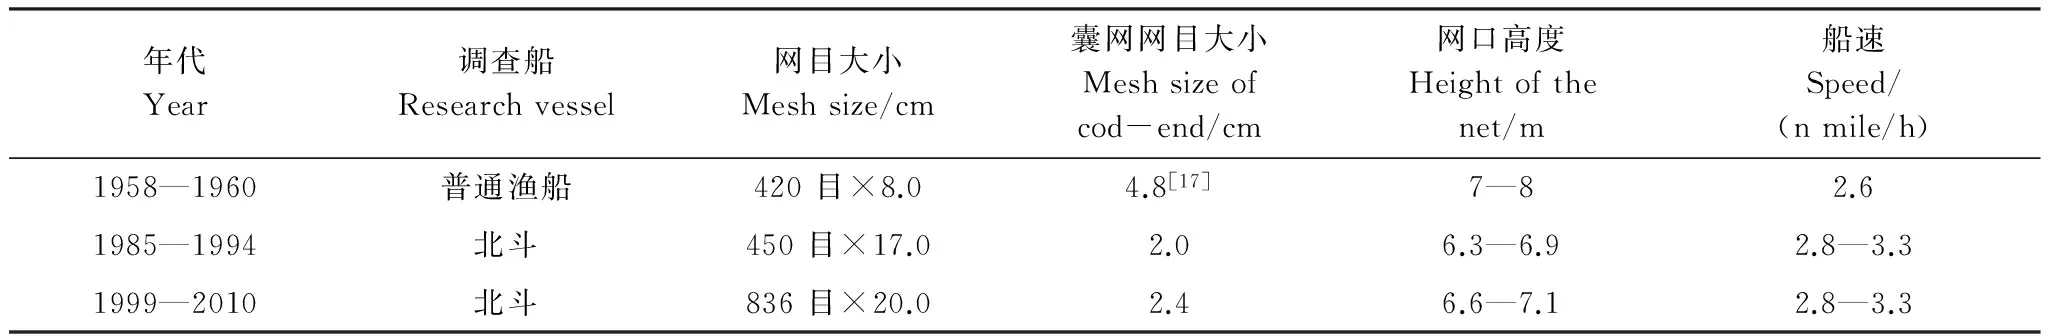
表1 各航次调查船和网具
1.2 数据处理
各站位拖网时间均标准化为1 h,并根据网口面积标准化渔获数据[18]。相对资源密度以单位时间渔获量(kg/h)表示, 各年平均相对资源密度以平均单位时间渔获量(kg/h)表示。
生物学测定中,体长和体重分别精确到1 mm和0.1 g,以2 cm分组计算优势体长,体长-体重关系用幂指数方程表示:W=aLb。W为体重(g),L为体长(cm),其中a为条件因子,b为异速增长因子[19]。协方差分析(ANCOVA)检验性别间体长-体重关系差异性,若无显著差异,则合并雌、雄及未发育个体以拟合体长体重关系。
性别、性腺成熟度和摄食等级采用目测法,性腺按照Ⅰ—Ⅵ期[20]划分,并规定Ⅳ期以上(即Ⅳ—Ⅵ期)为性成熟。细纹狮子鱼性比与1∶1的差异以20 mm为间隔运用卡方检验(χ2检验)进行分析,肥满度公式[19]为C=W/L3×100,L为体长(cm),W采用体重(g)。
数据采用Excel 2007、SPSS 18.0和Surfer 9.0进行统计和处理。
2 结果
2.1 种群空间分布的变化
黄海中南部细纹狮子鱼相对资源密度的空间分布及相对资源密度和出现率的年际变化见分别见图1和表2。在黄海北部,细纹狮子鱼主要分布在辽东半岛一侧50 m等深线附近,中部深水区分布较少,1999年分布区域较1958年相比有所扩大。其中在黄海北部1958年出现频率为20.8%,相对资源密度最高为31.5 kg/h,1985年在黄海北部仅1个站位出现,为1.2 kg/h,1999年出现频率为66.7%,相对资源密度最高为37.2 kg/h。
在黄海中南部,1958—1959年相对资源密度集中分布在黄海中部,特别是34°N附近,最高为63.0 kg/h。1958年在近岸区域也有分布,但相对资源密度小于黄海中部,最高为21.0 kg/h。1985年其分布范围明显扩大,广泛分布于黄海海槽区域,出现率为87.5%,相对资源密度相对均匀,在50 m等深线附近稍高。1993—1994年和1999年相比1985年和1958—1959年,细纹狮子鱼的分布区域发生北移,高产区集中在36°N以北,出现率为45.8%,相对资源密度最高值出现在1993—1994年间,为160 kg/h,占当年调查的44.1%,1999年36°N 以南相对资源密度明显较小,并在34°N形成分布南限。2005年其分布重新扩散至整个黄海中南部,出现率为77.3%,相对资源密度多在5—20 kg/h,分布相对均匀。2010年主要分布在50 m以深的水域,且明显集中在石岛东南部(35.5—36.5°N,123.5 —124.5°E)和江苏南部外海(33.5—34.5°N,123—124°E)的两个区域,出现率为69.4%,南部分布较为均匀,相对资源密度基本在5—20 kg/h之间,北部几个站点相对资源密度较高,最高为70 kg/h,而50 m以浅的几个站点均未分布。如图1,1958—1959年细纹狮子鱼在黄海中南部相对资源密度较低,分布范围也较小,1985年和1993—1994年其相对资源密度最高,分布范围遍及黄海中南部,1999年相对资源密度有所下降,而近10年其相对资源密度有回升的趋势。
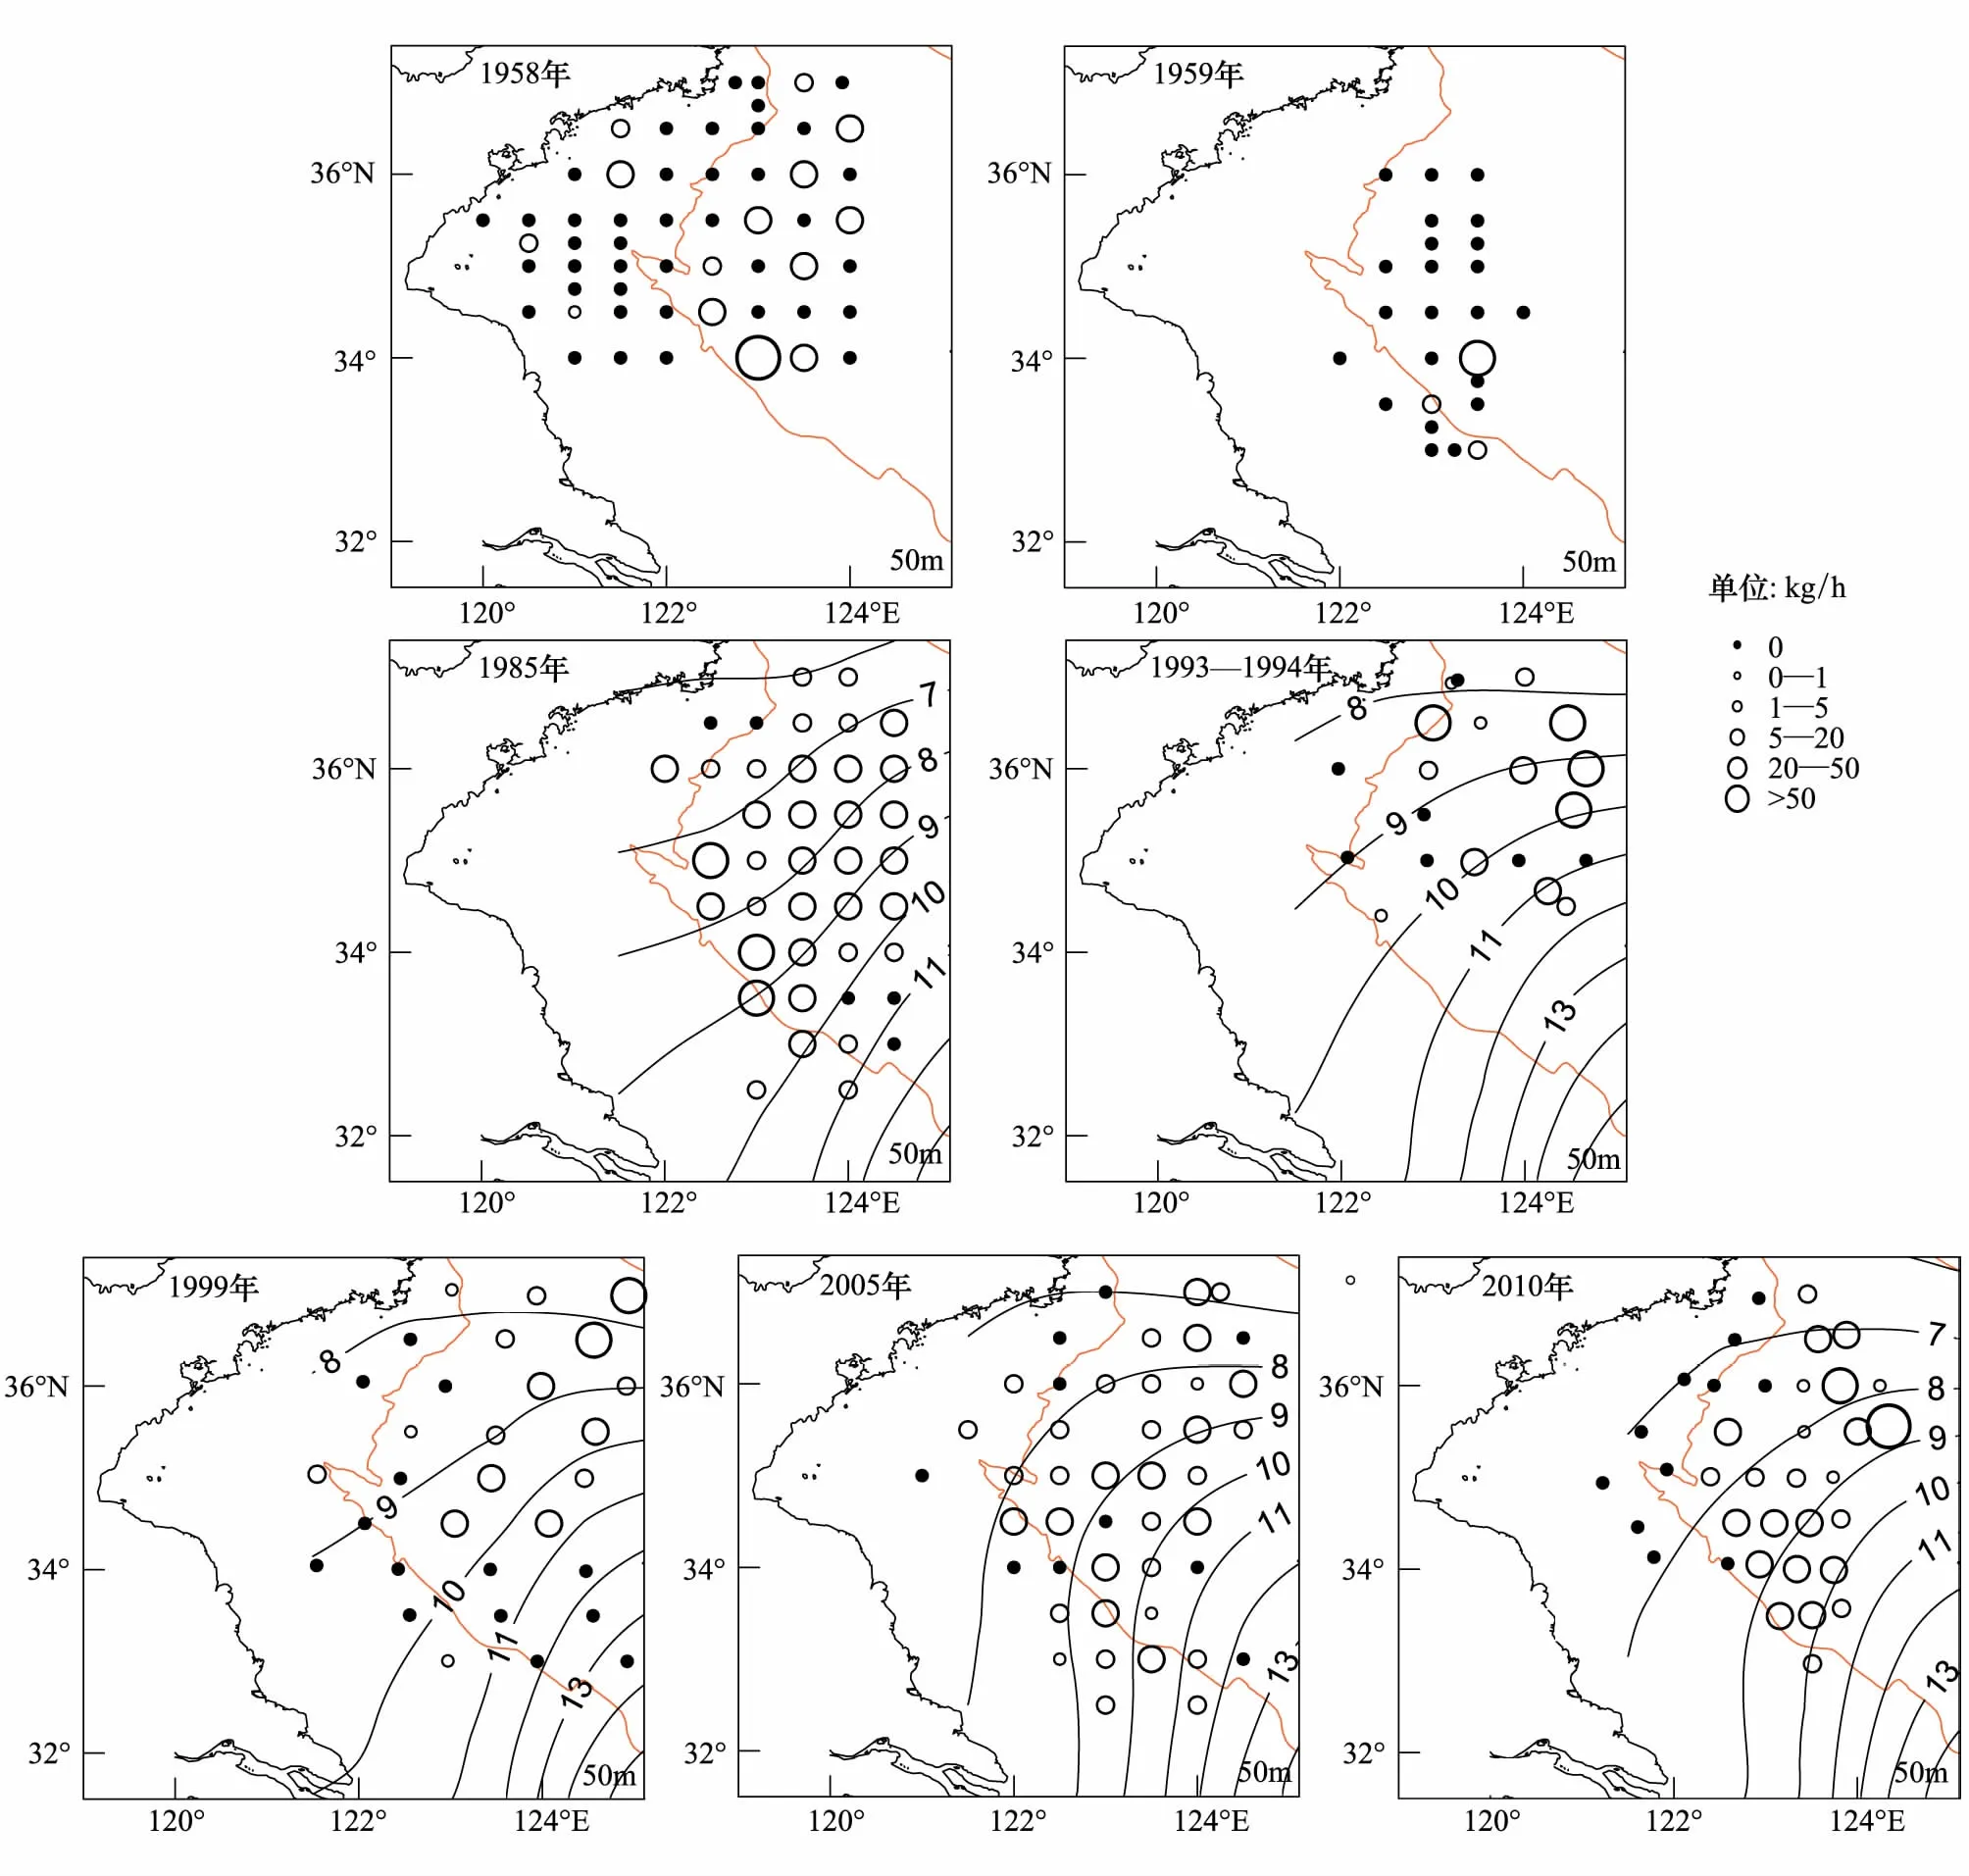
图1 黄海中南部细纹狮子鱼相对资源密度的空间分布Fig.1 Distribution of the relative stock density of L.tanakae in the central and southern Yellow Sea1958和1959年无相应温度资料
Table2InterannualvarianceinrelativestockdensityandoccurrencefrequencyofL.tanakaeinthecentralandsouthernYellowSea
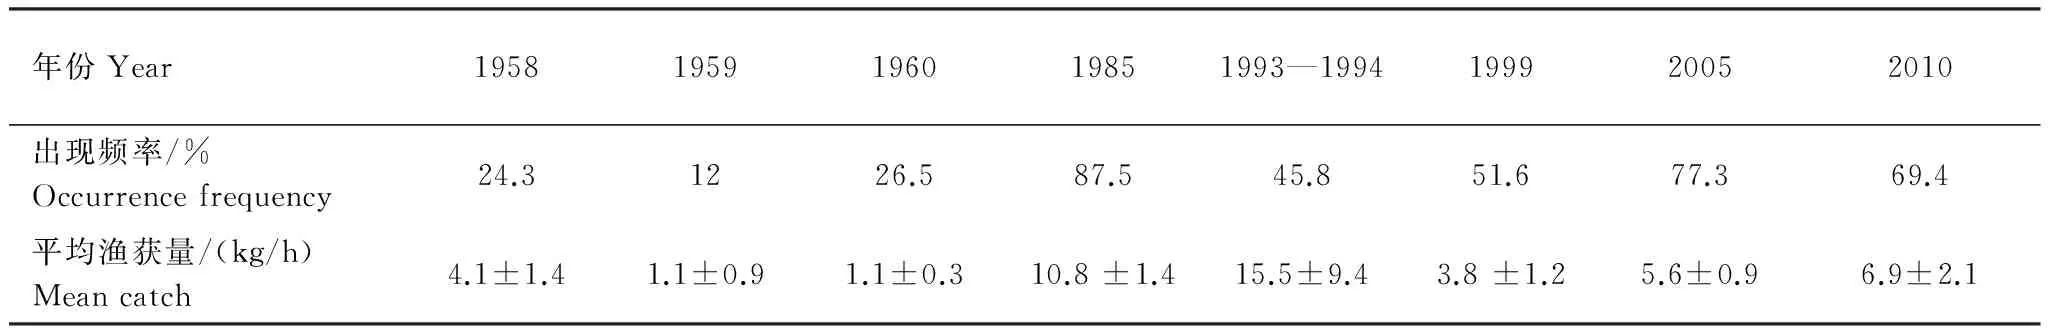
年份Year19581959196019851993—1994199920052010出现频率/%Occurrencefrequency24.31226.587.545.851.677.369.4平均渔获量/(kg/h)Meancatch4.1±1.41.1±0.91.1±0.310.8±1.415.5±9.43.8±1.25.6±0.96.9±2.1
海表温度和细纹狮子鱼相对资源密度以及出现频率的关系如图2。比较近10年海表温度与细纹狮子鱼相对资源密度发现,两者存在极显著的负相关关系(Plt;0.01,r=-0.81):当温度升高时,细纹狮子鱼的相对资源密度下降,如2005—2006年间,平均水温升高0.73℃,相对资源密度由5.6 kg/h下降至1.9 kg/h。当温度下降时,相对资源密度往往有上升的趋势,如2000—2002年水温下降了0.86℃,相应的相对资源密度上升了2.45 kg/h,而2004—2005年的数据相应为1.06℃,3.14 kg/h。水温较低的年份如2005和2010年细纹狮子鱼出现率均很高,其分布遍及整个黄海中部。海表温度和细纹狮子鱼的出现频率呈负相关关系,但不显著(P=0.051,r=-0.60)。
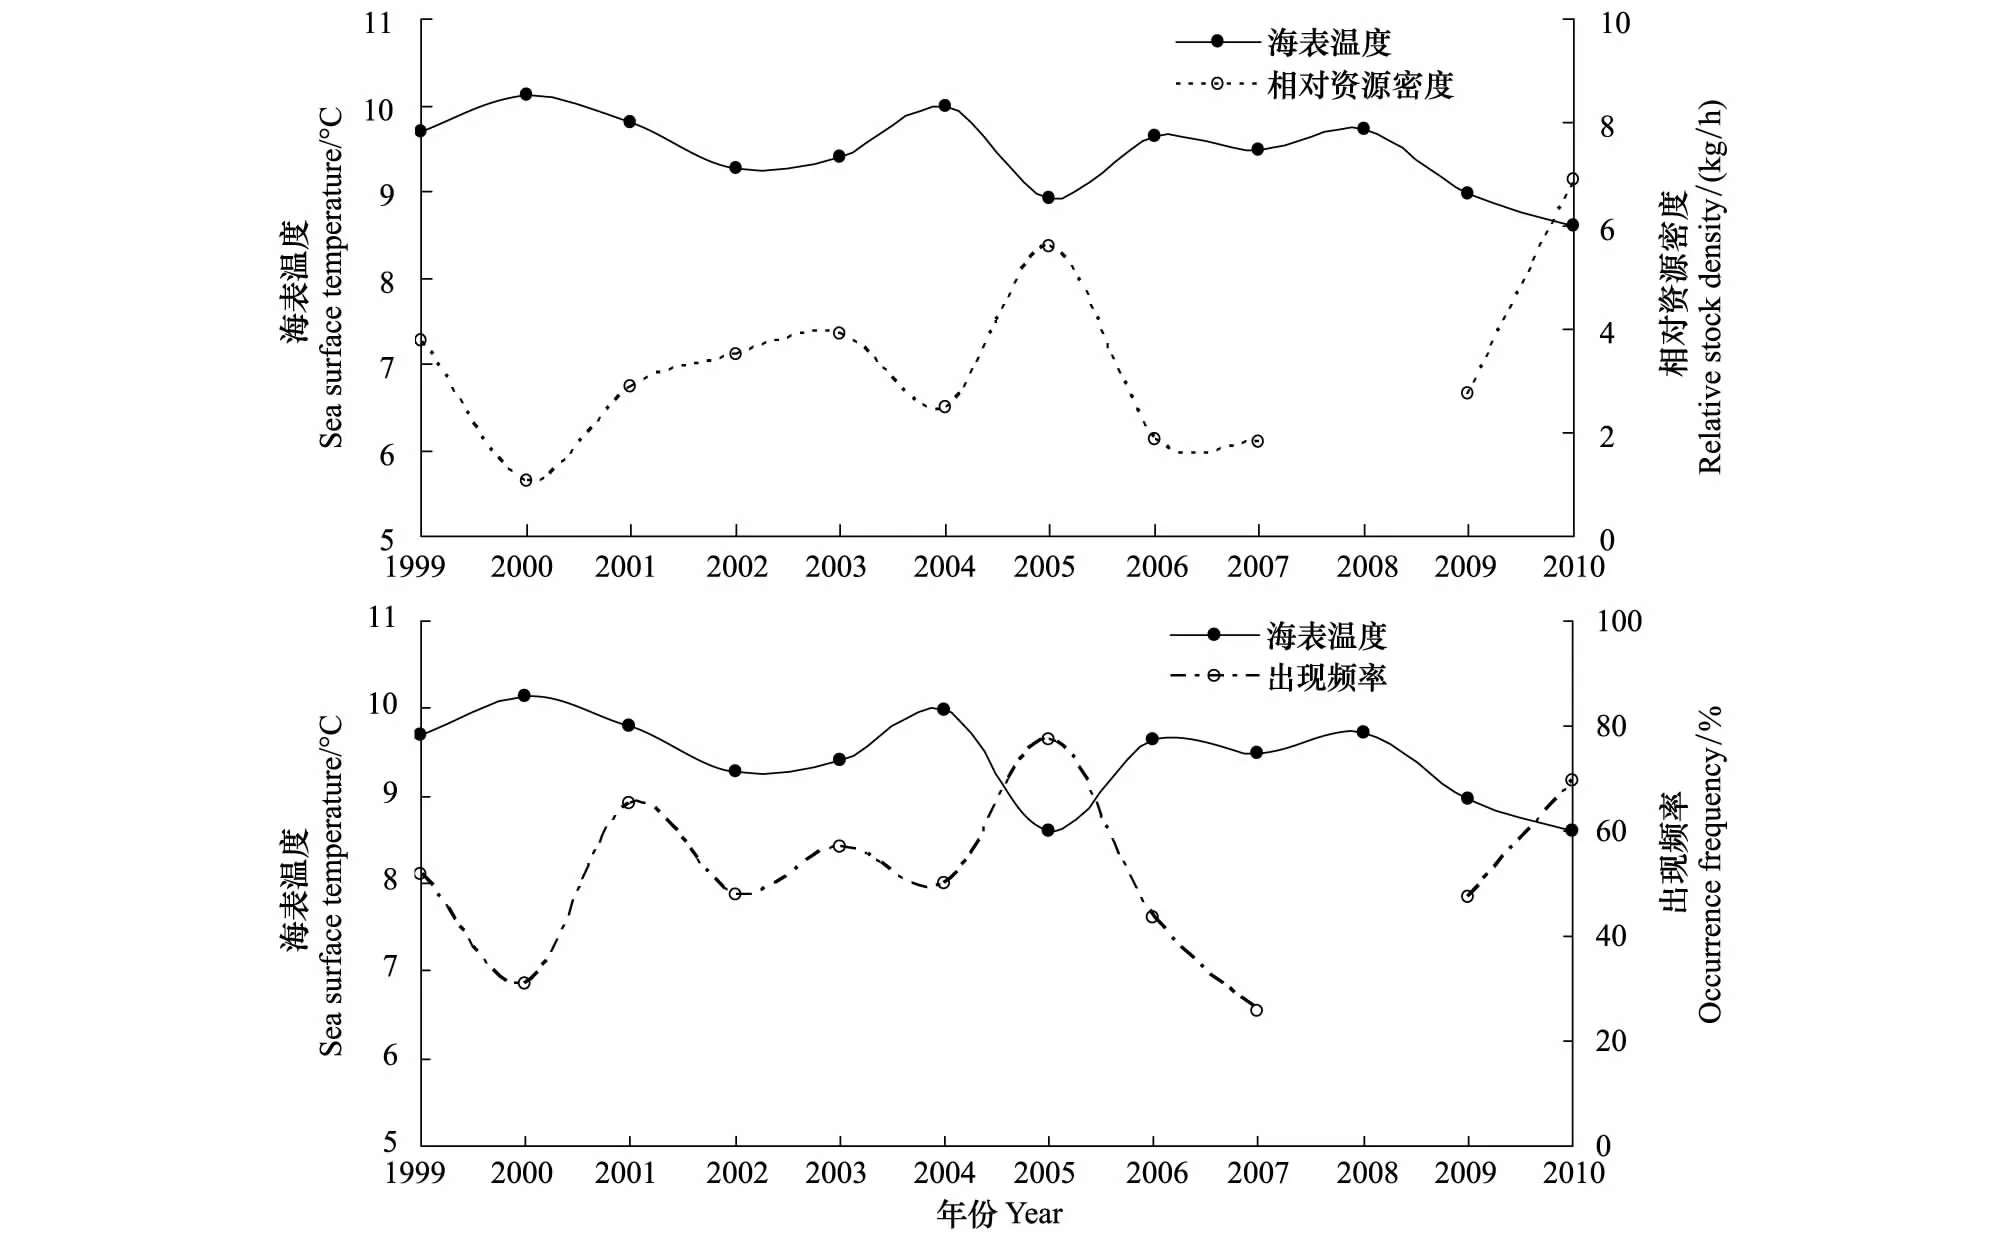
图2 细纹狮子鱼相对资源密度和出现频率与海表温度的关系Fig.2 The relative stock density and occurrence frequency of L.tanakae and their relationship with sea surface temperature
2.2 体长分布和体长体重关系
细纹狮子鱼各年份的体长频次如图3所示。1985年其平均体长为35.1 cm,优势体长范围30—42 cm,占69.9%,雌性平均体长为34.6 cm,雄性为34.9 cm;1999—2001细纹狮子鱼的平均体长为33.9 cm,优势体长范围30—34 cm和36—44 cm,分别占24.3%和37.1%,雌性和雄性平均体长分别为35.7 cm和38.1 cm;2005年平均体长为33.8 cm,优势体长范围30—38 cm,约占58.5%,雌性和雄性的平均体长为32.3 cm和35.6 cm;2010年平均体长为32.3 cm,优势体长范围26—38 cm,占78.8%,其中雌性平均体长为30.9 cm,雄性为33.6 cm;4个年代的总体平均体长和优势体长呈下降趋势。
年际间的t检验显示,2010年平均体长显著小于其他年份(Plt;0.05),2005年平均体长显著小于1985年(Plt;0.05),其余年份间均无显著差异。另外除1985年雌雄间平均体长无差异(Pgt;0.05),其余年份雄性平均体长极显著大于雌性(Plt;0.01)。
各年代体长体重关系见表3,协方差检验显示1985年和2005年的雌雄个体参数b值差异不显著(Pgt;0.05),故将其雌雄合并,而2000—2001年和2010年的雌雄间b值差异显著(Plt;0.05)。b值年际间变化显示,1985年和剩余年份差异显著(Plt;0.05),其他3个年份之间无显著差异(Pgt;0.05)。t检验显示,1985年、2005年以及2010年的雄性个体的b值显著小于3,群体呈负异速生长;其余b值均与3无显著差异,为等速生长。
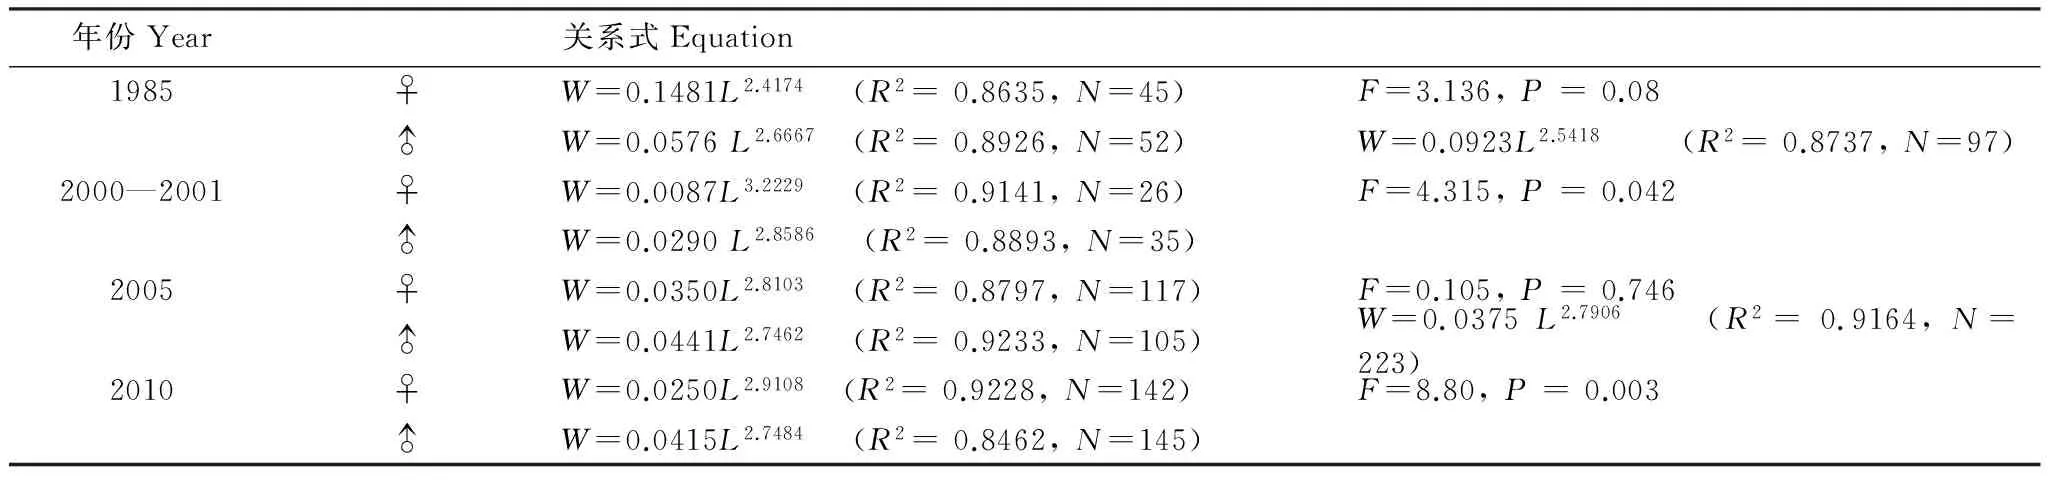
表3 黄海细纹狮子鱼体长-体重关系式中各参数
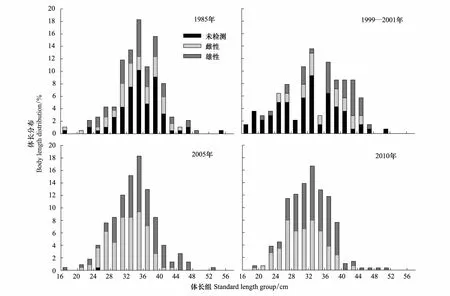
图3 黄海细纹狮子鱼的体长频次分布Fig.3 Body length distribution of L. tanakae in the Yellow Sea
2.3 性比及性腺成熟度
1985—2010年冬季4个年份的雌雄性比虽稍有变化,但均与1∶1无显著差异(表4)。各体长组间差异较为明显,小于20 cm的个体中,1985年和2010年均为雌性,2005和2000—2001年均为雄性。20—30 cm体长组中,2000—2001年和1985年性比1∶1无显著差异。而2005年雄性居多(Plt;0.05),2010年雌性居多(Plt;0.01)。30—40 cm体长组雌雄个体性比与1∶1无显著差异。40—50 cm体长组中,各个年份个数雄性居多,其中2005年差异极显著(Plt;0.01),而大于50 cm的渔获物中仅存在雄性个体。
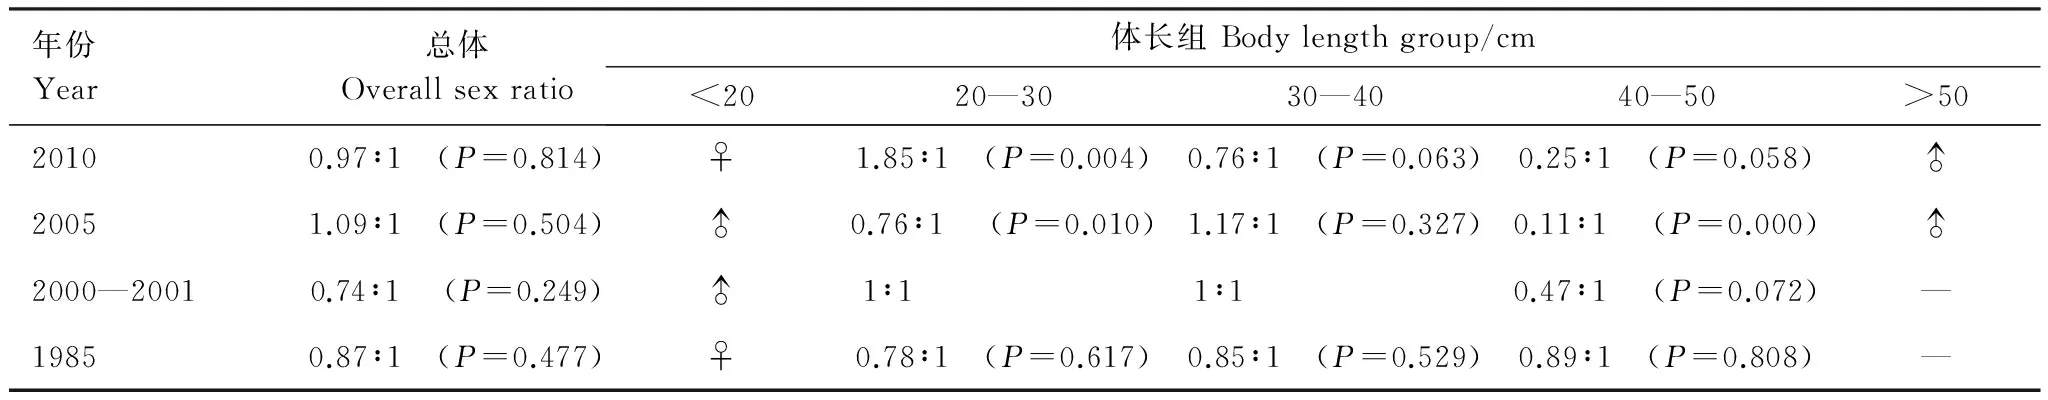
表4 细纹狮子鱼体长组性比的年际变化
性腺成熟度各期百分比如图4所示,1985年Ⅱ期占据比例较高,为42.2%,为所有调查年份最高,而其余年份Ⅱ期所占比例均小于10%。Ⅲ期所占比例随时间的变化逐渐增加,1985年仅占6.7%,而2010年冬季高达71.8%。性成熟个体(Ⅳ和Ⅴ期)所占比例呈现出下降趋势,1985年为51.1%,2000—2001年略有上升变为53.8%,2005年为41.8%,2010年最低,仅为23.9%。
2.4 肥满度的变化
细纹狮子鱼的肥满度为1.81—1.99,雌性肥满度为1.82—1.96(图5),而雄性为1.78—1.83。t检验显示,各年份雌雄肥满度无显著差异,而2000—2001年的总体肥满度显著高于2005年和2010年,其他年份之间均无显著差异。
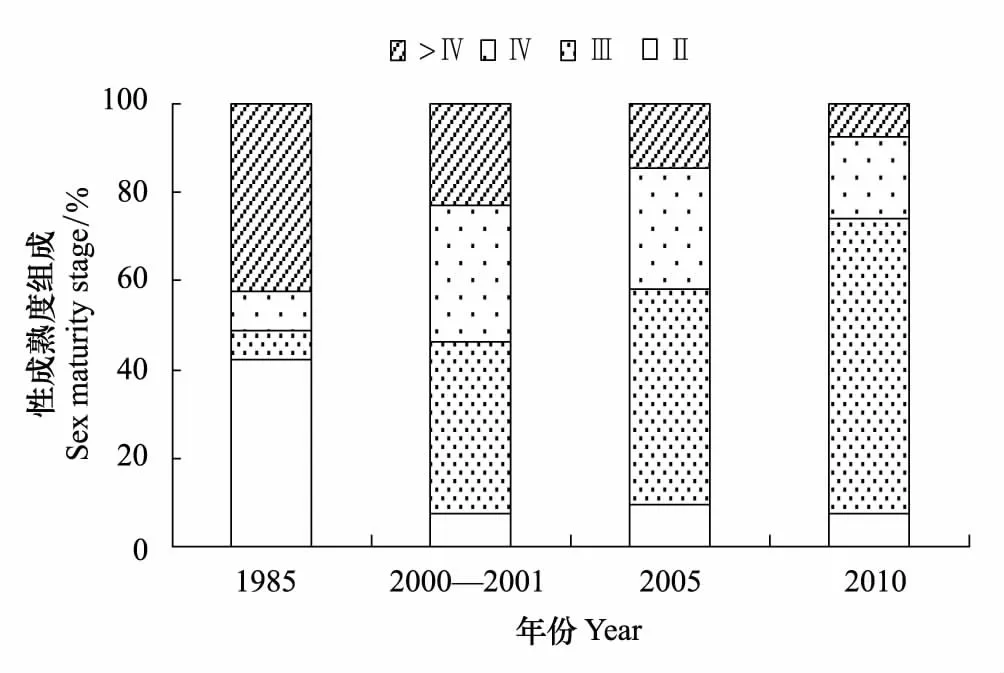
图4 黄海中南部细纹狮子鱼雌性性腺成熟度(Ⅱ—Ⅵ期)各期百分比组成Fig.4 Percentage of sex maturity stage (Ⅱ—Ⅵ) of female L. tanakae in the central and southern Yellow Sea
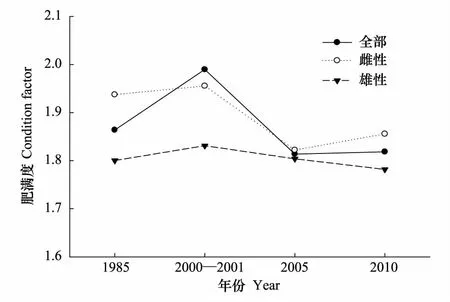
图5 黄海中南部细纹狮子鱼的肥满度变化 Fig.5 Variations in condition factor of L. tanakae in the central and southern Yellow Sea
3 讨论
3.1 细纹狮子鱼生物学特征的变化
赵紫晶[5]曾报道1—2月黄海细纹狮子鱼的产卵群体平均体长40 cm,优势体长33—36 cm和44—45 cm,略高于1985年的数据,这可能是与该鱼生长快速,体长跨度大有关。本研究中,1985年到2010年平均体长和优势体长持续减小。过度捕捞常常被认为是影响鱼类生物学特征的主要因素[21- 22],由于细纹狮子鱼的资源量相对较高,其他资源种类的衰退迫使渔业对象发生转变,且水产品深加工的发展也提升了该鱼的利用率,其近年承受的捕捞压力增大,使得体长特征开始发生变化,大个体比例显著减小。在摄食习性上,细纹狮子鱼的优势饵料生物也出现了明显的更替[13, 15],张波等[14]发现由于鳀鱼在渔业资源的比例逐渐降低,细纹狮子鱼的饵料中鳀鱼比例逐渐减小,而脊腹褐虾的比例逐渐升高。鱼类的生长与饵料的大小有很大的关系,根据“最佳摄食理论”[23],鱼类生长过程中总是倾向于捕食大个体的饵料生物,最大限度地获得能量,以补偿捕食所消耗的能量。这种食性的变化可能导致细纹狮子鱼捕食耗能增加,而用于生长的能量下降,从而导致生物学特征变化。
繁殖时期,细纹狮子鱼所摄能量多用于性腺发育,这个时期的体长生长速度降低,所以异速增长因子b小于3或与3无差异。肥满度在性成熟时一般较大,可以用来确定产卵期。2000—2001年冬季的肥满度高于其他年份,与2005年和2010年冬季差异显著,且性成熟比例同时也较高,说明该年的繁殖期可能早于其他年份。不同体长组的性比变化可能与雌雄异形有关,本研究中1985年各体长组差异较小,起性比均与1∶1无显著差异。而其他年份,体长大于40 cm组的个体偏向于雄性,这种体长组性比的雌雄差异在鮟鱇鱼类中也有存在[24]。性成熟个体所占总个体数比例呈现下降的趋势,由1985年的51.1%降至2010年的23.9%,一方面可能与过度捕捞导致大个体数量减少有关,本文四个年代的总体平均体长和优势体长均呈下降趋势;另一方面,严重的过度捕捞使得一些鱼类存在产卵期延长的繁殖策略,如带鱼[25],而目前针对细纹狮子鱼繁殖的研究较少,其是否也存在这样的繁殖策略值得进一步研究。
3.2 细纹狮子鱼的资源变动
20世纪50年代,由于渔业捕捞力量不足,黄海的其他大型底层鱼类在渔业资源中比例较高。细纹狮子鱼与很多底层种类存在食物竞争和空间竞争,如张波等[26]发现细纹狮子鱼与小黄鱼、高眼鲽、大头鳕、华鳐、鮟鱇、带鱼和龙头鱼等鱼类存在一定的食物竞争。而于振海等[27]发现细纹狮子鱼与星康吉鳗的时空生态位重叠值最大,这可能使得细纹狮子鱼在20世纪50年代的生态位空间竞争激烈,分布范围受到限制,导致其相对资源量处于较低水平,分布范围较小。
本研究1985年细纹狮子鱼出现率为87.5%,为各个年份最高。这可能是由于渔业资源和海水温度的共同变化造成的。一方面,20世纪80年代初,随着黄渤海底层渔业资源的衰退,黄海食物网上层出现生态空缺,细纹狮子鱼种间竞争压力减小,而其食性广,生长速度快的特性使其能够迅速填补生态位的空缺。根据黄海中北部鲱鱼试捕调查[5],1975年细纹狮子鱼出现率为25.8%,1976年升至80.76%,1977—1980出现率在33.33%—55.5%,而1981—1983年出现率高达94.7%—100%。80年代后期,在大型底层鱼类锐减的同时,小型中上层鱼类成为黄海的优势种类[28],特别是鳀鱼为细纹狮子鱼种群的增长提供了较好饵料基础。另一方面,相对资源密度与海表温度具有极显著的负相关关系(Plt;0.01,r=-0.81),出现频率和海表温度呈负相关关系(P=0.051,r=-0.60),1985年黄海中南部冬季平均温度(来源于哥伦比亚大学海洋环境数据库)远低于文中其他年份的海表温度(图2),为细纹狮子鱼这样的冷水性鱼类的出现创造了良好的水温条件。
水温对鱼类的分布有直接的影响。Henderson等[29- 30]在布里斯托尔湾发现水温和狮子鱼(L.liparis)丰度的长期变化具有一定相关性;Ishida等[31]研究发现当阿拉斯加湾北部海表温度较低时,大麻哈鱼(Oncorhynchusketa)和红大麻哈鱼(Oncorhynchusnerka)在白令海的产量和分布范围减少,反之,其在白令海丰度较高,分布较广;Poulard和Blanchard[32]发现温度上升使得比斯开湾亚热带种类分布比例上升,而温带种类的产量稳步下降,一些鱼类的分布南限北移;在我国,温度的上升使得黄海冷水团位置北移,使小黄鱼的分布向北偏移[33- 34]。本研究中,1993—1994年和1999年相比1985年和1958—1959年,细纹狮子鱼的分布区域发生北移。在调查区域内,细纹狮子鱼冬季主要分布范围为7—11℃(图1),冬季影响黄海的水系主要是黄海暖流水和沿岸水,图1中可以看到黄海暖流1993—1994年和1999年相比1985年强度要高,影响的范围更大,相应的7—11℃区域也更偏北,这可能是导致细纹狮子鱼这一冷水性鱼类分布北移的原因。此外,1985年和2010年冬季的平均海表温度相近,处于较低水平,而相对资源密度之差高达3.9 kg/h,说明细纹狮子鱼还受到其他因素的影响,低选择性的捕捞可能是原因之一。
[1] 山田梅芳, 時村宗春, 堀川博史, 中坊徹次. 東シナ海·黄海の魚類誌. 東京: 東海大学出版会, 2007: 525- 529.
[2] Chernova N V, Stein D L, Andriashev A P. Family Liparidae Scopoli 1777-snailfishes. California Academy of Sciences, Annotated Checklists of Fishes, 2004, 31: 1- 72.
[3] Zhao C Y. Marine Fishery Resources of China. Hangzhou: Zhejiang Scientific and Technical Press, 1990: 70- 71.
[4] Liu C X, Qin K J. Fauna of Liaoning(Fishes). Shenyang: Liaoning Science and Technology Press, 1987: 409- 414.
[5] Liu X S. Investigation and Division of the Yellow Sea and Bohai Sea Fishery Resources. Beijing: Ocean Press, 1990: 251- 252.
[6] Jin X S, Cheng J S, Qiu S Y, Li P J, Cui Y, Dong Q. Integrated Research and Evaluation on Fisheries Resources in the Yellow Sea and Bohai Sea. Beijing: Ocean Press, 2006: 94- 98.
[7] Wei S, Jiang W M. Study on food web of fishes in the Yellow Sea. Oceanologia et Limnologia Sinica, 1992, 23(2): 182- 192.
[8] Zhang B, Tang Q S, Jin X S. Functional groups of communities and their major species at high trophic level in the Yellow Sea ecosystem. Acta Ecologica Sinica, 2009, 29(3): 1099- 1111.
[9] Scheffer M, Carpenter S, Young B. Cascading effects of overfishing marine systems. Trends in Ecology and Evolution, 2005, 20(11): 579- 581.
[10] Zhou Z P, Jin X S, Shan X J, Li Z L, Dai F Q. Seasonal variations in distribution and biological characteristics of snailfishLiparistanakaein the central and southern Yellow Sea. Acta Ecologica Sinica, 2012, 32(17): 5550- 5561.
[11] 小坂昌也. 仙台湾産クサウオLiparistanakai(Gilbert et Burke)の生態的地位について. 東海大学紀要海洋学部, 1971, (5): 27- 41.
[12] Kawasaki T, Hashimoto H, Honda H, Otake A. Selection of life histories and its adaptive significance in a snailfishLiparistanakaifrom Sendai Bay. Nippon Suisan Gakkaishi, 1983, 49(3): 367- 377.
[13] Xue Y, Xu B D, Gao T X, Qiu T L, Lin L S. Preliminary study on feeding ecology ofLiparistanakaein North Yellow Sea. Journal of Fishery Sciences of China, 2010, 17(5): 1066- 1074.
[14] Jin X S, Zhang B, Xue Y. The response of the diets of four carnivorous fishes to variations in the Yellow Sea ecosystem. Deep Sea Research Part II: Topical Studies in Oceanography, 2010, 57(11/12): 996- 1000.
[15] Zhang B, Jin X S, Dai F Q. Feeding habits and their variation of seasnail (Liparistanakae) in the Central and Southern Yellow Sea. Journal of Fisheries of China, 2011, 35(8): 1199- 1207.
[16] Li L, Xu Z, Zhang L P. A new species of genusHysterothylaciumWard et Magath, 1917 (Nematoda, Anisakidae) fromLiparistanakae(Scorpaeniformes, Liparidae) from the Yellow Sea, China. Acta Parasitologica, 2007, 52(4): 371- 375.
[17] Li Z L, Jin X S, Shan X J, Dai F Q. Inter-annual changes on body weight-length relationship and relative fatness of small yellow croaker (Larimichthyspolyactis). Journal of Fishery Sciences of China, 2011, 18(3): 602- 610.
[18] Jin X S, Zhao X Y, Meng T X, Cui Y. Living Resources and Environment in the Yellow Sea and Bohai Sea. Beijing: Science Press, 2005: 1- 20.
[19] Zhan B Y. Fisheries Stock Assessment. Beijing: China Agriculture Press, 1995: 20- 21.
[20] Yellow Sea Fishery Research Institute. Investigation Handbook of Marine Fisheries Resources Survey. 2nd ed. Shanghai: Shanghai Scientific and Technical Press, 1981: 38- 39.
[21] Zhang G Z, Li X S, Jin X S, Zhu J C, Dai F Q. Changes of biological characteristics of small yellow croaker (Larimichthyspolyactis) in the Central and Southern Yellow Sea. Acta Ecologica Sinica, 2010, 30(24): 6854- 6861.
[22] Hsieh C, Yamauchi A, Nakazawa T, Wang W F. Fishing effects on age and spatial structures undermine population stability of fishes. Aquatic Sciences, 2010, 72(2): 165- 178.
[23] Gerking S D. Feeding Ecology of Fish. San Diego: Academic Press, 1994: 1- 244.
[24] Zhang X J, Cheng J H, Shen W, Liu Z L. Feeding ecology ofLophiuslitulonin the South of Yellow Sea. Acta Ecologica Sinica, 2010, 30(12): 3117- 3125.
[25] Mi C D. A study on resources, stock structure and variation of reproductive habit of haritail,Trichiurushaumelain East China Sea. Journal of Fishery Sciences of China, 1997, 4(1): 7- 14.
[26] Zhang B, Tang Q S, Jin X S, Xue Y. Feeding competition of the major fish in the East China Sea and the Yellow Sea. Acta Zoologica Sinica, 2005, 51(4): 616- 623.
[27] Yu Z H, Jin X S, Li X S. Analysis of ecological niche for major fish species in the Central and Southern Yellow Sea. Progress in Fishery Sciences, 2010, 31(6): 1- 8.
[28] Jin X S, Tang Q S. Changes in fish species diversity and dominant species composition in the Yellow Sea. Fisheries Research, 1996, 26(3/4): 337- 352.
[29] Henderson P A, Holmes R H A. Population stability over a ten year period in the short lived fishLiparisliparis. Journal of Fish Biology, 1990, 37(4): 605- 615.
[30] Henderson P A, Seaby R M. Population stability of the sea snail at the southern edge of its range. Journal of Fish Biology, 1999, 54(6): 1161- 1176.
[31] Ishida Y, Azumaya T, Fukuwaka M, Davis N. Interannual variability in stock abundance and body size of Pacific salmon in the central Bering Sea. Progress in Oceanography, 2002, 55(1/2): 223- 234.
[32] Poulard J C, Blanchard F. The impact of climate change on the fish community structure of the eastern continental shelf of the Bay of Biscay. ICES Journal of Marine Science, 2005, 62(7): 1436- 1443.
[33] Shan X J, Li Z L, Dai F Q, Jin X S. Seasonal and annual variations in biological characteristics of small yellow croakerLarimichthyspolyactisin the Central and Southern Yellow Sea. Progress in Fishery Sciences, 2011, 32(6): 7- 16.
[34] Lin L S, Cheng J H, Jiang Y Z, Yuan X W, Li J S, Gao T X. Spatial distribution and environmental characteristics of the spawning grounds of small yellow croaker in the Southern Yellow Sea and the East China Sea. Acta Ecologica Sinica, 2008, 28(8): 3485- 3494.
参考文献:
[3] 赵传絪. 中国海洋渔业资源. 杭州: 浙江科学技术出版社, 1990: 70- 71.
[4] 刘蝉馨, 秦克静. 辽宁动物志(鱼类). 沈阳: 辽宁科学技术出版社, 1987: 409- 414.
结果显示,铁皮石斛匀浆液对三种病原微生物具有不同程度的抑制效果,其中对大肠杆菌的抑制效果最强,对绿色链球菌的抑制效果最弱。最小抑菌浓度的测定结果显示,铁皮石斛匀浆液对金黄色葡萄球菌、大肠杆菌和绿色链球菌的最小抑菌浓度分别是5%、2.5%和10%,其结果与纸圆片抑菌实验的测定结果一致。这表明服用铁皮石斛确实有抑制部分病原微生物、强化免疫力的作用,尤其对维持肠道健康有益。
[5] 刘效舜. 黄渤海区渔业资源调查和区划. 北京: 海洋出版社, 1990: 251- 252.
[6] 金显仕, 程济生, 邱盛尧, 李培军, 崔毅, 董婧. 黄渤海渔业资源综合研究与评价. 北京: 海洋出版社, 2006: 94- 98.
[7] 韦晟, 姜卫民. 黄海鱼类食物网的研究. 海洋与湖沼, 1992, 23(2): 182- 192.
[8] 张波, 唐启升, 金显仕. 黄海生态系统高营养层次生物群落功能群及其主要种类. 生态学报, 2009, 29(3): 1099- 1111.
[10] 周志鹏, 金显仕, 单秀娟, 李忠炉, 戴芳群. 黄海中南部细纹狮子鱼的生物学特征及资源分布的季节变化. 生态学报, 2012, 32(17): 5550- 5561.
[13] 薛莹, 徐宾铎, 高天翔, 邱天龙, 林龙山. 北黄海细纹狮子鱼摄食生态的初步研究. 中国水产科学, 2010, 17(5): 1066- 1074.
[15] 张波, 金显仕, 戴芳群. 黄海中南部细纹狮子鱼的摄食习性及其变化. 水产学报, 2011, 35(8): 1199- 1207.
[17] 李忠炉, 金显仕, 单秀娟, 戴芳群. 小黄鱼体长- 体质量关系和肥满度的年际变化. 中国水产科学, 2011, 18(3): 602- 610.
[18] 金显仕, 赵宪勇, 孟田湘, 崔毅. 黄、渤海生物资源与栖息环境. 北京: 科学出版社, 2005: 1- 20.
[19] 詹秉义. 渔业资源评估. 北京: 中国农业出版社, 1995: 20- 21.
[20] 黄海水产研究所. 海洋水产资源调查手册 (第二版). 上海: 上海科学技术出版社, 1981: 38- 39.
[21] 张国政, 李显森, 金显仕, 朱建成, 戴芳群. 黄海中南部小黄鱼生物学特征的变化. 生态学报, 2010, 30(24): 6854- 6861.
[24] 张学健, 程家骅, 沈伟, 刘尊雷. 黄海南部黄鮟鱇摄食生态. 生态学报, 2010, 30(12): 3117- 3125.
[25] 宓崇道. 东海带鱼资源状况、群体结构及繁殖特性变化的研究. 中国水产科学, 1997, 4(1): 7- 14.
[26] 张波, 唐启升, 金显仕, 薛莹. 东海和黄海主要鱼类的食物竞争. 动物学报, 2006, 51(4): 616- 623.
[27] 于振海, 金显仕, 李显森. 黄海中南部主要鱼种的生态位分析. 渔业科学进展, 2011, 31(6): 1- 8.
[33] 单秀娟, 李忠炉, 戴芳群, 金显仕. 黄海中南部小黄鱼种群生物学特征的季节变化和年际变化. 渔业科学进展, 2012, 32(6): 7- 16.
[34] 林龙山, 程家骅, 姜亚洲, 袁兴伟, 李建生, 高天翔. 黄海南部和东海小黄鱼 (Larimichthyspolyactis) 产卵场分布及其环境特征. 生态学报, 2008, 28(8): 3485- 3494.
InterannualvariationinthepopulationdynamicsofsnailfishLiparistanakaeintheYellowSea
CHEN Yunlong1, 2, SHAN Xiujuan2, ZHOU Zhipeng2, DAI Fangqun2, LI Zhonglu3, JIN Xianshi2,*
1CollegeofFisheries,OceanUniversityofChina,Qingdao266003,China2KeyLaboratoryforFisheryResourcesandEco-environment,ShandongProvince,YellowSeaFisheriesResearchInstitute,ChineseAcademyofFisherySciences,Qingdao266071,China3FacultyofFisheries,GuangdongOceanUniversity,Zhanjiang524088,China
The snailfish,Liparistanakae, is a cold-water, demersal fish that has become one of the top predators in the Yellow Sea ecosystem because of a decline in the abundance of the commercially targeted species in recent years. We evaluated the interannual variation in relative stock density, distribution, biological and reproductive characteristics of snailfish based on fishery data collected by bottom trawl during winter (1958—2010) in the Yellow Sea. In the northern Yellow Sea, the snailfish was primarily distributed around the Liaodong Peninsula near the 50 m isotherm. In other regions of the Yellow Sea, the species was primarily distributed in the central Yellow Sea in 1959, but had expanded its distribution by 1985. Relative to surveys in 1958—1959 and 1985, the distribution of snailfish moved northward by the 1990s from 34°N to 36°N. In 2005, the species was found in all areas of the Yellow sea and in 2010, it was primarily distributed southeast of Shidao (35.5—36.5°N,123.5 —124.5°E) and off southern Jiangsu province. The relative stock density of snailfish was low in the late 1950s (1.1—4.1 kg/h), then increased in the 1980s and 1990s, peaking at 15.5 kg/h in 1993—1994. The density then decreased to 3.8 kg/h in the late 1990s and has recovered only slightly in the last 10 years. We observed a similar trend in occurrence frequency. In the late 1950s, snailfish only accounted for 12.0%—26.5% of the occurrence frequency. However, it peaked at 87.5% in the 1980s. In other years, the occurrence frequency was relatively large (45.8%—77.3%), though most notably in the “cold” years such as 1985, 2005 and 2010. We observed a significant negative correlation between relative stock density and sea surface temperature in the ten most recent years suggesting that this cold-water species responded rapidly to the changing temperature. Similarly, we observed a negative but insignificant correlation between the occurrence frequency and sea surface temperature. The average body length of snailfish was 35.1 cm in 1985, 33.9 cm in 1999—2001, 33.8 cm in 2005 and 32.3 cm in 2010, suggesting a tendency towards miniaturization. The average body length of male individuals was significantly larger than for female individuals in all survey years (except 1985). Thebvalue for males in 1985, 2005 and 2010 were significantly less than 3, consistent with intensely negative-allometric growth of the population whereas the remainingbvalues were not significantly different. We evaluated the sex ratios(♀:♂)within five length groups(lt;20, 20—30, 30—40, 40—50, gt;50 cm). There was no significant difference in the sex ratio during the survey years. However, the ratio did differ within body length groups. Within lt;20 cm group, all fish were female in 1985 and 2010 and male in 2000—2001 and 2005. In the 20—30 cm group, there was no difference in the ratio during four decades, although in 2005, the catch was dominated by female snailfish. In the 30—40 cm group, there was no difference in all survey years. In the 40—50 cm group, males dominated the catch in 2005 whereas the ratio was equal in all other years. Finally, the catch of gt;50 cm fish consisted exclusively of males in all survey years. In 1985, 2000—2001, 2005 and 2010, the proportion of sexually mature fish (at stage IV or beyond stage IV)were 51.1, 53.8, 41.8 and 23.9%, respectively, while for those at stage III the proportions were 6.7, 38.5, 48.7 and 71.8%, respectively. Changes in biological characteristics may be the result of overfishing. In addition, a shrift in feeding habits may also have played an important role as the dominant prey categories of snailfish have changed significantly. In summary, the lack of interspecific competition, rapid growth and varied diet likely explain the variation in abundance of snailfish in the Yellow Sea ecosystem.
Liparistanakae; biological characteristics; distribution; the Yellow Sea
国家国际科技合作专项项目(2013DFA31410); 气候变化重大基础研究项目(973- 2013CB956503); 公益性行业(农业)科研专项(200903005); 山东省泰山学者专项基金共同资助
2013- 04- 17;
2013- 07- 15
*通讯作者Corresponding author.E-mail: jin@ysfri.ac.cn
10.5846/stxb201304170731
陈云龙,单秀娟,周志鹏,戴芳群,李忠炉,金显仕.黄海细纹狮子鱼种群特征的年际变化.生态学报,2013,33(19):6227- 6235.
Chen Y L, Shan X J, Zhou Z P, Dai F Q, Li Z L, Jin X S.Interannual variation in the population dynamics of snailfishLiparistanakaein the Yellow Sea.Acta Ecologica Sinica,2013,33(19):6227- 6235.