SIMULATION OF BLEED AIR BEHAVIOR DURING AIRCRAFT IN FLIGHT BASED ON FLOWMASTER
2013-12-02ShiHong施红JiangYanlong蒋彦龙LiuZhili刘志丽KangNa康娜YuLei于磊LiuChao刘超DuYanping杜延平
ShiHong(施红),Jiang Yanlong(蒋彦龙),Liu Zhili(刘志丽) Kang Na(康娜),Yu Lei(于磊),Liu Chao(刘超),Du Yanping(杜延平)
(1.College of Aerospace Engineering,Nanjing University of Aeronautics and Astronautics,Nanjing,210016,P.R.China;2.Shanghai Aircraft Design & Research Institute,Commercial Aircraft Corporation of China,Ltd,Shanghai,200232,P.R.China)
INTRODUCTION
An important energy source in commercial aircrafts is the hot pressurized air that is bled from the engines,asist power unit(APU)and ground,and routed throughout the airframe to secondary systems responsible for various onboard purposes in a modern aircraft.Typically,a stream of hot air bled from the engines is used to provide an anti-icing function on the leading edge of the wings as well as empennage of the aircraft,and also used by the air conditioning units to supply fresh air to the cabin.Meanwhile,the hot pressurized air provides pressure for the potable water system,hydraulic system and engine starters[1-3].The bleed air presents with heat and pressure losses in the transporting process,and may not fulfill the requirements for the downstream system.Therefore,the thermal and flow characteristics of the bleed air system must be conducted in the initial stages of the design.A set of metallic ducts of the bleed system consist of curved and straight sections,joints, welded parts,and valves,etc.It is difficult to study the thermal and flow behaviors of the duct system.
Over the past years,one-dimensional internal flow in the pipeline has been studied by various researchers[4-8]including Ng and Tan[9], who studied the dynamic behavior of fuel during a refuel process by means of an internal flow analysis software program.Similar work was done by Tu Yi and Lin Guiping[10],who studied transport aircraft oxygen system,and a computer analysis model of oxygen system was established by FLOWMASTER software.The simulation results gave the oxygen consumption and the flow rate of each oxygen supply points.It is noted that all the efforts mentioned above reveal that the one-dimensional lumped parameter method is a simplified topological treatment to investigate the flow and heat transfer characteristics of the pneumatic duct system.
In this paper,in order to study the dynamic behavior of bleed air in the flight process,one-dimensional internal flow and heat transfer model is developed.The bleed air system is analyzed by representing physical components as flow resistances and control volumes.The steady state analysis is performed to identify whether the flow rate,temperature and pressure meet the requirements of the downstream components.
1 PNEUMATIC DUCT SYSTEM
The schematic of the pneumatic duct system is shown in Fig.1.During service operation,the pneumatic duct system of a commercial aircraft is subjected to thermodynamic and pressure cycles,accompanied with the pressure and thermal loss that may cause the shortage of bleeding mass flow for the anti-ice,air condition and so on.The complexity and diversity of accessories result in the difficulty of the analysis.Prior to the simulations,duct characteristics,components property and boundary condition are given firstly as follows.

Fig.1 Schematic of typical bleed air duct system
2 MODELING OF BLEED AIR SYSTEM
2.1 Computing method
The one-dimensional lumped parameter technology is used to model the pneumatic duct system.The duct system is divided into a set of calculation points,and the points connect into a net-work.Based on the principle of mass conservation and pressure residual correction method,the pipeline simulation can be in good numerical stability and convergence.
The internal flow of the bleed air flows in straight duct,bends and components such as heat exchanger and flow control valve.In this paper,the bleed air is considered to be compressible fluid flow.In the process of air routing,heat loss and pressure loss are obvious although there are the insulation layer out of the duct.Due to the high pressure inside the duct,the turbulent flow is developed.The governing equations of compressible fluid flow are shown as follows.
(1)Conservation of mass
For compressible flow,the mass-conservation equation for the calculate node is expressed as

where Qis the mass flow rate.The formula represents a state that mass flowing into a node must equal the mass flowing out.
(2)Conservation of energy
The energy equation for the fluid flow is known as the Bernoulli equation,shown as

where Eis the total energy perunitmass,gthe gravitational acceleration,z the elevation,pthe static pressure,ρthe density,vthe velocity.
(3)Pressure loss
The equation of pressure loss is shown as

where kis the loss coefficient based on the configuration of the duct and characteristics of the equipment.In this paper,in order to make computing process convenience,the formula of pressure loss is unified when the air is passing through the duct or resistance components.
(4)Heat transfer
The equation of heat transfer is shown as
ΔE=Δe1-Δe2-Δq+Δw
where ΔE is the accumulation term,Δe1the transport term in,Δe2the transport term out,Δq the energy loss(by radiation/conduction/convection),andΔwthe work done on the fluid to overcome pressure forces.
2.2 Design criterion
(1)Characteristics of duct
The duct is composed of CRES 321 (A312 TP321)steel tube.The density of the material is 7 900kg/m3,and heat conductivity is 50W/(m·K).Table 1gives characteristics of cross section.

Table 1Cross section characteristics of duct
The heat conductivity of the insulation layer is 0.04W/(m·K),and the heat transfer coefficient outside the insulation layer is 8W/(m2·K).
(2)Characteristics of component
As we all know,the bleed air from the engine maintains high temperature and pressure.Sometimes they could be much higher than the requirements of the anti-ice and air condition.After the engine,there are pressure regulator and shutoff valve (PRSOV)and pre-cooler (PCE),responsible for decreasing the pressure and temperature.In the pipeline there are also some flow control valves such as wing anti-ice valve(WAIV)for regulating the flow rate.The heat transfer and flow resistance of the components are shown in Table 2.

Table 2 Characteristics of pre-cooler
In Table 2,Qrepresents the flow rate,the pressure loss function is obtained from the experiments,andσis defined as follows

whereρis the density of the fluid,andρ0the reference density.
A common expression of pressure loss is given by

where Kis the loss coefficient,and Athe cross sectional area.
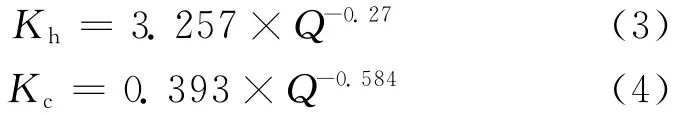
Thus the loss coefficients Khand Kcbecome
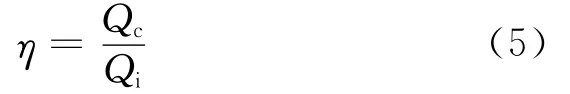
Exchanger efficiencyηis the ratio of the actual heat transfer Qcand the theoretical heat transfer Qi,that is
where Qcand Qican be expressed as
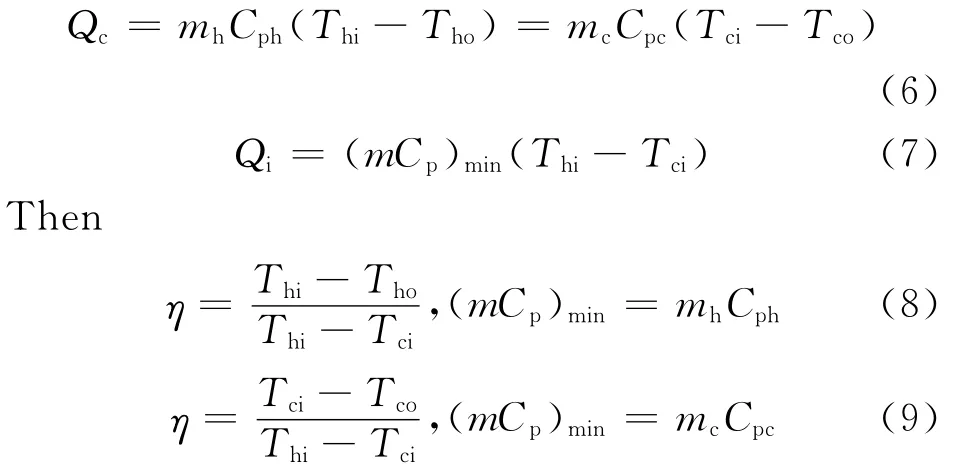
where mhand mcrepresent mass flow rates of the hotside and coldside of the heat exchanger,respectively,Thiand Thothe inlet and outlet temperature of the hotside,Tciand Tcothe inlet and outlet temperature of the coldside,Cphand Cpcthe heat capacity of the hotside and coldside at constant pressure.
Meanwhile,the exchanger efficiency is also a function of flow rate of the exchanger,and it can be achieved from the experiment.In this paper,we assume the efficiency characteristic follows the curve as shown in Fig.2.

Fig.2 Exchanger efficiency with flow rate
Combining Fig.2and Eqs.(8-9),the performance of the heat exchanger can be calculated.Flow resistance of PRSOV and WAIV follows the curve as shown in Fig.3.The fluid passing through a valve can be obtained.

Fig.3 Loss coefficient with valve open ratio
According to Fig.3,the pressure loss when the fluid passing through a valve can be obtained easily.
2.3 Boundary condition
When the bleed air passes through these components,the pressure and temperature loss will be developed.In order to investigate the flow and thermal behavior during the flight state,all situations that may appear should be checked in the design stage.In this paper,three typical cases are selected to investigate the flow distribution,temperature change and pressure drop for the purpose of illustrating the computing method.The boundary condition and design parameters are listed in Tables 3-4,and in Table 3,ECS is the environment control system.
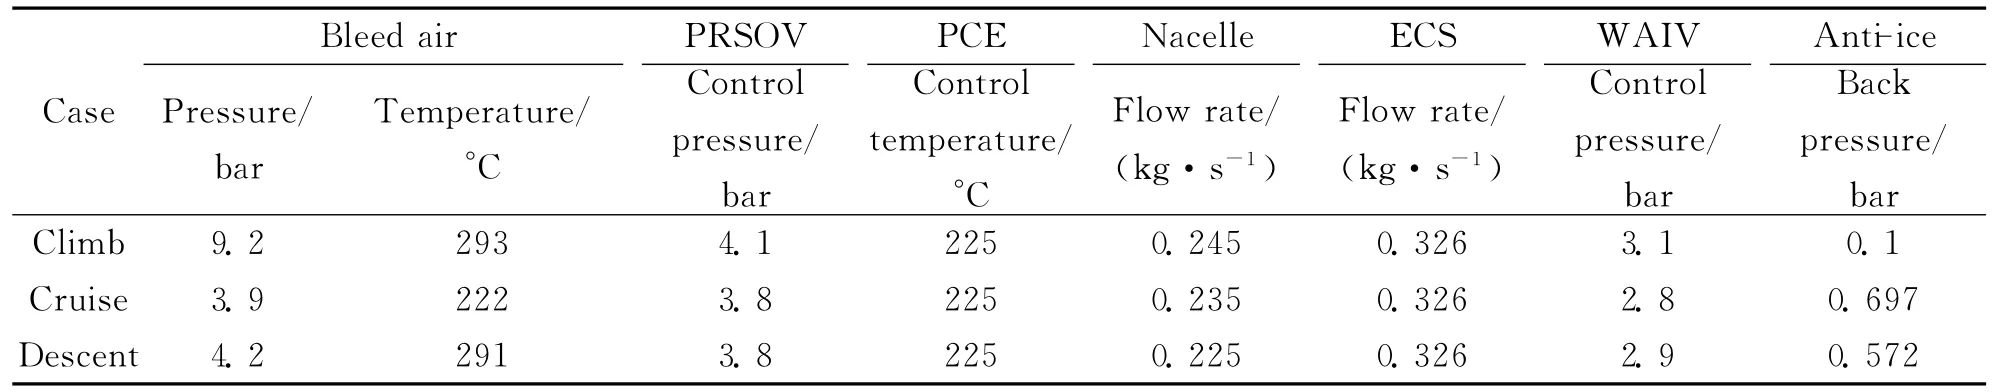
Table 3 Boundary condition

Table 4 Design criterion
It is deserved to be mentioned that the temperature loss is calculated from the node after precooler and before piccolo.
2.4 Computation model
The system is modeled by FLOWMASTER software which is a one-dimensional fluid flow and pressure analysis tool.The steady state calculations are conducted.Fig.4shows the flow direction in the duct system.
As shown in Fig.4,starting at the left of the figure,the source of the bleed air is bled from the engine.Due to the high pressure and high temperature of the bleed air which are much higher than the design requirements,PRSOV will regulate the bleed air into the design value.Following,PCE makes the temperature lower into 225°C.Then the air routes through the duct system,dividing to nacelle,ECS,and anti-ice system.PRSOV and WAIV are controlled by the pressure of the control point after the valve.
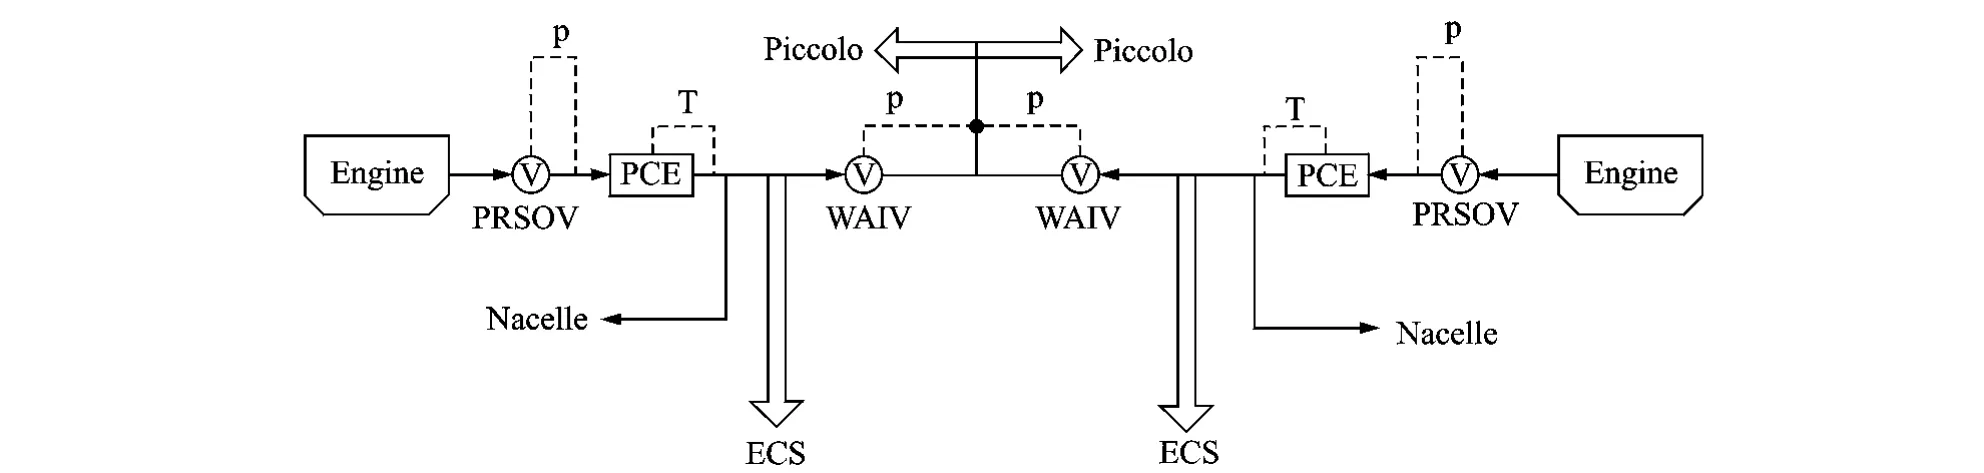
Fig.4 Flow direction in duct system
PID control logic is widely used in the simulation,responsible for flow control,pressure control and valve opening control.
As shown in Fig.5,the pre-cooler is a flow resistance,and the flow rate of the cold side is controlled by the PID control logic based on the temperature of specified node after the heat exchanger.
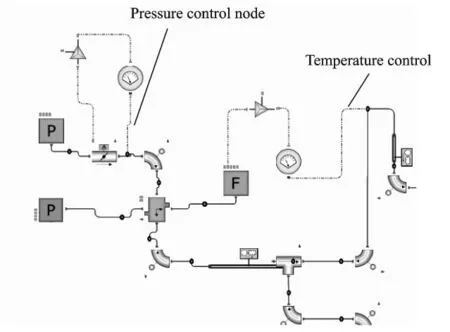
Fig.5 PID control logic in pipeline
The duct system from the bleed air source to the anti-ice is called branch 1while that to ECS is branch 2.
3 SIMULATION RESULTS
In order to investigate whether the characteristics of the system meet the requirements of the design,the steady state simulations are carried out.The detailed information is shown as follows.Table 5gives the results of the pre-cooler and the engine bleed air,where Tactis the actual temperature of the control node while Ttherothe theoretical value,e the error percentage,Fprecoolerthe mass flow rate at the cold side of the pre-cooler,and Ftotalthe mass flow rate at the hot side of the pre-cooler.
From Table 5,it can be obtained that the relative error between the actual temperature andthe theoretical temperature of the control node is less than 2%,which meets actual requirements.Better results can be improved by optimizing the PID control logic.The flow rate of the cold side of exchanger depends on the temperature of the control node,and is evaluated by iterative analytical method based on the exchanger efficiency.In the cruise state,the flow rate of the cold side is 0,mainly because the temperature of the control node is lower than the design valve,namely the pre-cooler does not need to work for this case.The total flow rates of the bleed air from the engine are 0.98,0.95and 0.93,respectively,which are lower than the design value of 1.15.That is to say,characteristics of the pre-cooler and the flow rate of the bleed air in the three cases can meet the requirements.
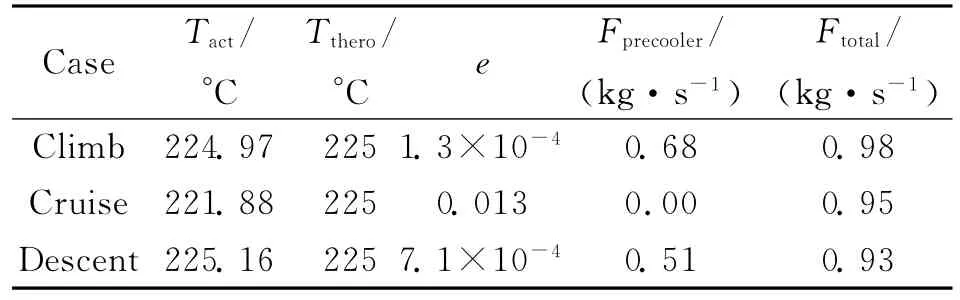
Table 5 Characteristics of pre-cooler and bleed air
Fig.6indicates the heat transfer performances of PCE.It can be seen that the outlet air temperature remains control temperature when the inlet air temperature is higher than the control temperature of PCE.It is deserved to be mentioned that the air temperature will remain unchanged when the inlet air temperature is lower than the control temperature of PCE.
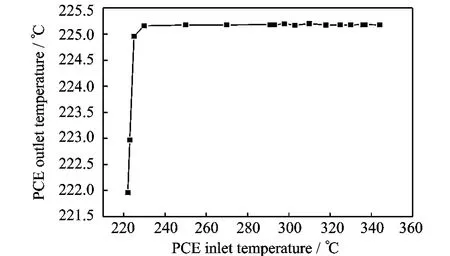
Fig.6 Variation of outlet temperature with inlet temperature of PCE
Characteristics of valves are shown in Table 6,where Pais the actual pressure of control node while Ptherothe theoretical value,and e the error percentage.
From Table 6,it can be seen that the relative error between the actual pressure and the theoretical pressure of the control node is less than 2%.The open ratio of the valve can be obtained.Theresults show that fairly spare capacity of the valve open ratio is left for the unusual situation.

Table 6 Characteristics of valves
Characteristics of anti-ice are shown in Table 7,where Pinis the inlet pressure before the piccolo,Tthe outlet temperature of the piccolo,Vand Foutare the air velocity and the mass flow rate from the piccolo.
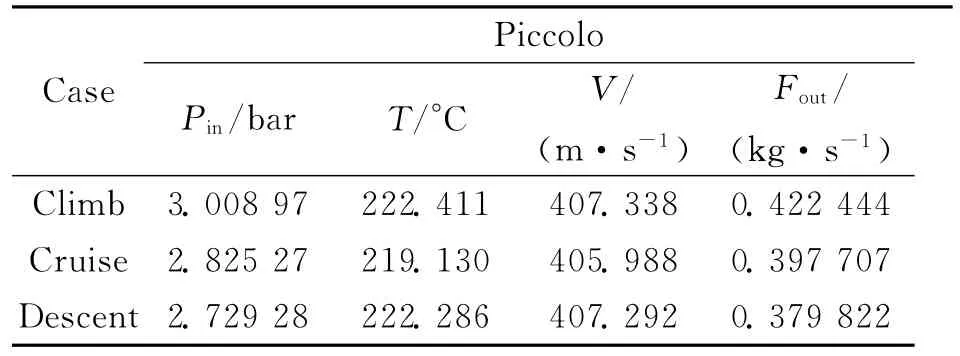
Table 7 Characteristics of anti-ice
From Table 7,it is shown that the flow rate routing to the anti-icing passage in the three cases is larger than the minimum valve in Table 4.The velocity of the air from the piccolo is about 405m/s,larger than the speed of sound.And the temperature is about 220°C.All these results can meet the requirements of the anti-ice system.
Temperature variations in branch 1and branch 2are shown in Figs.7-8.From Figs.7-8,the temperature variation of the duct system accessing to anti-ice direction is much like the situation that the duct system accessing to ECS.The total temperature drop along the pipeline is less than 10°C,which is within the design requirements.In Figs.7-8,the large temperature drop comes from the mixing and diverging of the fluid with different properties.
4 CONCLUSIONS
In this paper,the flow and thermal behavior of the pneumatic duct system is investigated using FLOWMASTER software.Main conclusions are as follows:

Fig.7 Temperature variation in branch 1
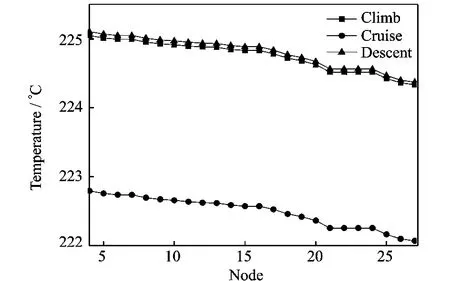
Fig.8 Temperature variation in branch 2
(1)The one-dimensional lumped parameter technology can be used to model the flow and thermal characteristics of the bleed air system .Components such as pressure regulator and shutoff valve,pre-cooler,and flow control valves,etc.can be verified according to the requirements and optimized further for size and structure.
(2)The valve open ratio is determined by the parameter of the control node,and the PID control logic is applied to the system.The computing results show that the actual values sometimes deviate from the design value to a small extent,and better control logic can improve the results.
(3)Numerical simulation of the pneumatic duct system of aircraft enables better understanding the system characteristics,lowering the design time and cutting down the in-flight testing time.
Acknowledgement
My deepest gratitude goes to the engineers of Shanghai Aircraft Design & Research Institute for their cooperation in releasing the data for publication and technical support.
[1] Baptista C A R P,Barboza M J R,Adib A M L,et al.High temperature cyclic pressurization of titanium ducts for use in aircraft pneumatic systems[J].Materials & Design,2009,30(5):1503-1510.
[2] Lynch S P,Hole B,Pasang T.Failures of welded titanium aircraft ducts[J].Engineering Failure Analysis,1995,2(4):257-273.
[3] Adib A M L,Baptista C A R P,Barboza M J R,et al.Aircraft engine bleed system tubes:Material and failure mode analysis[J].Engineering Failure Analysis,2007,14(8):1605-1617.
[4] Li Yanjiang,Feng Zhenzhou,Liu Yongshou.Study on simulation analysis for airplane fuel system[J].Journal of Xi′an Technological University,2008,28(4):401-405.(in Chinese)
[5] Li Yanjiang,Zhang Lisheng,Liu Yongshou,et al.Analysis of pressure surge in aircraft fuel pipelines[J].Aircraft Design,2009,29(5):37-42.(in Chinese)
[6] Li Yanjiang,Liu Yongshou,Jiang Zhifeng,et al.A-nalysis of functional simulation of aircraft fuel system[J].Aeronautical Computing Technique,2009,39(4):113-116.(in Chinese)
[7] Cao Lianhua,Zhuang Damin.Numerical calculation of fluid network system of fighter[J].Aircraft Design,2002(4):37-41.(in Chinese)
[8] Bu Xueqin,Yu Jia,Lin Guiping,et al.Investigation of the design of wing hot-air anti-icing system[J].Journal of Beijing University of Aeronautics and Astronautics,2010,36(8):927-930.(in Chinese)
[9] Ng H W,Tan F L.Simulation of fuel behavior during aircraft in-flight refueling [J].Aircraft Engineering and Aerospace Technology,2009,81(2):99-105.
[10]Tu Yi,Lin Guping.Computer analysis of transport aircraft oxygen system based on Flowmaster[J].Journal of Beijing University of Aeronautics and Astronautics,2009,35(11):1306-1310.(in Chinese)
猜你喜欢
杂志排行

Transactions of Nanjing University of Aeronautics and Astronautics的其它文章
- FLEXURAL CAPACITY OF RC BEAM STRENGTHENED WITH PRESTRESSED C/AFRP SHEETS
- MINIMUM ATTRIBUTE CO-REDUCTION ALGORITHM BASED ON MULTILEVEL EVOLUTIONARY TREE WITH SELF-ADAPTIVE SUBPOPULATIONS
- OUTPUT MAXIMIZATION CONTROL FOR VSCF WIND ENERGY CONVERSION SYSTEM USING EXTREMUM CONTROL STRATEGY
- ACTIVE VIBRATION CONTROL OF TWO-BEAM STRUCTURES
- IMPROVED DOPPLER WARPING METHOD FOR AIRBORNE RADAR WITH NON-SIDELOOKING ARRAY
- MULTI-OBJECTIVE PROGRAMMING FOR AIRPORT GATE REASSIGNMENT