Analysis of shear rate effects on drag reduction in turbulent channel flow with superhydrophobic wall*
2013-06-01NOURINowrouzMohammadBAKHSHMohammadSaadatSEKHAVATSetareh
NOURI Nowrouz Mohammad, BAKHSH Mohammad Saadat, SEKHAVAT Setareh
School of Mechanical Engineering, Iran University of Science and Technology, Tehran, Iran, E-mail: mnouri@iust.ac.ir
Analysis of shear rate effects on drag reduction in turbulent channel flow with superhydrophobic wall*
NOURI Nowrouz Mohammad, BAKHSH Mohammad Saadat, SEKHAVAT Setareh
School of Mechanical Engineering, Iran University of Science and Technology, Tehran, Iran, E-mail: mnouri@iust.ac.ir
(Received December 30, 2012, Revised May 18, 2013)
We examined the shear rate effect on drag reduction of superhydrophobic surfaces with different slip lengths. For this purpose, turbulent channel flow was considered at the friction Reynolds numbers of =Reτ180, 395, 500. By using Navier’s slip condition it is shown that increasing shear rate leads to the greater reduction in drag force and also more reduction occurs in larger slip length. Based on the results, more than 25% drag reduction happens at a friction Reynolds number of =Reτ500 for slip length of 1×10⁻⁵m. The simulation results suggest that reduction in drag force occurs because slip condition reduces the Reynolds stresses, also weakens vorticity filed and the near-wall coherent structures, and therefore turbulence production is decreased.
superhydrophobic, shear rate, drag reduction, coherent structures, channel flow
Introduction
In all the textbooks of classical fluid mechanics it is usually assumed that when a liquid flows over a solid surface, the liquid molecules adjacent to the solid are stationary relative to the solid. In the nineteenth century the validity of this boundary condition was debated by many scientists and it was accepted that if slip did exist, it was too small to be observed by experimental techniques at that time.
The first theory of slip was proposed by Navier. In his model the magnitude of the slip velocity,0u, is proportional to the magnitude of the shear rate experienced by the fluid at the wall
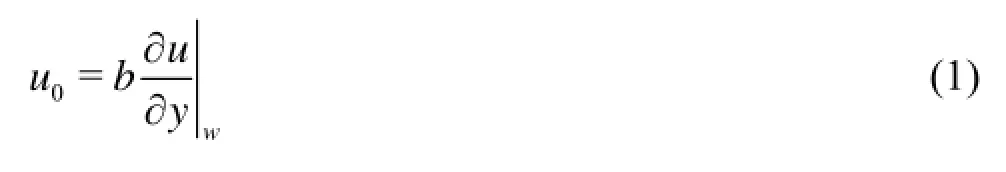
wherebis the slip length. Nowadays high sensitive techniques for measuring interactions and displacements at the nanometer level show that the fluid adjacent to a solid will have a nonzero speed relative to the solid and in most cases Navier’s concept is used to model this slip.
From a practical viewpoint, the wall slip may lead to reduction in flow resistance, so it makes enormous economic benefits. Experiments confirmed that great slip can achieved on modified substrates. This modification causes some surfaces to be known as hydrophobic surfaces. Experiments shows that smooth hydrophobic surface has too small slip length which cannot produce significant slip velocity but if chemical treatment is combined by micro/nano structure, larger slip length can achieve. It is conventionally implied that a longer slip length leads to greater slip velocity and drag reduction. The effects of these surfaces were investigated by many researchers such as Tretheway and Meinhart[1], Ou et al.[2], and Joseph et al.[3].
It is clear that slip length is the main characteristic of these surfaces. Although slip length is generally depend on shear rate[4]in many numerical research it is assumed that the slip lengthbis unaffected by shear rate which happens in moderate shear rate (see Refs.[5]-[7]). In addition, it is obvious that if the slip length remains constant, increasing in shear rate leads to larger slip velocity. In other words higher Reynolds number and turbulent flow which experience largershear rate would have greater drag reduction, such as at ship surfaces.
To analyze the effect of hydrophobic surfaces Min and Kim[5]used Navier’s hypothesis and assumed a constant slip length with Direct Numerical Simulation (DNS) to examine the relation between drag reduction and slip length. Their results demonstrated that for noticeable effect on turbulence structures, the slip length must be greater than a certain value. In addition they confirmed that the mechanism of drag reduction with superhydrophobic surface is quite different from active blowing/suction or other method such as adding polymer. Martell et al.[8]applied DNS to investigate the effect of microfeature geometry for superhydrophobic surface in turbulent channel flow at the friction Reynolds numbers of =Reτ180, 395, 590. They reported that for the largest microfeature spacing, wall shear stress reduction is greater than 50% meanwhile an average slip velocity is over 80% of the bulk velocity. Gao and Feng[9]performed the DNS of a shear flow over periodically patterned substrate with entrapped gas bubbles. They demonstrated four regimes are observed, depending on shear rate and pattern geometry. They also found that the slip length is affected by shear rate in these regimes.
Most researchers apply the DNS method for the simulation of drag reduction on superhydrophoic surfaces which needs the mesh size smaller than the local Kolmogorov scale. Moreover at high Reynolds numbers for which smaller Kolmogorov scales exist we need very high grid resolution. In other words for many cases using the DNS method is beyond the capacity of computers so it is replaced by other low-cost methods such as the Large Eddy Simulation (LES). Nouri et al.[7]using the LES method with Navier’s model and a variety of slip lengths to investigate the effect of superhydrophobicity on drag reduction in channel flows with a friction Reynolds number =Reτ180. They confirmed that velocity fluctuations in the near-wall region and thereby the Reynolds stress and streamwise vortices are affected by the slip boundary condition. They also indicated that for achieving greater drag reduction, the slip length must be greater than a certain value. The good agreement between their results and the DNS results proved that the LES method is capable of modeling the turbulent structure of hydrophobic wall. And the LES method in a turbulent channel flow for a weakly compressible flow was applied by Li and Yuan[10]. Their results indicated that the decrease of velocity gradient in the near-wall region is responsible for the drag reduction.
As was clarified before, drag reduction on superhydrophobic surfaces is considerably dependent on shear rate. In other words, for higher Reynolds number which the flow experiences higher shear rate and the drag reduction is greater. It means hydrophobicity performance can be improved if the velocity increases, which includes channel flow or moving body. Hence, the aim of this paper is to determine the effect of shear rate on superhydrophobic surface performance. For this purpose three different turbulent channel flows atReτ=180, 395, 590 is considered. Applying the LES method combined with the finite volume method under the slip boundary condition helps us to demonstrate that for constant slip length increasing shear rate leads to more reduction in drag. We examine this issue with turbulence characteristics such as vorticity field, shear stress and turbulence production. These results demonstrate that flow characteristics are affected dramatically by the shear rate. So these results can be used to determine the dependency of shear rate and drag reduction on superhydrophobic surface.
In addition we examine the ability of LES method with Navier’s model for boundary conditions and the results demonstrate these two models have the ability to study flow characteristics and make LES an attractive and efficient method.
1. Mathematical and simulation method
The Navier-Stokes equations are the starting point for any turbulence simulation. Equation (2) shows the continuity and Eq.(3) is the momentum equation for the incompressible flow associated with the Newtonian fluid.

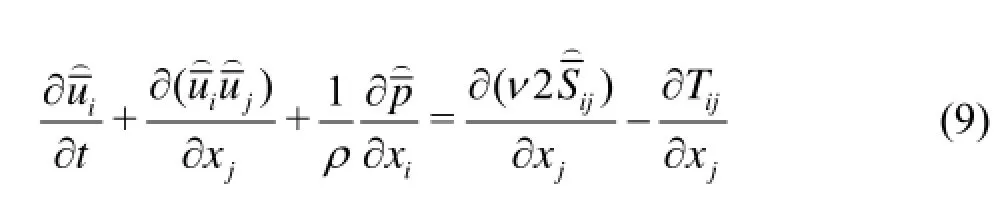
In the LES method large and geometry-dependent eddies are directly solved while the smaller eddies which are homogenous, isotropic, and geometry-independent are filtered from the solution field and their effects are modeled on the field of large eddies. So the equations for the LES are governed by applying the filtering operation (denoted by the overbar) on Eqs.(2)-(3):


whereijτis the turbulence stress term or the Sub-Grid Scale (SGS) stress term. This term indicates the effect of small eddies on large eddies, and it requires to be modeled. The main task of the turbulence model is the modeling of the phenomenon of energy cascade from large eddies toward small eddies, and vice versa. For specifying this term, in the single-phase flow, many models, including the Smagorinsky and the dynamic model, have been presented. The current work applies the dynamic Smagorinsky model, which compensates for some Smagorinsky’s shortcomings. By applying two filters, a grid filter with the filter length Δ (the same size as ︵the grid length) and a filter with twice the grid length Δ︵=2Δ (which is called the test filter and indicated by(…)), on the Navier-Stokes equations we will have
in which, the sub-grid stresses are defined as follows

If the test filter was applied on the filtered Navier-Stokes equations, we would obtain the following equation
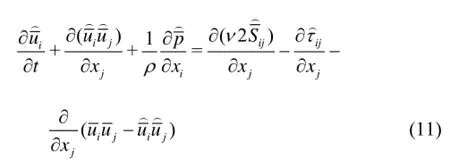
By comparing with Eqs.(9)-(11), we will see that

in which the dynamic Leonard stresses is defined as follows

The Leonard dynamic stress express t︵he stresses which is between the scales of Δ and Δ=2Δ. By considering a method similar to the one in the Smagorinsky model, in which the SGS stress tensorijτis modeled by an eddy-viscosity concept, for the tensors ofijTandijτin dynamics model we will have


In the above relation,Cis a function of time and space.

Fig.1 Flow chart of CFD calculation

Table 1 Simulation parameters for the three cases
Equation (16) is a tensor equation. For solving this tensor equation, Lilly (1992) expressed the square of difference of the two sides of Eq.(16) with a term likeQ:
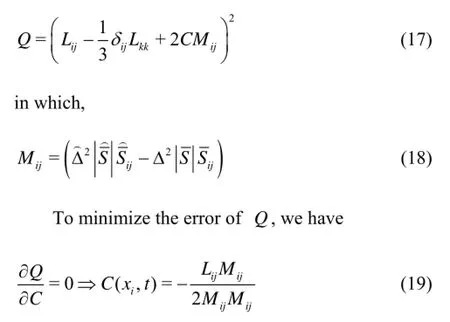
As is clear, the coefficientCis estimated by the model itself instead of determining by users, the value of this parameter diminishes automatically near the walls, and for laminar flows, it tends to zero and is eliminated. Negative values ofCare also possible and they are used for the modeling of the transfer of energy from small scales to large scales.
2. Numerical method
The filtered equations have been solved by using the open source Computational Fluid Dynamics (CFD) code called the OPenFOAM. This computer code uses the finite volume method, and it has been extensively validated for the LES method. To eliminate the pressure-velocity coupling, the PISO algorithm has been applied. The second-order method is used for the convection and diffusion, and the second-order backward method is employed for the time integration. The time step has been so chosen that the maximum Courant number of the flow is 0.01.
The results of the fully-developed channel flow with no-slip condition are used as initial conditions for solving the channel flow problem with the slip at wall boundary condition. The flow chart of the CFD calculation for slip modeling is presented in Fig.1. For applying Navier’s slip condition on the bottom wall it is necessary to calculate the temporal and local gradient of the velocity on the wall by solving the channel flow field. For estimation the slip velocity at the hydrophobic wall, this velocity gradient is substituted into Eq.(1).
3. Flow configurations and setting parameters
In the simulation performed herein three different shear stresses in turbulent channel flows are selected. The Reynolds numbers based on the channel half-length and the friction velocity are =Reτ180, 395, 590. The periodic boundary condition is applied in the streamwise ()Xand spanwise ()Zdirections. A regular no-slip wall is applied at the top of the channel. The initial condition is a flow field with 20% turbulence intensity and for different cases the mean flow velocities in the streamwise direction are different. A uniform mesh is employed in the streamwise and spanwise directions whereas in the wall-normal direction, a non-uniform mesh with the hyperbolic tangent function is used .The details of all cases are summarized in Table 1.
As was mentioned above, for Navier’s slip modeling theory is used. There are many experimental and numerical researches which indicated this model has a good ability to predict superhydrophobic effects on the wall. So two different slip lengths are considered which are 2×10⁻⁶m and 1×10⁻⁵m. To use slip condition local gradient of the velocity on the bottom wall calculated and slip velocity at the hydrophobic wall are estimated by the algorithm illustrated in Fig.1.
The results were normalized by the friction velocity at the no-slip wall0uτ. For verification of no-slip results we checked them with the DNS results obtained by Moser et al. for =Reτ180 and =Reτ395[11], and the LES results obtained by De Villiers for =Reτ500[12].
4. Results and discussion
4.1No-slip results
Before applying the slip boundary condition we examined the LES method for these cases with no-slip boundary condition. The converged results of channelflow in this section are used as initial condition for solving the channel flow problem with the slip boundary condition. Figure 2 illustrates a good agreement in mean velocity between other researchers’ results and current work. In Fig.3 the root mean squares of velocity fluctuations in the streamwise, wall normal and spanwise directions are compared with those DNS results for =Reτ180. The same comparison is done for theses fluctuations for two other Reynolds numbers, which are shown in Figs.4 and 5. These results show acceptable accuracy in comparison with the DNS solution for each Reynolds number. As is expected, this accuracy is repeated in the Reynolds stresses which are normalized by the square of friction velocity,uτ20and is shown in Fig.6. It should be mentioned that forReτ=500, onlyUrmsandVrmsare available, so comparison forrmsWand Reynolds stress in slip case will done with the LES results in no-slip condition.

Fig.2 Comparison of mean velocity profiles for LES solutions and those in Refs.[11,12]
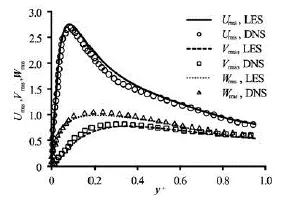
Fig.3 Comparison of root mean squares of velocity fluctuations for the DNS[11]and LES solutions for =Reτ180
The results outlined in this section enjoy adequate accuracy in comparison with the DNS or experimental results. So we use them as an initial condition for modeling the slip condition on hydrophobic channel wall.

Fig.4 Comparison of root mean squares of velocity fluctuationsfor the DNS[11]and LES solutions for =Reτ395

Fig.5 Comparison of root mean squares of velocity fluctuations for the LES results[12]and LES solutions for =Reτ500

Fig.6 Comparison of Reynolds stresses for three cases
4.2Slip results
4.2.1 Effect on velocity field
As was mentioned above, to account the effects of the hydrophobic surface as well as consider the slip boundary condition, two slip lengths were applied to the slip boundary condition (Eq.(1)). Figures 7, 8 and 9 show the mean velocity profile in the three cases. In Fig.7 there is no tangible change which is mentioned in Ref.[7]. Although at =Reτ395, 590 we use the same slip length as =Reτ180, changes in velocityprofile compare to the no slip are somewhat more pronounced. Figure 10 illustrates that increase of the slip length leads to an increase in the slip velocity on the hydrophobic boundary. For clearer display, this figure plots only near the hydrophobic surfaces. In addition, in each slip length, increase of shear rate leads to a significant change in slip velocity and dramatic fall in friction velocity.

Fig.7 Mean velocity profile for slip in the streamwise direction for =Reτ180
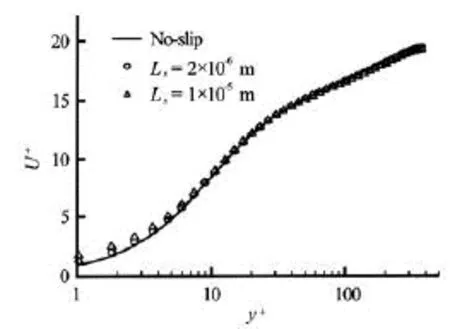
Fig.8 Mean velocity profile for slip in the streamwise directionfor =Reτ395
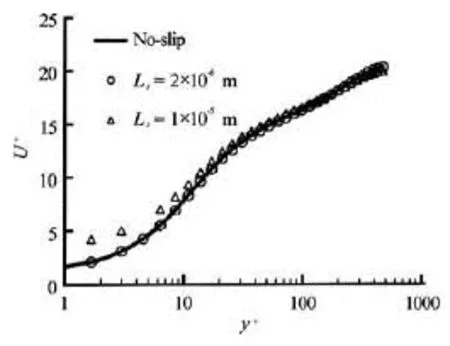
Fig.9 Mean velocity profile for slip in the streamwise direction for =Reτ500
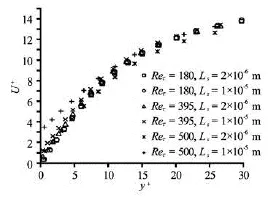
Fig.10 Velocity profile near the hydrophobic wall for all cases

Fig.11 Velocity fluctuations for two slip lengths at =Reτ180
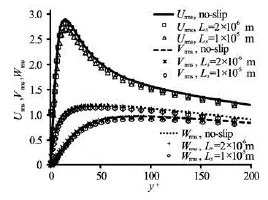
Fig.12 Velocity fluctuations for two slip lengths at =Reτ395
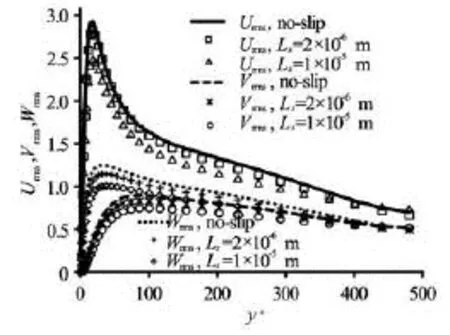
Fig.13 Velocity fluctuations for two slip lengths at =Reτ500
4.2.2 Effect on velocity fluctuations and Reynolds
stresses in the flow
Another Reynolds number effect in wall-bounded turbulence is in the root mean squared (rms) velocity profiles (rmsu,rmsvandrmsw). These are plotted in Figs.11, 12 and 13. In agreement with the observation of velocity profile for the slip length of 2×10⁻⁶m thechanges of velocity fluctuations are not sensible especially at =Reτ180 which has the minimum shear rate among other cases. However by increasing the slip length to 1×10⁻⁵m the fluctuations are drastically reduced. These findings indicate that with increasing slip length and shear rate the near-wall turbulence structures are weakened. In addition, there are larger variations for larger shear rate. It means the velocity fluctuations at higher Reynolds number are more affected by superhydrophobic fabrication.

Fig.14 Reynolds stresses for all cases with different slip length
Figure 14 illustrates the changes in the Reynolds stresses. The Reynolds stress is of the magnitudes of the resolved shear and normal forces in the fluid and are assumed as second-order turbulence characteristics. By increasing the slip length and shear rate, the Reynolds stress down-shifts and indicate the change of the turbulence structures is affected by hydrophobic surfaces.
Note that although the peak of Reynolds stress is reduced, it is at a same wall distance in comparison with no- slip results. These results confirm that drag reducing phenomena in superhydrophobic surfaces are quite different from the other method such as microbubble injection, for which the peak is shifted away from the wall[13].
4.2.3 Effect on near wall coherent structure by consideringQcriterion
Another parameter to investigate the effect of superhydrophobic surfaces is coherent structure. For this issue theQcriterion is used.Qis defined as[14]
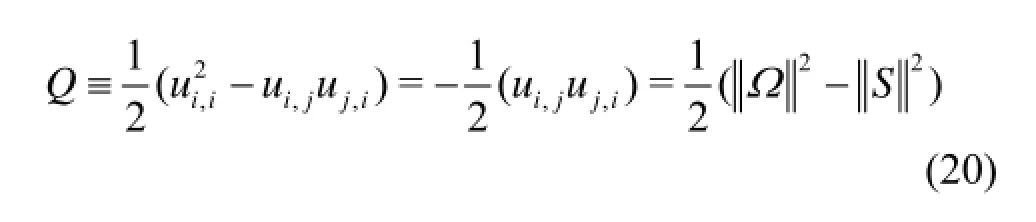
whereSandΩare the symmetric and antisymmetric components ofu∇. SoQrepresents the local balance between shear strain rate and vorticity magnitude. Figures 15-23 shows theQcontours at+=y5 for different Reynolds number and two slip lengths. All

Fig.15 Counters ofQfor no slip channel in =Reτ180 at+=y5
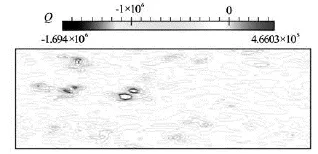
Fig.16 Counters ofQfor slip length of 2×10⁻⁶m in =Reτ180 at+=y5

Fig.17 Counters ofQfor slip length of 2×10⁻⁶m in =Reτ180 at+=y5
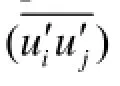

Fig.18 Counters ofQfor no slip channel in =Reτ395 at+=y5

Fig.19 Counters ofQfor slip length of 2×10⁻⁶m in =Reτ395 at+=y5

Fig.20 Counters ofQfor slip length of 1×10⁻⁵m in =Reτ395 at+=y5

Fig.21 Counters ofQfor no slip channel in =Reτ500 at+=y5

Fig.22 Counters ofQfor slip length of 2×10⁻⁶m in =Reτ500 at+=y5
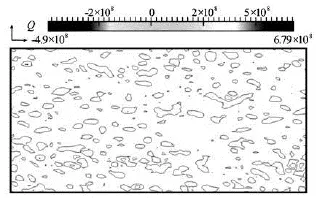
Fig. 23 Counters ofQfor slip length of 1×10⁻⁵m in =Reτ500 at+=y5
4.2.4 Effect on vorticity and drag reduction
Figures 24-29 illustrate the contours of vorticity in the streamwise direction on theyz- plane forReτ=395 and 500. These two Reynolds are selected because of their significant modification. As we expected the vortices in the flow direction and close to the wall are weakened considerably compared to those in the no-slip channel and this reduction increase withshear rate and slip length. In terms of turbulence production, changing in vorticity means the gradient of mean flow velocity is alter. Consequently turbulence production affected and decrease by lower vorticity in superhydrophobic surfaces.
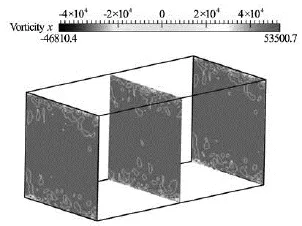
Fig.24 Vorticity field in no slip channel at =Reτ395
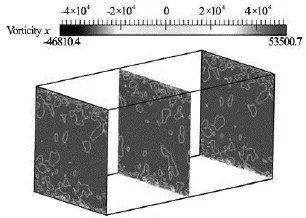
Fig.25 Vorticity field in channel atReτ=395,Ls=2×10⁻⁶m

Fig.26 Vorticity field in channel atReτ=395,Ls=1×10⁻⁵m
The most important deduction that can be made from all these results is that hydrophobic surfaces with slip boundary condition reduce the drag in the turbulent boundary layers. So in this section the results of the simulation are presented based on drag reduction.
The relation used to determinine the percentage of drag reduction is

Table 2 summarizes the changes of the frictional drag for each case. The results show that, in turbulent flows, for significant drag reduction to occur, the slip length should be larger than a certain value[7], and furthermore higher shear rate make a larger reduction in skin friction.
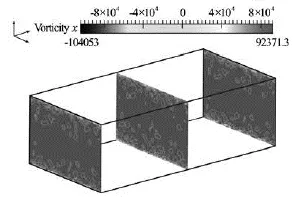
Fig.27 Vorticity field in no slip channel at =Reτ500
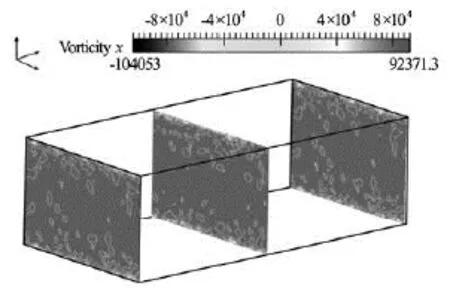
Fig.28 Vorticity field in channel atReτ=500,Ls=2×10⁻⁶m

Fig.29 Vorticity field in channel atReτ=500,Ls=1×10⁻⁵m
Figure 30 illustrates the changes of the frictional drag reduction with shear rate for each slip length. This trend confirms that the boundary condition at the surface (e.g., the hydrophobic characteristics of the surface) plays an essential role in determining the nature of near-wall turbulence.

Table 2 Amount of drag reduction in all cases
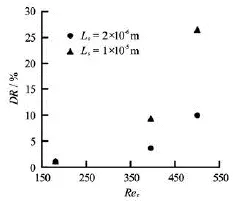
Fig.30 Rate of frictional drag reduction at each Reynolds and slip length
5. Conclusion
This paper has investigated the effect of shear rate on drag reduction for superhydrophobic surfaces. The LES method is used for numerical simulation and boundary condition is modified by using Navier’s law for hydrophobic surfaces. Three friction Reynolds numbers of =Reτ180, 395, 590 are selected to considering different shear rate and all simulation performed for the slip lengths of 2×10⁻⁶m and 1×10⁻⁵m. Results indicate that at slip length of 1×10⁻⁵m in the maximum shear rate more than 25% of drag reduction occurs in comparison of no-slip condition. It is found that supehydrophobic surfaces produce several changes in turbulent channel flow. This boundary condition alters the peak magnitude of Reynolds stress and velocity fluctuations. It also changes coherent structure and cause the streamwise coherent structure to deform and stretch in the spanwise direction. The shear stress at the superhydrophobic surfaces is reduced which is directly related to drag reduction. The results indicate that this reduction occurs through the changes in turbulence production. Examination of vorticity field and Reynolds stress (which are responsible for turbulence production) indicate that both of them are weakened near the superhydrophobic wall. In addition, for both slip lengths, larger reduction in drag force is reported here at higher shear rate. These results are useful as it means slip surfaces can be developed for practical application which experience high Reynolds numbers and higher shear rates. Our results confirmed that such surfaces allow larger effective slip in larger shear rate which happen in practice. All these mean reaching to higher velocity, which is ideal for every moving body in the water, could be accessible by using this surface.
[1] TRETHEWAY D. C., MEINHART C. D. Apparent fluid slip at hydrophobic microchannel walls[J].Physics of Fluids,2002, 14(3): 9-12.
[2] OU J., PEROT B. and ROTHSTEIN J. P. Laminar drag
reduction in microchannels using superhydrophobic sur
faces[J].Physics of Fluids,2004, 16(12): 4635-4643.
[3] JOSEPH P., COTTIN-BIZONNE C. and BENOIT J. M. et al. Slippage of water past superhydrophobic carbon nanotube forests in microchannels[J].Physical Review Letters,2006, 97(15): 156104.
[4] CHOI C. H., JOHAN A. and WESTIN K. et al. Apparent slip flows in hydrophilic and hydrophobic microchannels[J].Physics of Fluids,2003, 15(10): 2897-2902.
[5] MIN T., KIM J. Effects of hydrophobic surface on skin
friction drag[J].Physics of Fluids,2004, 16(7): 55-58.
[6] YOU D., MOIN P. Effects of hydrophobic surfaces on
the drag and lift of a circular cylinder[J].Physics of Fluids,2007, 19(8): 081701.
[7] NOURI Nowrouz Mohammad, SEKHAVAT Setareh and MOFODI lireza. Drag reduction in a turbulent channel flow with hydrophobic wall[J].Journal of Hydrodynamics,2012, 24(3): 458-466.
[8] MARTELL M. B., ROTHESTEIN J. P. and PEROT J. B. An analysis of superhydrophobic turbulent drag reduction mechanisms using direct numerical simulation[J].Physics of Fluids,2010, 22(6): 065102.
[9] GAO P., FENG J. J. Enhanced slip on a patterned substrate due to depinning of contact line[J].Physics of Fluids,2009, 21(10): 102102.
[10] LI Ling, YUAN Ming-shun. Modeling of drag reduction in turbulent channel flow with hydrophobic walls by FVM method[J].Acta Mechanica Sinica,2011, 27( 2): 200-207.
[11] MOSER R. D., KIM J. and MANSOUR N. N. Direct
numerical simulation of turbulent channel flow up toReτ=590[J].Physics of Fluids,1999, 11(4): 943-945.
[12] De VILLIERS E. The potential of large eddy simulation for the modeling of wall bounded flows[D]. Doctoral Thesis, London, UK: Imperial College of Science, Technology and Medicine, 2006.
[13] FERRANTE A., ELGHOBASHI S. On the physical mechanisms of drag reduction in a spatially developing turbulent boundary layer laden with microbubbles[J].Journal of Fluid Mechanics,2004, 503: 345-355.
[14] DUBIEF Y., DELCAYRE F. On coherent-vortex identification in turbulence[J].Journal of Turbulence,2000, 1: 1-22.
10.1016/S1001-6058(13)60444-8
* Biography: NOURI Nowrouz Mohammad (1959-), Male, Ph. D., Associate Professor
杂志排行

水动力学研究与进展 B辑的其它文章
- Experimental study by PIV of swirling flow induced by trapezoid-winglets*
- Cavitation bubbles collapse characteristics behind a convex body*
- Experimental study of the interaction between the spark-induced cavitation bubble and the air bubble*
- A preliminary study of the turbulence features of the tidal bore in the Qiantang River, China*
- The calculation of mechanical energy loss for incompressible steady pipe flow of homogeneous fluid*
- Numerical study of flow fluctuation attenuation performance of a surge tank*