Experimental study by PIV of swirling flow induced by trapezoid-winglets*
2013-06-01CHECuicui车翠翠TIANMaocheng田茂诚ZHANGGuanmin张冠敏LENGXueli冷学礼SchoolofEnergyandPowerEngineeringShandongUniversityJinan250061China
CHE Cui-cui (车翠翠), TIAN Mao-cheng (田茂诚), ZHANG Guan-min (张冠敏), LENG Xue-li (冷学礼) School of Energy and Power Engineering, Shandong University, Jinan 250061, China,
E-mail: checui-sdu@foxmail.com
Experimental study by PIV of swirling flow induced by trapezoid-winglets*
CHE Cui-cui (车翠翠), TIAN Mao-cheng (田茂诚), ZHANG Guan-min (张冠敏), LENG Xue-li (冷学礼) School of Energy and Power Engineering, Shandong University, Jinan 250061, China,
E-mail: checui-sdu@foxmail.com
(Received June 5, 2013, Revised July 2, 2013)
The characteristics of the longitudinal vortex induced by trapezoid-winglets in a circular tube are investigated by the Particle Image Velocimetry (PIV) Technique with flow Reynolds number in the range of 500-13 000. In the experimental test section, four trapezoid-winglets are fixed symmetrically on the tube wall in two different ways: up-flow and down-flow. The results show that a counter-rotating vortex pair is formed behind each winglet and they distribute as a symmetrical vortex array in the transverse section. Between the two vortexes in a vortex pair the fluid flows towards the wall in the up-flow winglet case and away from the wall in the down-flow winglet case, corresponding also to the regions of peak values of the velocity components normal to the mainstream. Both of the flow patterns enhance the velocity in the near wall region, leading to the intensification of the transverse mixing and the mass transfer in the tube. With Reynolds number increasing, the flow maintains the vortex pattern in the case of the up-flow winglets, indicating better persistence of the longitudinal vortex, while the vortexes in the case of the down-flow winglets are more scattered and tend to breaking into small eddies. The trapezoid winglet shows the preferable turbulent disturbance characteristics in the tube and the experimental results provide benchmark data for further CFD studies.
longitudinal vortex, Particle Image Velocimetry (PIV), trapezoid-winglets, circular tube
Introduction
The flow mixing is a common process in the fine chemical, polymerization, pharmacy, biochemical industries and the heat transfer enhancement. Based on the turbulent mixing mechanism, the stirred tank mixer, the jet mixer, the impinging stream mixer, the static mixer and the dynamic mixer are widely used to achieve the liquid-liquid dispersions, among which, the static mixer has been developed in recent 20 years for its advantages such as smaller equipment dimensions, no moving parts, better process control property, shorter residence time and improvement of reaction selectivity[1]. With twisted blades added in the channel for example, the flow mixing can be fully developedafter a series of processes of dispersions, mixing and rotations induced by the mixing elements. Much attention was paid to the static mixers, among which the longitudinal vortex generator is one type widely studied.
The adoption of vortex generators is a passive method based on secondary flow enhancement, which intensifies the energy and mass transfer in the channel[2]. The longitudinal vortex can lead to 3-D flow structures with rotation axes in the flow direction, which disturb the velocity boundary layer along the main flow direction continuously while causing relatively low friction loss by means of a large-scale turbulence. Since the flow pattern plays a key role in understanding the disturbance characteristics and the heat transfer performances, extensive studies were focused on the longitudinal vortex by both numerical and experimental methods.
The earliest studies of the streamwise vortex were focused on delaying the boundary layer separation on aircraft wings in 1960, and it was not related to the heat transfer until 1969 when the vortex generator was proposed to increase the local Nusselt numbers as much as 200% in the heat transfer. Ferrouillatet al.[3]made a further study, in which the vortex generator was used as a multi-functional heat exchanger, finding that the longitudinal vortex can induce the flow in the direction perpendicular to the main flow and enhance the mixing, which was beneficial for the heat transfer enhancement and the macro-mixing. Different types of longitudinal vortex generators were proposed, such as rectangular and triangular wings or winglets. In a numerical study[4], the triangular vortex generators were shown to be more efficient in terms of compactness. Kaci et al.[5]numerically and experimentally studied the effect of the trapezoid winglets embedded in a cylinder tube, finding that the streamwise vortex greatly enhanced the radial convective transfer. Compared with other multifunctional heat reactors, the heat transfer performance of the trapezoid winglets can be improved by 20% while the energy cost cut down by 20%-30%. Dong and Meng[6]studied the flow passing over a trapezoidal tab on a flat plate by the direct numerical simulation, as a new approach to study the vortex dynamics in the wake zone.
Recently, a non-intrusive visualization measurement technique–the Particle Image Velocimetry (PIV) method was widely used to observe the 3-D swirling flow pattern. Tang et al.[7]adopted the PIV technique to obtain the average velocity field in a rectangular channel with a spiral coil inserted. The multi-longitudinal vortex structure was analyzed through the distributions of the vorticity and the turbulent intensity. Henze et al.[8]evaluated the mean velocity and the velocity fluctuations behind a tetrahedral vortex generator with the 3-D PIV method. The physical conditions were described in detail by a combined investigation of the heat transfer and the flow field.
Experimental characterizations of the swirling flow behavior in the tube are necessary to develop models to predict the hydraulic and thermal behavior of the longitudinal vortex generators with enough precision. For this reason, this work made a detailed experimental investigation of the longitudinal vortex induced by trapezoid-winglets placed both up-flow and down-flow in a cylinder by the 2-D PIV measurement.
1. Experimental setup
1.1Overall schematic diagram
A schematic diagram of the experiment in a closed-cycle water loop is shown in Fig.1. The system consists of two parts: the water circulation system and the measurement system. The water circulation system includes the overflow water tank, the control valve, the buffer tank, the test section, the holding tank, the water cycle pump and the over-flow tube. Besides, some auxilliary devices are used to make the operation more accurate and convenient. For example, flow straighteners are installed close to the two ends of the tube to make the current uniform; a slide rail is applied to capture the information on different test sections without moving the whole equipment and the liquid level relay keeps the fluctuation of the water level on a small scale by controlling the water pump automatically. In the loop, the working fluid enters the buffer tank from the head overflow water tank and then flows through the test section after stabilization by the regulation straighteners, and eventually the pump will drive the water flowing into the holding tank back to the overflow tank, which makes one water cycle. In order to ensure good visual conditions for the PIV measurement, 0.005 m thick transparent acrylic sheets are used to construct the channel and a 0.002 m thick transparent Plexiglas pipe with inner diameter of 0.036 m is adopted for the test section.
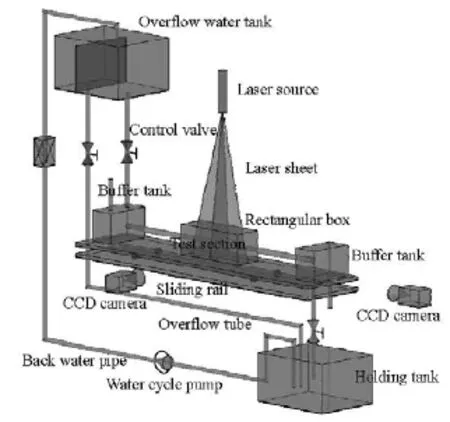
Fig.1 Schematic diagram of experimental setup
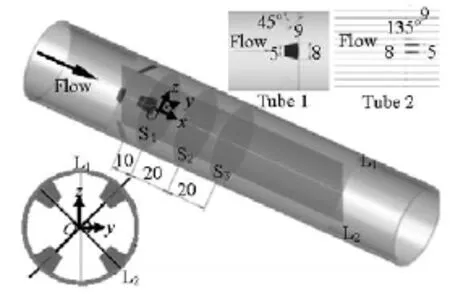
Fig.2 Schematic diagram of the test section
1.2Test section
The experimental test section consists of the PIV system and a cylindrical tube equipped with four winglets fixed along the wall in a central symmetry. The four winglets are placed at 90° with respect to one another, and each tab is inclined at an angle of 45oor 135orelative to the tube wall in the flow direction. In the present experimental investigation, the two mou-nting patterns are defined as up-flow in tube 1 and down-flow in tube 2, respectively. Figure 2 shows detailed dimensions of the winglets and a schematic view of the test section.
The experiment is performed under a steady flow with Reynolds number ranging from 500-11 000. Both transverse and longitudinal sections were investigated for the complexity of the flow field. S1, S2, S3and L1, L2stand for the transverse and longitudinal sections, respectively, and the positions of which are shown in Fig.2. The number (0.01 m, 0.03 m and 0.05 m) indicates the distance between the trailing edge of the winglets and the measurement section. To eliminate the optical refraction effects, as proposed by Wan et al.[9], a rectangular transparent container filled with water is used as an optical interference canceller to ensure accurate capture of the velocity field in the longitudinal sections.
1.3PIV system
Unlike single-point velocity measurement methods such as LDV and HWA[10], the PIV is a multi-point measuring technique for quantitative measurements of fluid velocity vectors at a large number of points simultaneously. The PIV system mainly consists of a power laser, a laser sheet, a high speed CCD and a synchronizer.
The measurements with the PIV technique are carried out by digitally tracing the motion of the particle images. Glass beads are selected as seeding particles with diameter of about 25 μm and density of 1.05×10³kg/m3, which show a good performance in previous experiments. The illumination of the particles is performed by a double pulse Nd: YAG laser with a wave length of 523 nm and a maximum energy of 200 mJ/pulse and the time between two consecutive pulses varies between 3 ms and 80ms according to the average velocities. A CCD camera (a resolution of 1 344×1 024 pixels, equipped with a NIKON60mm lens) is used to record the motion of the seeding particles which carry the velocity information and the data are transferred to computer for analysis by an input buffer. The setup of the present measurements enjoys a space resolution of approximately 113 μm/pixel in the transverse section and 100 μm/pixel in the longitudinal section, corresponding to a circular field of 18mm in radius and a 0.036 m×0.112 m rectangular field by masking the area out of the channel, respectively. At least 200 pairs of images are acquired for each flow condition in order to get the time-averaged velocity field and other vector statistics. DynamicStudio(3.20) software developed by Dantec Dynamics is adopted to process each image pair by an adaptive-correlation algorithm, creating a 2-D velocity vector map on an interrogation window of 16×16 pixels with 50%×50% overlap.
The factors that influence the accuracy of the measurement and the analysis include the camera view width, the image width, the particle displacement and the light pulse interval time. According to the user’s manual of the Dantec PIV, the corresponding uncertainties are 0.0005 m, 0.5 pix, 0.1 pix and 0.1 μm, respectively. The 2-D PIV technique applied in this experiment is similar to that employed in Ref.[11]. Besides, the uncertainty in velocity is reported to be less than 20%± in Refs.[10,12,13], and it is approximately 1.3% for the digital PIV system applied in this paper.
2. Results and discussion
2.1Parameter definition
The average Reynolds number based on the tube diameter is defined as
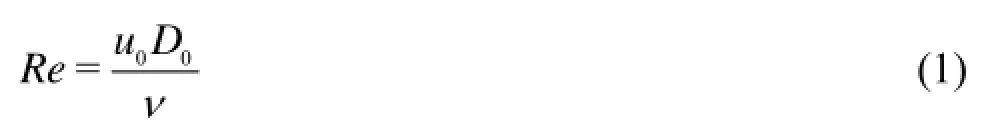
whereνdenotes the kinematic viscosity,0uis the inlet mean velocity and0Dis the diameter of the tube.
The streamwise vorticityyzΩin the transverse section is defined as

whereyuandzudenote the transverse component velocities along the directions ofyandzaxes, respectively.
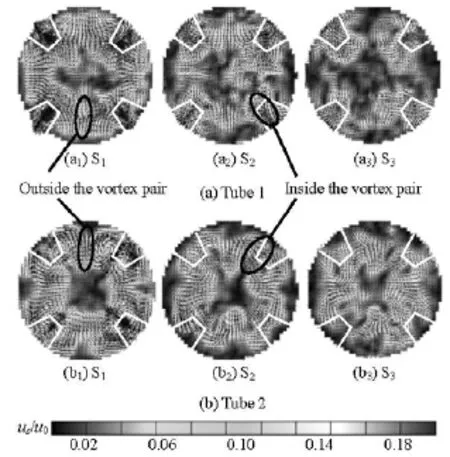
Fig.3 Time-averaged velocity vector field at S1, S2and S3,Re=1 000
Furthermore, the velocity and the radial distance in the present study are normalized by corresponding inlet mean velocity 0uand the tube radius 0Ror tube diameter0D.
2.2Flow structure in transverse sections
Figure 3 shows the time-averaged velocity vector fields at transverse sections S1, S2and S3downstream the winglets at =Re1 000. The transverse velocity magnitude defined assuis normalized by the inlet mean velocity0uobtained from the measurement results. In both cases, a counter-rotating vortex pair is observed behind each of the winglet where one sees a recirculation zone and symmetric vorticity patterns in the near wall region due to the uniform arrangement of the winglets. The cores of the vortex pair move gradually away from the wall as they move downstream and the strength of the secondary flow becomes weaker, as is reflected by the decreasing velocity magnitude. Although the secondary flow can be induced by the winglets placed both up-flow and down-flow, it is noted that the types of the vortex are different in the two cases. The vortex pair in tube 1 shows two flow patterns in the near wall region: inside the vortex pair the flow is towards the wall while outside the vortex pair the flow is away from the wall, however, the flow directions of the vortex pairs in tube 2 are opposite. In addition, compared with tube 2, the vortexes in tube 1 sustain longer. From section S3(Figs,3(a3), 3(b3)), 0.05 m downstream the winglets, it can be seen that the vortex pairs keep intact and spread tidily in the near wall region in Fig.3(a3). However, in Fig.3(b3) one sees no regular vortex pairs, but a flow field of much disorder, besides, the higher velocity magnitude zone occupies a region of smaller proportion compared with that of Fig.3(a3).
To have a better understanding of the velocity distribution in the cross sections, the components of the transverse velocity in circumference and radial directions are shown in Figs.4-6. The transverse velocity magnitude and its components are normalized by the inlet mean velocity and the distance to the channel center is normalized by the radius of the tube.
Figure 4 shows the average transverse velocityus-rat Reynolds number 1 000 and 7 000 in the circumference direction varying with the distance from the tube center at three test sections. As shown in Fig.4, in both cases, the transverse velocity is significantly promoted behind the winglets covering from 0.3R0to 0.9R0, and as expected, the magnitude ofus-ris noticeably higher at the nearer distance from the winglets. The velocity ratio is much lower at the location of 0R0-0.2R0since the turbulence mixing can hardly be extended to the tube center region, and the velocity magnitude near the wall (0.9R0-1R0)decreases due to the viscosity.

Fig.4 Average transverse velocity along the circle at different radii in S1, S2and S3sections
It is noted that the distribution is almost identical across the three sections in tube 1, showing a parabolic shape with peak values of 0.12u0-0.15u0at the position ofR/R0=0.6-0.7 in section S1. However, this pattern does not apply to tube 2. For tube 2, the maximumus-avgwhich is 0.08u0-0.11u0at the section S1while its specific position shows no definite radial distribution pattern. Furthermore, the velocity distribution is much more scattered, even along the radial direction. From the values of the dimensionless velocity, it is seen that the winglets placed up-flow in tube 1 show better performance at higher Reynolds number whereas the winglets placed down-flow in tube 2 perform better in lower Reynolds number flow in view of the degree of the flow disturbance in the transverse direction.
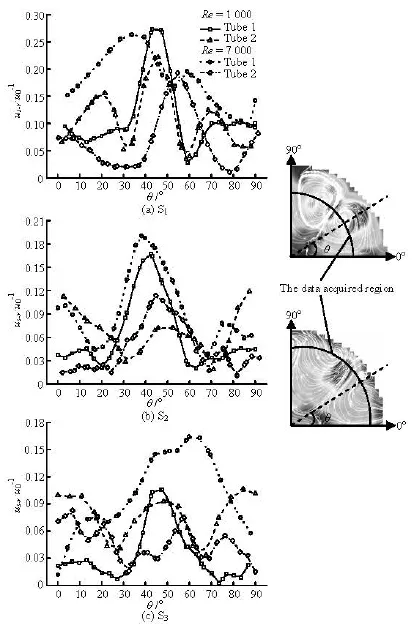
Fig.5 Distribution of transverse velocity along the circle in S1, S2and S3sections
Besides, the velocity magnitude in sections S2and S3indicates that the strong swirling flow is hardly declined as the flow moves downstream in tube 1, especially for higher Reynolds number flow. However, the intensity of the disturbance in tube 2 gets much weaker and is declined along the mainstream direction.
Since the flow field is symmetrically distributed with a period of 90o, a 1/4 flow field along the peripheral direction through vortex cores is used for analysis. In section S1 shown in Fig.5, there exists a peak value corresponding to a down-wash flow and an upwash flow region in tube 1 and tube 2, respectively, the flow pattern of which may be an indication of higher mass transfer and mixing. The points corresponding to the peak velocities lie at the central angle of 30o-60o, which is right behind the winglets. Since the flow velocity in the vortex region is declined in the radial direction and reaches a local minimum close to the vortex cores, there are two minimum transverse velocity values in each curve; besides, the location of the lowest points is different from each other.
From Fig.5, it is clearly seen that the velocity magnitude of the down-wash flow in tube 1 is much higher than that in tube 2, whose peak value corresponds to the up-wash flow at each Reynolds number. Along the circumference direction the value increases when the lines go through the vortex cores until to the down-wash or up-wash region. As is not expected, in tube 2 the velocity value of the up-wash flow is higher than that of the down-wash flow in S1but as the flow moves downstream the down-wash flow maintains its strength with the peak value even surpassing that of the up-wash flow at lower Reynolds numbers. It can be inferred that the strength of down-wash flow does not easily decay in either tube 1 or tube 2.
As mentioned before, the disturbance effect declines as the flow moves downstream, from section S1to S3in both cases. The maximum velocity in section S3drops to nearly 1/3 of the value in section S1fortube 1. In tube 2, the reduction of the value is much sharper in a near distance behind the winglets (in section S1and section S2) and becomes gentle in a farther distance, especially at the lower Reynolds numbers.
Akcayolu[14]verified that the heat transfer is more efficient in cases where the velocity vectors are directed towards side walls. Therefore, the downward and upward velocity vectors caused by the twin vortexes in this experiment are important as the flow pattern generates significant wall shear stresses and makes the boundary layer thinner, which will enhance the mass transfer effectively. Figure 6 shows the distribution of the velocity component normal to the tube wall in section S1with Reynolds number at 1 000 in both cases, where the positive values stand for the flow moving towards the wall while the negative values means the flow away from the wall. The detailed position is shown in Fig.6.
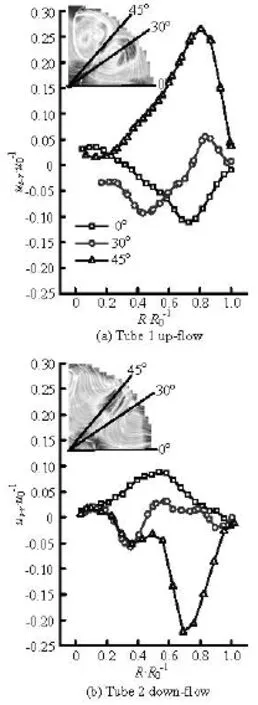
Fig.6 The variation of-sruwith0/RR, =Re1 000
Comparing the graphs one can see a similar behavior for both tubes that the peak value of the velocity component normal to the wall lies in the middle of the two adjacent vortex regions corresponding to the 45oline. In tube 1, the peak value of00.25uis located at 0.2R0to the wall with a positive value for the down-wash flow, whereas in tube 2 the peak value reaches 0.24u0at 0.3R0to the wall with a negative value for the up-wall flow. On the other hand, the flow between adjacent winglets along the 0oline is in an opposite direction and the magnitude is relatively lower as00.1u. The 30olines go through the vortex and indicate much complicated flow patterns. In tube 1, the direction of the velocity component is first to the wall and then changes direction at 0.75R0. From the contour picture, it can be seen clearly that the velocity component decreases to zero at0/=RR0.75 corresponding to the vortex core in tube 1, while the zero value is reached at0/=RR0.8 in tube 2 with three zero points. The secondary swirling flow in tube 2 is more chaotic compared to that in tube 1 in this region. Nevertheless, the component magnitude is rather small compared to the transverse velocity since the flow direction is basically tangential. In both cases, the velocity decreases to zero in the near wall region due to wall friction. It can be concluded that the winglet can effectively induce a flow with velocity components normal to the wall, which enhances the mass transfer between the mainstream and the flow in the near wall region.
2.3Flow structure in longitudinal sections
In order to visualize the flow behavior in the axial direction, two longitudinal sections, section L1and section L2are considered for measurements. The velocity distribution in the longitudinal sections can be used to study the flow pattern and the vortex strength with different winglet arrangements.
As can be seen in Fig.7, the largest velocity measured is behind the winglets in both cases where one sees the key recirculation zone. Naturally, the magnitude of the velocity gets larger with the increase of Reynolds number. The disturbance effect in both tubes can last over long distances in the flow direction and diffuse slowly just as Kirkil et al.[15]reported. However, for tube 1 the disturbance of the flow has a higher intensity and lasts longer along the mainstream, which provides another verification for the better persistence of the turbulence effect with winglets placed up-flow.
The different streamline patterns between tube 1 and tube 2 can also be obtained from the local magnification sketches of L2. From A1and A2, a horseshoe type corner vortex can be clearly seen at the junction of the winglet and the tube wall besides the main longitudinal vortex from the leading edge of the winglets as shown in the transverse plane. However, the location and the size of the recirculation zones are different from one another, indicating a different mechanism of the flow disturbance.

Fig.7 The distribution of velocity in longitudinal sections and partial enlargement
As shown in Fig.8, the patterns of the velocity distribution along the center axis in each tube are quite similar at high Reynolds numbers except some differences in magnitudes. In both tubes, the velocity magnitude decreases with the increase of the distance from the winglets due to a weaker disturbance of the flow. Compared with tube 1, the decline trend of the velocity is more obvious in tube 2.

Fig.8 The velocity profile along the main flow direction in tube 1 and tube 2
From Fig.8 one distinct feature can be seen that the dimensionless velocity in tube 1 is much higher than that in tube 2 as the flow moves downstream atRe=1 000. As the distance downstream of the winglet reaches 3.5 tube diameters, the velocity along the axial direction can still maintain a value of about 1.85u0and is much higher than the corresponding value of 1.5u0in tube 2. It can be deduced that the swirling flow in tube 1 is much stronger than that in tube 2, especially at low Reynolds flow numbers. With higher Reynolds numbers, the difference grows smaller between the disturbance effects in the two tubes.
2.4The variations of theflow field characteristicsagainst Reynolds numbers
The vorticity distribution in the S2plane is shown in Fig.9 with Reynolds number ranging from 500 to 11 000. The red and yellow areas represent the positive (counter-clock-wise) vorticity, and the blue region represents the negative (clock-wise) vorticity with green area meaning the absence of vortexes. The highest absolute value can be found close to the vortex core and the vortexes are well-distributed along the near wall region behind the winglets at moderate Reynolds numbers. In both cases, the vortex strength declines from the vortex core and reaches the minimum in the tube center. The main difference is that the cores of the vortex in tube 1 are located closer to the wall than that in tube 2.
As Reynolds number increases, the secondary flow structures obtained at S2in tube 1 are quite different from those in tube 2 and the swirling motion behind the winglets is only observed in tube 1. In tube 2, the secondary flow breaks into numerous small eddies which are more scattered and non-symmetrical and the vorticity values are more evenly distributed. Meanwhile, the vortex in tube 1 shows a good persistence since the patterns of the vorticity distribution remain consistent except for the order of magnitude which is increased with the increase of the Reynolds number. By further observation, it can be found that in tube 1 the maximum vorticity regions are quite close to the wall, making the vorticity field more distinct.
The mean absolute values of the vorticity in S1, S2and S3sections are shown in Fig.10 with Reynolds number ranging from 500-13 000. The diagram shows that the vorticity field gains strength as Reynolds number increases, especially for high Reynolds number flows. In addition, with the same Reynolds number, the secondary flow becomes weaker with growing distance away from the winglets (from sections S1to S3) in both tube 1 and tube 2. The above phenomenon might be due to the fact that the vortex gains energy from the interaction between the static winglets and the moving fluid, and the stronger counterforce causes the flow to obtain more energy, making the vortex sustain longer downstream the winglets. Since the winglets are static, the counterforce directly takes effect on the incoming flow. This is why the vorticity magnitude grows substantially at high Reynolds numbers. Analyzing the vorticity magnitude in tube 1 and tube 2, it is interesting to note that the vortex intensity induced by the up-flow winglets is greater than that induced by the down-flow winglets. The ratio of the average vorticity increases with the increase of Reynolds number, which is 1.5 at =Re5 000 and 2.0 at =Re13 000. Therefore, the up-flow winglets shows better disturbance performance at higher Reynolds number than the down-flow winglets.
As is shown in Fig.10, unlike the distinct gap between the two tubes at high Reynolds numbers, the average vorticity plots are almost identical before
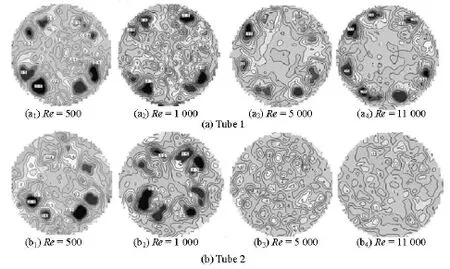
Fig.9 Vorticity distribution in S2section for tube 1 and tube 2
Reynolds number reaches 3 000. As is known, the streamline in a laminar flow is smooth with no disturbance perpendicular to the flow direction and no mass transfer between two adjacent flow layers. Consequently, the secondary swirling flow induced by the winglets maintains its strength as the flow moves to a downstream distance due to the low turbulence intensity in the laminar flow. That explains why the vorticity magnitude in the three sections shows little difference to each other. Besides, for Reynolds number less than 3 000, one sees little difference of the average vorticity between two tubes. Therefore, the placement of winglets (up-flow or down-flow) has little influence on the turbulence effect at low Reynolds numbers.

Fig.10 Mean absolute value of vorticityyzΩ vs. Re
Comparing Fig.10 with Fig.11, it is seen that the patterns of the velocity distribution are quite similar to the vorticity distribution except some minor differences in the magnitude. Most of the conclusions regarding the flow distribution characteristics in three transverse sections concerning the average vorticity fields can also be applied to the transverse velocity fields. What is more, the average transverse velocity magnitude in section S1increases more quickly than that on sections S2and S3when the Reynolds number increases in both cases, which indicates that the value of the velocity normal to the main stream drops significantly as the distance to the winglet increases. Consequently, another longitudinal vortex generator set will be needed if the disturbance of the vortex should continue.
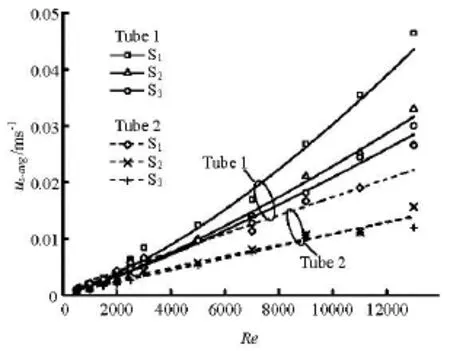
Fig.11 Average transverse velocitysuvs. Re
3. Conclusions
The 3-D swirling turbulent flow induced by the winglets in the cylinder is studied by using the PIV technique. The disturbance characteristics and the swirling flow structures behind the up-flow winglets and the down-flow winglets are analyzed. Based on the experimental results at both transverse sections and longitudinal sections with Reynolds number varyingfrom 500 to 11 000, the following conclusions can be made:
(1) A counter-rotating vortex pair can be observed downstream each winglet. When the winglets are placed up-flow, the inner vortex pair is down-wards while the outer vortex pair is up-wards. The flow pattern is opposite as the winglets are placed down-flow. Either form of the disturbance can enhance the flow mixing and the mass transfer in the tubes.
(2) In both cases, the magnitude of the transverse velocity component normal to the main flow increases significantly, especially in the near wall region. The peak value occurs in the down-wash and up-wash regions when the winglets are placed up-flow and down-flow, respectively. In addition, the radial velocity normal to the wall reaches the peak value in the middle of two adjacent vortexes.
(3) Compared with the down-flow winglets, the vortex induced by the up-flow winglets is hardly declined when the flow moves downstream because of the different turbulence mechanisms. With the same Reynolds number and location, the disturbance intensity of the up-flow winglets is higher than that of the down-flow winglets whose vorticity behind the winglets tends to break into small eddies. As the Reynolds number increases, the phenomenon mentioned above gets more evident, especially when the Reynolds number is greater than 3 000.
[1] KACI H. M., LEMENAND T. and VALLE D. D. et al. Effects of embedded streamwise vorticity on turbulent mixing[J].Chemical Engineering and Processing,2009, 48(10): 1457-1474.
[2] AKCAYOGLU A. Flow past confined delta-wing type vortex generators[J].Experimental Thermal and Fluid Science,2011, 35(1): 112-120.
[3] FERROUILLAT S., TOCHON P. and GARNIER C. et al. Intensification of heat-transfer and mixing in multifunctional heat exchangers by artificially generated streamwise vorticity[J].Applied Thermal Engineering,2006, 26(16): 1820-1829.
[4] TANG Xin-yi, ZHU Dong-sheng and CHEN Hong. Vortical flow and heat transfer characteristics in rectangular channel with trapezoidal tab[J].CIESC Journal,2012, 63(1): 71-83(in Chinese).
[5] KACI H. M., HABCHI C. and LEMENAND T. et al. Flow structure and heat transfer induced by embedded vorticity[J].International Journal of Heat and Mass Transfer,2010, 53(17): 3575-3584.
[6] DONG S., MENG H. Flow past a trapezoidal tab[J].Journal of Fluid Mechanics,2004, 510: 219-242.
[7] TANG Yu-feng, TIAN Mao-cheng and ZHANG Guanmin. PIV experimental research of flow structure in rectangular channel with transversely placed spiral coil insert[J].Journal of Hydrodymics,2012, 24(4): 518-525.
[8] HENZE M., Von WOLFERSDOR J. and WEIGAND B. Flow and heat transfer characteristics behind vortex generators–A benchmark dataset[J].International Journal of Heat and Fluid Flow,2011, 32(1): 318-328.
[9] WAN M. H., BARA B. and HACKMAN L. et al. Hydrodynamics in a gravity setting vessel: CFD modeling with LDA validation[J].The Canadian Journal of Chemical Engineering,2000, 78(6): 1046-1055.
[10] AMINI N., HASSAN Y. A. Measurements of jet flows impinging into a channel containing a rod bundle using dynamic PIV[J].International Journal of Heat and Mass Transfer,2009, 52(23-24): 5479-5495.
[11] TANG Yu-feng. Research on heat transfer enhancement mechanism and heat transfer characteristics of spiral fine ribs in plate channel[D]. Doctoral Thesis, Shandong, China: Shandong University, 2012, 55-57(in Chinese).
[12] OZTURK N. A., AKCAYOGLU A. and SAHIN B. Downstream particle image velocimetry measurements of a circular cylinder-plate junction[J].International Journal of Heat and Fluid Flow,2009, 223(8): 1837-1849.
[13] OZGOREN M., PINAR E. and SAHIN B. Comparison of flow structures in the downstream region of a cylinder and sphere[J].International Journal of Heat and Fluid Flow,2011, 32(6): 1138-1146.
[14] AKCAYOLU A. Flow past confined delta-wing type vortex generators[J].Experimental Thermal and Fluid Science,2011, 35(1): 112-120.
[15] KIRKIL G., CONSTANTINESCU S. G. and ETTEMA R. The horseshoe vortex system around a circular bridge pier on a flat bed[J].XXXIst International Association Hydraulic Research Congress.Seoul, Korea, 2005.
10.1016/S1001-6058(13)60441-2
* Project supported by the Science and Technology Research Projects of Shandong Province (Grant No. 2008GG10007009), the National Key Basic Research Development Program of China (973 Program, Grant No. 2007CB206903).
Biography: CHE Cui-cui (1985-), Female, Ph. D. Candidate
TIAN Mao-cheng,
E-mail: tianmc65@sdu.edu.cn
杂志排行

水动力学研究与进展 B辑的其它文章
- A three-dimensional hydroelasticity theory for ship structures in acoustic field of shallow sea*
- Cavitation bubbles collapse characteristics behind a convex body*
- Experimental study of the interaction between the spark-induced cavitation bubble and the air bubble*
- A preliminary study of the turbulence features of the tidal bore in the Qiantang River, China*
- The calculation of mechanical energy loss for incompressible steady pipe flow of homogeneous fluid*
- Analysis of shear rate effects on drag reduction in turbulent channel flow with superhydrophobic wall*