Construction of Crack Perturbation Model and Forward Semi-analytical Model of Attached Eddy Current Sensor
2015-11-21JiaoShengbo焦胜博ChengLi程礼LiXiaowei李晓微LiPeiyuan李培源GaoJunyu高君宇
Jiao Shengbo(焦胜博),Cheng Li(程礼)*,Li Xiaowei(李晓微),Li Peiyuan(李培源),Gao Junyu(高君宇)
1.Aeronautics and Astronautics Engineering College,Air Eorce Engineering University,Xi′an 710038,P.R.China;
2.School of Software,XiDian University,Xi′an 710038,P.R.China
Construction of Crack Perturbation Model and Forward Semi-analytical Model of Attached Eddy Current Sensor
Jiao Shengbo(焦胜博)1,Cheng Li(程礼)1*,Li Xiaowei(李晓微)2,Li Peiyuan(李培源)1,Gao Junyu(高君宇)1
1.Aeronautics and Astronautics Engineering College,Air Eorce Engineering University,Xi′an 710038,P.R.China;
2.School of Software,XiDian University,Xi′an 710038,P.R.China
Eatigue damage monitoring is critical metallic structure health monitoring of aircraft.The sensor should be high sensitive,easy to be integrated into structure and well adaptable for poor working conditions.Therefore,
attached eddy current sensor;semi-analytical model;crack perturbation model;crack extension experiment
0 Introduction
To detect and avoid structure failure in aircraft beforehand,conventional strategy usually maintains the components according to time schedule instead of considering structure′s situation,which leads to extra labor-cost and maintenance.Condition-based maintenance(CBM)based on structural health monitoring(SHM)has been proposed as a promising method for accurate structure maintenance,instead of traditional schedule maintenance based on various non-destructive technologies(NDT)[1].Aircraft structural damage monitoring combines a variety of advanced theories and methods as well as many different means to obtain the parameters of running state[2].By analyzing the sensor′s signals, we can identify the position and the extent of the damage.Possible consequences such as airplane crash can be determined and predicted.Eventually,final decision is provided for aircraft structural design,calculation and analysis.
The SHM process involves the observation of a system over time using periodically sampled dynamic response measurements from an array of sensors,the extraction of damage-sensitive features from these measurements,and the statistical analysis of these features to determine the current state of the system′s health[3].A variety of sensors based on different mechanisms and technologies have been explored,such as fiber optic sensor,piezoelectric sensor,comparative vacuum sensor and acoustic emission sensor[4-8].However,there are still some problems in engineeringapplication.Eor instance,intelligent coating,due to the accompanying damage,can be flaked or damaged with a long-time component′s vibration. Eddy current sensor,a new branch,has become a focus of the study gradually,thanks to its flexible plane,high reliability and capability of quantitative measurement.Typical eddy current sensors are meandering winding magnetometer(MWM)[9]and eddy current foil sensor(ETES)[10].
Referring to the type ofω-λsensor and research of Goldfine and others[11],we have proposed an attached eddy current sensor with multiple layers and coils.By extracting the material′s conductivity as the crack feature,the forward semi-analytical model is built and optimization is carried out.Then crack perturbation model of attached eddy current sensor is constructed,and perturbation voltages of sensing channels under three-dimension structural crack are obtained.Einally,validation and crack extension experiments are conducted to verify the performance of the sensor.
1 Attached Eddy Current Sensor
The attached eddy current sensor possesses a series of arrayed coils categorized into excitation coils and induction coils and placed at different substrate layers.The simplified schematic diagram of the sensor is shown in Eig.1,where the size of induction coil is S1*L1(W*L)and that of excitation coil is S2*L2(W*L).

Eig.1 Schematic diagram of eddy-current sensor
As the high frequency alternating current flows through the excitation coil,primary magnetic field is produced around the space and eddy current is inducted in the structure.Then the secondary magnetic field is generated by the alternating eddy current field.At last,a stable reflection magnetic field is formed resulted from coupling effects between the primary magnetic field and the secondary one.The process of monitoring is shown in Eig.2,whereλis the distance of adjoining driving coil;Δwindthe thickness of coil;ΔLthe liftoff of distance;g the distance between the driving coil and the adjoining inducing coil;ΔSthe thickness of structure to be tested;and p the width of the driving coil.
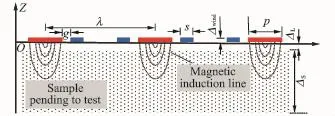
Eig.2 Schematic diagram of monitoring
2 Construction of Semi-analytical Model
Eig.3 shows the physical model of structure damage monitoring,whereΔiis the thickness of layer i;+z the positive direction of z axis;and +r the positive direction of r axis.The cross-sectional SUM consists of two homogenous material layers which are characterized by their properties:permeabilityμ,conductivityσ,and thicknessΔ. The planar boundaries separating each layer are all parallel to one another and the layers extends to infinity in the z direction and r direction.The outermost layers(layer 4 and layer 0)of the structure are assumed to have an infinite thickness such that there is no interaction between the system which consists of the coils,SUM,and the surroundings.The system is excited by the winding at interface 4,and these windings are assumed to be infinitely thin in the z direction,such that the currents can be modeled as surface currents which flow in theφ(angle coordinate)direction only.
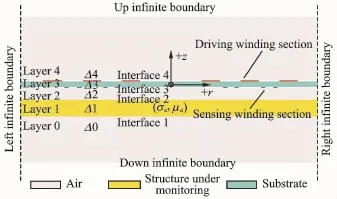
Eig.3 Physical model for structural damage monitoring
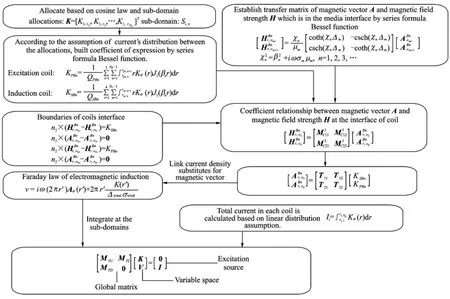
In this section modeling process is provided briefly,which is shown in Eig.4.Some of the specific modeling process was detailed in Ref.[10].Table 1 shows the meaning of each parameter in Eig.4.Due to high frequency stimulation(1—10 MHz)and existence of skin effect,the current distribution of coils is unknown,which means that the traditional eddy current theoretical method based on vector potential A or second order vector potential(SOVP)is inapplicable to the modeling of planar circular coils with high frequency stimulation[12-14].

Table 1 Parameter in Fig.4
Referenced from weighted residuals method on solving partial differential equations,the linearcurrent density at winding interface is set as unknown function.Discrete point and subdomain is collocated at winding interface,and the trial function is obtained via Elourier-Bessel series. According to the relation between linear current density and vector potential at winding interface deduced from time-harmonic form of diffusion equation,differential equation containing linear current density at discrete points is gained based on Earaday′s law.Applying weighted residuals method to differential equation,linear current densities at discrete points are calculated and trans-impedance of attached eddy current sensor is obtained finally.The construction routine of attached eddy current sensor is illustrated briefly in Eig.4.
3 Construction of Perturbation Model
Assume the structural crack damage does not change the electromagnetic parameters of the structure;in fact,under the action of accumulative damages of the monitored structure,the electromagnetic property of the structure,such as the conductivity or magnetic conductivity of ferromagnetic materials will change slightly.However,compared with the influence of the accumulated free charges caused by the crack on the transimpedance output of the sensor,the influence caused by the slight change in the electromagnetic property of these materials can be ignored.
Since there is air shed in the cracks,the discontinuous boundary conditions at the cracks of the structure will cause discontinuous change of the structural eddy current field on the crack surface and free charges will accumulate on the crack surface.Define an infinitesimal of free charges withρfsquantity on the crack surface,i.e.,the free charge density isρfs,according to the divergence theorem of electric current density.Under harmonic stimulation and considering that the eddy current field in the crack is 0,there is
Eig.4 Construction routine of semi-analytic model
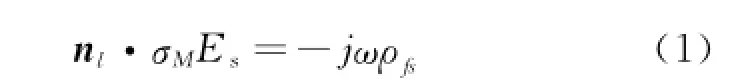
where nlis the unit normal vector from the infinitesimal to the conductive areas in the structure;j the electric quantity passing the area contained by the infinitesimal in unit time;σMthe conductivity of the structure;ωthe stimulation frequency of the field source;Esthe electric field on the surface of the infinitesimal.In the perturbation model,it is important to obtain the distribution of free charges density from Eq.(1).By referencing numerical analysis method,divide grids on the surface of three-dimensional crack,and define the free charge density at the central point of the grid as unknown coefficient to be determined.Taking cuboid crack on the surface as an example,the diagram for dividing the surface grid is shown in Eig.5.
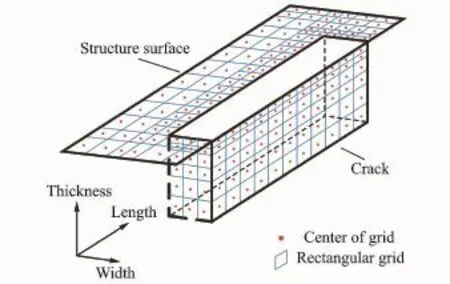
Eig.5 Planar grid mesh of surface notch crack
In Eig.5,grid division is carried out on the crack surface by multiple gridding rectangular elements,i.e.,divide the surface with large free charge density by fine mesh,and divide the surface with small free charge density by coarse mesh.As is known from the skin effect of eddy,the closer the distance from the structured surface is,the stronger the eddy will be,i.e.,the density of the accumulated free charges will be larger,and the crack surface which is closer to the structured surface will be divided by a refined mesh unit.
Consider the i th grid cell.The free charge density at the central point of cell i isρi,the size of the grid isΔx×Δy,when the grid cell is small enough,the total amount of free charges in cell iwill beΔx×Δy×ρi,then the perturbation electric field generated by cell i at any point a in the system space is
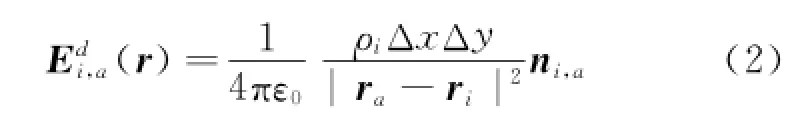
where ni,ais the cell vector from the central point of cell i to any point a in the space;rathe distance vector of a point;rithe distance vector of i cell.
Eor the central point of cell i,according to the free charge boundary conditions defined in Eq.(1)and perturbation model assumption,there is

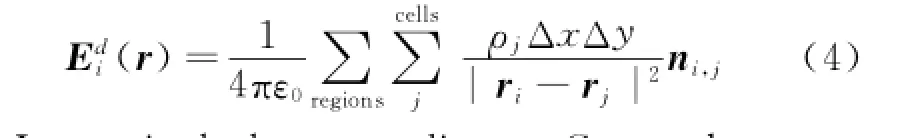

In particularly,according to Gauss theorem,the perturbation electric field of the free charges in cell i against its central point is bation electric field of coplanar cell j at the central point of cell i is 0.According to Eq.(2),the perturbation electric field generated by the free charges in non-coplanar grid cell j at the central point of cell i is
Substitute Eqs.(4,5)into Eq.(3)to obtain
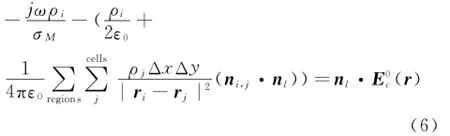
Build constraint equations for all the central points of the grid cell as Eq.(6)to obtain set of linear equations for the free charge density at the central point of the grid cell

whereρis the vector of the free charge density at the central point of the grid cell;E0the vector of the initial electric field at the central point of the grid cell;M coefficient matrix.Meanwhile,according to law of conservation of charge,there is

Since the distribution of initial electric field is known,solving the theory and Eqs.(7,8)according to the set of linear equations can obtain the densities of all the free charges at the central point of the grid cell.
Perturbation current includes two parts:The perturbation current generated by accumulated free charges in the space of the surround volume of the crack,and the perturbation current caused by the disappearance of the initial eddy current field in the space of internal volume of the crack. Similar to grid division of the three-dimensional crack surface,the diagram of grid division for perturbation current is shown in Eig.6.
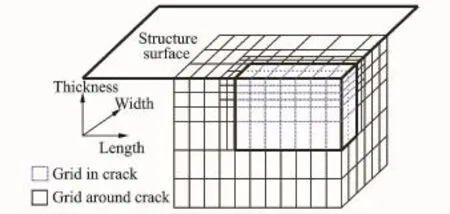
Eig.6 Volume grid mesh of perturbation current
In Eig.6,multiple grids are adopted to divide the volume grid cell for the structures inside and surrounding the crack.
According to Earaday′s law of electromagnetic sensing,integral on the sensing winding loop,the expression of the perturbation voltage of the sensing winding can be obtained
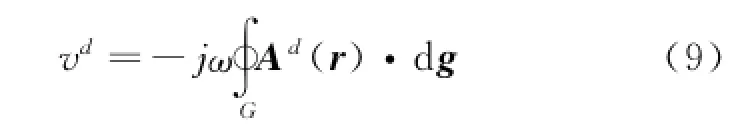

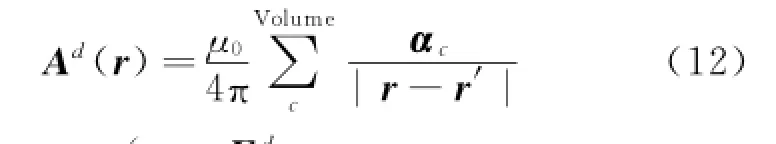
where Ad(r)is the perturbation magnetic vector;G the curvilinear integral path on the sensing winding;r the vector of linear infinitesimal volume.Inside the conductor structure,the perturbation magnetic field caused by perturbation current is the volume integral of the perturbation current inside the infinitesimal volumewhere r′is the vector of infinitesimal volume;the perturbation current.Perturbation currentincludes two parts:The perturbation currentenerated by accumulated free charges in the space of the surround volume of the crack,and the perturbation currentcaused by the disappearance of the initial eddy current field in the space of internal volume of the crack

So far,the perturbation model has been built.It needs to pay attention to that applying the semi-analytical model in this paper has its limited conditions,i.e.,the sensor perturbation model cannot be applied to calculating the perturbation voltage of the sensors for magnetic structures,otherwise there will be large calculation errors.This is because the surface crack in magnetic structure will cause the discontinuity of magnetic sensing intensity on the crack surface,which will generate perturbing magnetizing current.The perturbation model does not consider the influence of perturbing magnetizing current on the signal of perturbation output voltage of the sensor.
4 Structure Parameter OPtimization
In the process of monitoring,the liftoff,the distance between the sensor and the structure,has a marked effect on the optimal working fre-
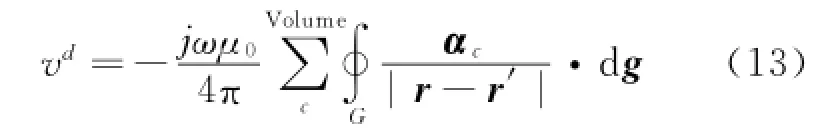
where Vcis the voltage of the volume grid.Substitute Eq.(12)into Eq.(9)to obtain the numerical expression of the perturbation voltage of the sensing winding quency of sensor,which determines distribution of the magnetic field and eddy current field.
Eig.7 shows the effect of liftoff on optimal frequency as the measured material is 2A12-T4 aluminum alloy.
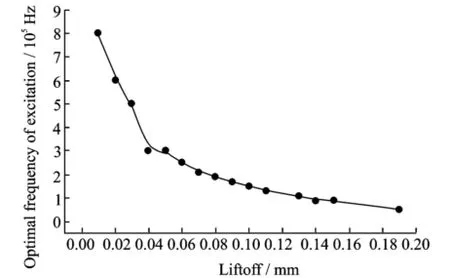
Eig.7 Change of optimal frequency with liftoff
In Eig.7,the sensor′s optimal operating frequency decreases as the liftoff grows larger,and goes toward the horizontal limit as the distance is larger than 0.18 mm.
Considering the sensor′s working condition,i.e.the attachment method,the liftoff distance is generally between 0.005 and 0.2 mm,so the range of the sensor′s optimal excitation current frequency is from 0.2 to 1 M Hz.
In addition,the thickness of the coil wire also affects the distribution of the current density,as well as the distributions of the magnetic field and eddy current field.The thickness of the sensor′s excitation and induction coil are set up as 0.25,0.5,1,2,and 4 times the benchmark. Eigs.8,9 show the sensitivity change of first induction coil with excitation signal frequency under the condition that the lifetoff distances are 0.05 and 0.15 mm.
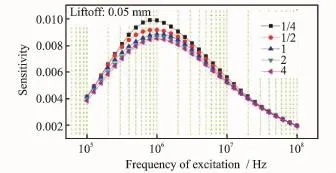
Eig.8 Effect of wire thickness on sensitivity(liftoff:0.05 mm)

Eig.9 Effect of wire thickness on sensitivity(liftoff:0.15 mm)
In Eigs.8,9,there is an optimal sensitivity under a certain thickness.The optimal sensitivity becomes larger as the thickness of wire gets smaller.Meanwhile,there was nearly no difference in sensitivity of the sensor between 2 and 4 times of the wire thickness.In other words,the sensitivity of the conductivity will not be reduced with the increase the wire thickness as the thickness is large enough.
5 SPatial Distributions of Eddy Current Field and Magnetic Field
According to the semi-analytical model,the distribution in the surrounding medium space of magnetic field and eddy current filed is explored at different excitation frequencies.This leads to a further understanding of the output characteristics of the electromagnetic field.Since the amount of calculation is large,the number of the induction coils in simulation will be reduced to two channels.
In order to obtain the instantaneous distribution,the analysis is processed from two aspects separately:Real part and imaginary part.That means to analyze the form of field distribution at the points ofωt=0 andωt=π/2 in a harmonic period.(K=sin(ωt+φ),ωt=0,that is corresponding to the imaginary part of the complex parameter;ωt=π/2,that is corresponding to the real part of the complex parameter).The contour map of the eddy current field distribution in case ofωt=0 andωt=π/2 under the excitation frequency 1 MHz is shown,in Eigs.10,11 respectively.The vertical axis depth 0 corresponds to the structure surface of 2A12-T4 aluminum alloy structure.
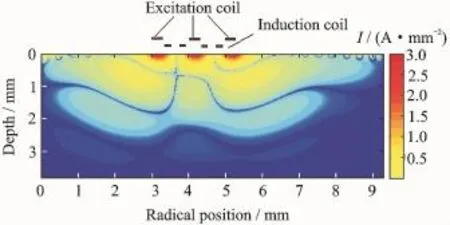
Eig.10 Eddy current field distribution in the monitored structure(ωt=0,f=1 M Hz)
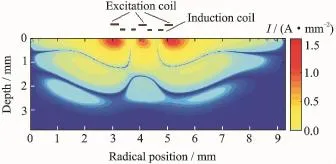
Eig.11 Eddy current field distribution in the monitored structure(ωt=π/2,f=1 MHz)
Eigs.10,11 show the eddy current field is concentrated beneath the sensor,and there are three vortex wave sources formed by excitation coils in the monitored structure.The three vortex wave sources diffuse and attenuate in the form of waves towards the inner and the edge of the structure.Meanwhile,due to the opposite direction of the excitation current among the excitation coils,there exist the zero points in the eddy current field,which it shown as the boundaries among the wave sources.
The contour map of magnetic induction strength distribution is shown in Eigs.12—15 as the eddy current sensor is attached to the 2A12-T4 aluminum alloy surface.
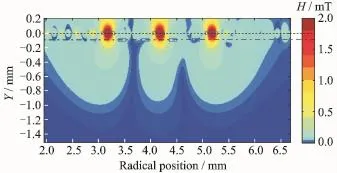
Eig.12 Distribution of space magnetic induction strength(ωt=0,f=1 MHz)
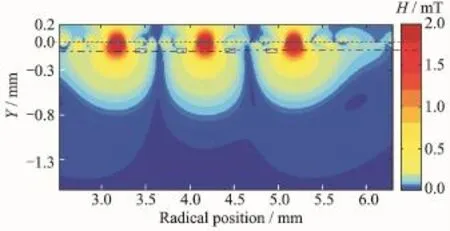
Eig.13 Distribution of space magnetic induction strength(ωt=π/2,f=1 MHz)
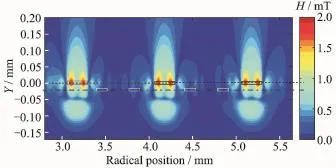
Eig.14 Distribution of space magnetic induction(ωt= 0,f=10 MHz)

Eig.15 Distribution of space magnetic induction(ωt= π/2,f=10 M Hz)
Similarly,there are also three field sources which diffuse and attenuate in the form of waves towards the space.The skin effect in the distribution of coil current density is more obvious at the frequency of 10 M Hz,so the excitation source is concentrated around the two edges of the coil,which means each excitation coil contains two excitation points.There is a big difference of magnetic induction intensity betweenωt=0 andωt= π/2 at the frequency of 10 MHz.These results from the fact that at the frequency of 10 M Hz, the eddy current field intensity is very large,thus the magnetic field has a great effect on the spatial distribution of the excitation source magnetic field.Atωt=0,the excitation source magnetic field is weakened by the magnetic field generated by eddy current,while atωt=π/2,the excitation source magnetic field is amplified.
6 Validations and Crack Extension ExPeriment
This section builds experimental platform to carry out crack growth simulation to validate the accuracy of the perturbation model.The contact way between three-dimensional displacement platform as well as the sensor and the test specimens is shown in Eig.16.

Eig.16 Three-dimensional displacement platform
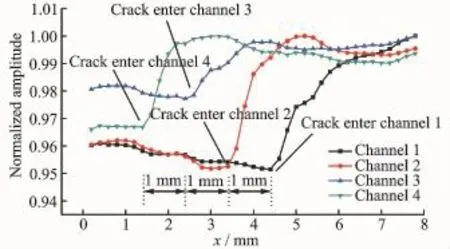
Eig.17 Normalized sensing voltage varying displacement of sensor
In Eig.16,when the crack front enters a certain sensing winding channel,the corresponding sensing voltage in corresponding sensing channel will rise first and then tend to be stable.The inflection points where the sensing voltage curves of the four sensing channels start to rise are marked by arrows in Eig.17,with the spacing between two adjacent inflection points of 1 mm;the de-signed wavelengthλof the sensor is 1 mm.The experimental result validates the monitoring principle of attached eddy current sensor.Meanwhile,Eig.17 also shows that the perturbation function of the crack on each sensing winding lies in the rise of the sensing voltage of each channel,which validates the accuracy of the perturbation model built in this paper.The percentage of the perturbation rise of the sensing channel voltage is
whereΔV is the perturbation value of the crack on the sensing channel voltage and V0the sensing channel voltage without crack.Taking 2 A12-T4 test specimen as an example,Eig.18 is the comparison curve results between the model and the experiment of the rising percentageδof the voltage perturbation of the four sensing channels caused by the crack under 3 M Hz stimulation frequency.

Eig.18 Comparison between model and experiment
Eig.18 shows the stimulation frequencies 3 M Hz,the calculation results and experimental measurement results of perturbation models of 2 A12-T4 aluminum alloy agree relatively well;the calculation errors of the perturbation models of the four sensing channels of the sensor are all within 25%.
The attached eddy current sensor with four induction channels is manufactured using the technology of flexible printed circuit board(EPCB)[15],as shown in Eig.19.
To measuring the crack extension quantitatively,experiment on crack extension is carried out using material testing system Landmark 510,as shown in Eig.20.
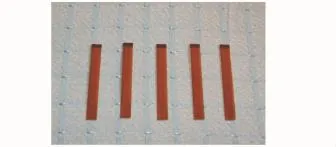
Eig.19 Attached eddy current sensor
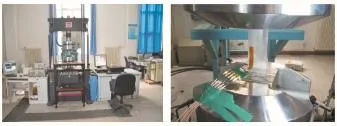
Eig.20 Material testing system Landmark 510
The excitation frequency is set as 1 M Hz,and the temperature is kept at 20℃.The signal is collected until the specimen break down.The signals are shown in Eig.21.
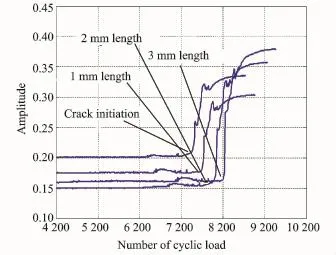
Eig.21 Signal of four induction channels
The signals stable in the initial stage indicates that the structure is integrated.As the cyclic load keeps growing,crack initiates and extends.The sensor has monitored the change of the structure and signals increases one by one.At last the specimen breaks down,and the signals keep stable at a high level.
7 Conclusions
An attached eddy current sensor characterized by array induction coils,capability of nonde-structive testing and quantitative measuring on crack extension is proposed.
The semi-analytical model of monitoring is built through extracting material conductivity as the crack feature.
Based on the perturbation current generated by accumulated free charges in the space of the surround volume of the crack and the perturbation current caused by the disappearance of the initial eddy current field in the space of internal volume of the crack,the perturbation voltage of the sensing winding of the sensor is obtained by Earaday′s law of electromagnetic induction,and semianalytical crack perturbation model of attached eddy current sensor is constructed finally.
The performance of sensor is verified through calibration test and crack extension experiment.The accuracy reaches 1 mm.
Acknowledgement
This work was supported by the National Natural Science Eoundation of China(No.51175509).
[1] Halbert K,Eitzwater L,Torng T,et al.Air vehicle integration and technology research(Aviatr)[R]. Task Order 0003.USA:Condition-Based Maintenance Plus Structure,Boeing Company,2013.
[2] Yuan S E.Structural health monitoring and damage control[M].Beijing:National Defense Industry Press,2007.
[3] Speckmann H,Roesner H.Structural health monitoring:A contribution to the intelligent aircraft structure[C]∥9th European NDT Conference.Berlin,Germany:ECNDT,2006:1-7.
[4] Hong L G,Gao Z X,Mrad N.Eiber optic sensors for structure health monitoring of air platforms[J]. Sensors,2011,11(4):3687-3705.
[5] Roach D.Real time crack detection using mountable comparative vacuum monitoring sensors[J].Smart Structures and Systems,2009,5(4):317-328.
[6] Prevorovsky Z.Nonlinear ultrasonic spectroscopy and acoustic emission in SHM of aircrafts[C]∥18 th World Conference on Nondestructive Testing.Durban,South Africa:[s.n.],2012.
[7] Liu M B,Gao Q,Hu E.Elaw-detected coating and its application[C]∥International Conference on Health Monitoring of Structure.Nanjing,China:[s. n.],2007.
[8] Giurgiutir V,Santoni-Bottai G,Lin B,et al.Space application of piezoelectric wafer active sensors for structural health monitoring[J].Journal of Intelligent Material Systems and Structures,2011,22:1359-1370.
[9] Russell R,Jablonski D,Washabaugh A,et al.Development of meandering winding agnetometer(MWM)eddy current sensors for the health monitoring,odeling and damage detection of high temperature composite materials[C]∥32nd HIGH TEMPLE Workshop.Palm Springs,USA:KSCET,2012.
[10]Speckmann H.Structure health monitoring[C]∥IMRBPB Meeting.Cologne,Germany:EASA,2007.
[11]Sheiretov Y.Deep penetration magnetoquasistatic sensors[D].Cambridge,MA,USA:Massachusetts Institute of Technology,2001.
[12]Dodd C V,Deeds W E,Analytical solutions to eddycurrent probe-coil problems[J].Applied Physics,1968,39:2829-2838.
[13]Theodoulidis T P,Kriezis E E.Impedance evaluation of rectangular coils for eddy current testing of plannar media[J].NDT&E International,2002,35(6):407-414.
[14]Eava J O,Ruch M C.Calculation and simulation of impedance diagrams of planar rectangular spiral coils for eddy current testing[J].NDT&E International,2006,39(5):414-424.
[15]Yoon Jesong Won,Jang Jin-Kyu,Choi Jung-Hyun,et al.Thermo-compression bonding of electrodes between EPCB and RPCB[J].Journal of Materials Science Materials in Electronics,2012,23(1):41-47.
(Executive editor:Zhang Bei)
TP212.1;V215.6 Document code:A Article ID:1005-1120(2015)03-0279-10
*CorresPonding author:Cheng Li,Professor,E-mail:cheng-qiaochu@foxmail.com.
How to cite this article:Jiao Shengbo,Cheng Li,Li Xiaowei,et al.Construction of crack perturbation model and forward semi-analytical model of attached eddy current sensor[J].Trans.Nanjing U.Aero.Astro.,2015,32(3):279-288.
http://dx.doi.org/10.16356/j.1005-1120.2015.03.279
(Received 17 December 2014;revised 8 April 2015;accepted 25 April 2015)
an attached eddy current sensor with flexible plane is put forward and its characteristics are analyzed.By extracting material′s conductivity as the crack features,forward semi-analytical model is established and parameter optimizations are carried out.Crack perturbation model of attached eddy current sensor is constructed,and perturbation voltages of sensing channels under three-dimension structural crack are obtained.To verify the sensor′s performance,monitoring experiment on crack extension is conducted under condition of 3 M Hz frequency.The validation experimental results show that perturbation model of 2A12-T4 aluminum alloy agrees well with experiment results,and perturbation model errors of four sensing channels are within 25%.The attached eddy current sensor is capable of testing the crack nondestructively and measuring the crack extension quantitatively with the accuracy of 1 mm.
猜你喜欢
杂志排行

Transactions of Nanjing University of Aeronautics and Astronautics的其它文章
- Two-Dimensional Modal Curvature for Damage Detection in Plates
- Performance ImProvement Method of CFRP with Embedded OPtical Fiber
- MorPhological Undecimated Wavelet DecomPosition Fusion Algorithm and Its APPlication on Fault Feature Extraction of Hydraulic PumP
- Resistance SPot Welding Method for Metal-Based Fiber Bragg Grating Sensors
- RelationshiP Between Corrosion Level of Steel Bar and Diameter of Corroded Sensing Steel Wire in Wireless Sensor
- Data Fusion of MultiPle Curvature Mode ShaPes for Structural Damage Diagnosis