Aircraft Observation and Simulation of the Supercooled Liquid Water Layer in a Warm Conveyor Belt over North China
2024-03-26JiefanYANGFeiYANHengchiLEIShuoJIAXiaoboDONGandXiangfengHU
Jiefan YANG ,Fei YAN ,Hengchi LEI ,Shuo JIA ,Xiaobo DONG ,and Xiangfeng HU
1Key Laboratory of Cloud Physics and Severe Storms, Institute of Atmospheric Physics,Chinese Academy of Sciences, Beijing 100029, China
2Weather modification office of Hebei Province, Hebei Meteorology Administration, Shijiazhuang 050000, China
ABSTRACT This paper studied a snow event over North China on 21 February 2017,using aircraft in-situ data,a Lagrangian analysis tool,and WRF simulations with different microphysical schemes to investigate the supercooled layer of warm conveyor belts (WCBs).Based on the aircraft data,we found a fine vertical structure within clouds in the WCB and highlighted a 1-2 km thin supercooled liquid water layer with a maximum Liquid Water Content (LWC) exceeding 0.5 g kg–1 during the vertical aircraft observation.Although the main features of thermodynamic profiles were essentially captured by both modeling schemes,the microphysical quantities exhibited large diversity with different microphysics schemes.The conventional Morrison two-moment scheme showed remarkable agreement with in-situ observations,both in terms of the thermodynamic structure and the supercooled liquid water layer.However,the microphysical structure of the WCB clouds,in terms of LWC and IWC,was not apparent in HUJI fast bin scheme.To reduce such uncertainty,future work may focus on improving the representation of microphysics in bin schemes with in-situ data and using similar assumptions for all schemes to isolate the impact of physics.
Key words: warm conveyor belt,Microphysical properties,supercooled liquid water,microphysics schemes
1.Introduction
The extratropical cyclone is the primary synoptic-scale pattern associated with precipitation in mid-latitudes and is responsible for over 80% of total precipitation in the Northern Hemisphere (Hawcroft et al.,2012).During the last few decades,quasi-Lagrangian analyses have revealed the distinct characteristics of three airstreams within mid-latitude baroclinic storms,including the dry intrusion,cold conveyor belt,and warm conveyor belt (WCB) (Browning et al.,1973;Dacre et al.,2019).The WCB is a coherent warm and moist airstream that rises from the boundary layer to the upper troposphere within two days,typically decreasing in temperature from above 0°C to below–40°C.This results in clouds near WCBs undergoing several phases,including warm,mixed,and pure ice,which produces a complex microphysical structure.WCBs are responsible for around 70% of all extreme precipitation,and cloud processes can significantly impact their behavior,as summarized in Pfahl et al.(2014).
Recently,dual-polarization Doppler radars have been used to analyze the fine structure of clouds created by WCBs.For example,Keppas et al.(2018) examined dualpolarization radar data and in-situ observations of cloud microphysics,demonstrating that a WCB generated a significant layer of liquid water,which promoted accretion and secondary ice production and produced a vast mix-phase cloud.At the International Collaborative Experiments for Pyeongchang 2018 Olympic and Paralympic Winter Games (ICEPOP2018),Gehring et al.(2020) used dual-polarization radar measurements to discover supercooled liquid water(SLW) >0.2 g kg–1during a WCB's rapid ascent.They further claimed that the SLW produced in the WCB caused strong riming,and the embedded updraft and turbulence at the lower limit of the WCB boosted aggregation by raising the likelihood of ice particle collisions.Further observational studies (Krämer et al.,2016;Voigt et al.,2017) also showed how WCB cirrus differs from other varieties in terms of its microphysical characteristics.
However,due to their deep motion accompanied by cloud processes and large temperature diversity,WCBs are still one of the most challenging phenomena for Numerical Weather Prediction (NWP).Joos and Wernli (2012) were the first to study the influence of different microphysical processes on dynamic structures of WCBs,suggesting that snow and ice deposition are the most important diabatic heating processes.Schäfler et al.(2011) revealed significant deficiencies in the model's representation of low-level moisture in the WCB inflow region.Although WCBs provide ideal conditions for rapid precipitation growth,such as riming and aggregation,due to the formation of supercooled liquid water in the ascending air masses,most of the knowledge about WCBs is based on reanalysis data,with only a few observational studies available.
It is believed that the supercooled liquid water layer in the WCB plays a significant role in promoting the growth of ice particles via riming,aggregation,and the Bergeron process,which in turn promote the surface precipitation.On the other hand,due to the high supercooled water content,WCBs also provide stable conditions for cloud seeding,and some field experiments have captured the physical response of cloud properties by seeding with silver iodide,AgI(Tessendorf et al.,2019).The presence of a supercooled liquid water layer within WCBs presents unique challenges due to its ability to enhance snowfall rates and the potential to support conditions prone to aircraft icing.Accurately representing the microphysical processes within this layer is crucial for improving the prediction of snowfall intensity and associated hazards.Thus,in this study,we use in-situ observation data from the Rainfall Enhancement Experiment along the Eastern Side of the Taihang Mountain project to investigate a snowfall event associated with a WCB over North China on 21 February 2017,with a focus on the unique layer with supercooled liquid water.The Weather Research and Forecasting model (WRF) with different microphysical schemes was utilized to simulate the vertical and horizontal distribution of microphysical structures within the cloud.We hope this study will be helpful to elucidate the microphysical processes within WCB and,to some extent,improve the representation of the microphysical schemes in a mesoscale model.
The remainder of this paper is structured as follows.We first introduce the field campaign,datasets,and the configuration of the WRF model in section 2.The synoptic overview,identification of the WCB,the vertical thermodynamic properties as well as the cloud structure are presented in sections 3–5,respectively.Then,an analysis of the microphysics and a comparison between model results and insitu observations during periods of interest is presented in section 6.
2.Measurement campaign and model configuration
During the years 2017–19,the Rainfall Enhancement Experiment along the Eastern Side of Taihang Mountain project was conducted in North China,and the data used in this study were obtained during this project.The aim of the project was to comprehensively investigate the fine structure of clouds in North China and establish a concept model for cloud seeding.Several papers have analyzed the data from this project in recent years,including studies on radar retrieval of cloud microphysics,aerosol-cloud interaction(Yang et al.,2019),effects of topography on severe storms with heavy precipitation,improvements of microphysical schemes using in-situ data (Guo et al.,2019;Lei et al.,2020),and cloud seeding effects on convective cloud under variable wind shear conditions (Yang and Lei,2022).However,most of these studies have primarily focused on shallow convective clouds or precipitation cores within mesoscale weather systems.On 21 June 2017,a Kingair-350 aircraft conducted vertical spiral and horizontal measurements from 0800 to 1100 UTC to examine the microphysical properties of a snowfall event.The aircraft took off from Sijiazhuang airport specifically for this purpose.The goal of the measurements was to determine the microphysical structures of the cloud.
2.1.Aircraft in-situ instruments
During this project,cloud properties were collected using the Airborne atmospheric measurements King-Air 350 platform,which was equipped with several microphysical probes.These probes provided measurements of a wide range of hydrometeors spectra as well as bulk ice or liquid parameters,such as LWC (liquid water content) and IWC(ice water content),as described in the papers mentioned in section 2.The key instrumentation used included a Mie-scattering FCDP-100 (Fast Cloud Droplet Probe model 100,SPEC inc),a CIP (cloud imager probe,DMT inc) and HVPS-3 (high volume particles spectrometer.SPEC inc),a CPI (cloud particle imager,SPEC inc),an AIMMS-20 to obtain ambient wind speed,relative humidity,and temperature,and a Nevrozov Total Water Content probe.It is noteworthy that the 2D imager (CIP) used in this study had a sharpened probe front end and the raw data from 2D images were processed using an ITA (Interarrival Time Threshold Algorithm) to remove artifacts due to the shattering of large particles on the probes (Field et al.,2006).The specifications of the airborne instruments used in this study are summarized in Table 1.
Table 1.Airborne instrumentations and their specifications.
2.2.WRF model configuration
To clarify the fine structure of microphysics and study the evolution of the cloud structure,we employed the WRF model 4.4.1 for all experiments.The model was initialized with 0.25° × 0.25° ERA5 reanalysis data,with a grid spacing of 9 km and 3 km,to better resolve the microphysical processes.The simulation area was divided into two nested domains,with grid points of 186 (lat)× 186 (lon) and 292(lat) × 283 (lon).The inner domain covered the region where in-situ observations were conducted,and the model was warm-started before conducting the experiments.
Except for cloud microphysics,the two domains have the same parameterizations which include the Rapid Radiative Transfer Model for longwave radiation,the Dudhia scheme for shortwave radiation.The Yonsei University Planetary Boundary scheme,and the Grell-Fraitas cumulus scheme are only applied in the outer domain.In cloud modeling,the parameterization of ice microphysics is essential for the accurate simulation of quantitative precipitation forecasts and the microphysical–dynamic interaction.Therefore,different microphysics schemes can result in variable representations of cloud properties,such as cloud droplet size distribution,ice water content,and precipitation formation.Using various microphysics schemes to study the WCB can help identify the impact of microphysics parameterizations on cloud structure of WCB and determine which scheme is more suitable for simulations.Thus,in this study,we selected four completely different microphysical schemes (Table 2) to compute the vertical and horizontal composites of the WCB,including the conventional two-moment parameterization scheme (Morrison two-moment,MORR),P3 scheme Morrison and Milbrandt (2015),fast bin scheme (HUJI Fast Bin,FB) (Khain et al.,2010),and a newly developed triple-moment six class bulk scheme (Tsai and Chen,2020) which is provided by NTU.
Table 2.Brief description of the four microphysics schemes used in this simulation
The NTU scheme is a bulk parameterization scheme that follows the conventional triple-moment approach.However,it employs a more suitable treatment of ice-phase processes to account for the variations in the shape and density of different hydrometeors.In contrast to other schemes,the NTU scheme redefines snow as snow aggregate to avoid the artificial conversion of cloud ice to snow.For the P3 scheme,although it also predicts changes in ice particle shape during riming,it does not provide a detailed treatment of aggregation,as noted by Tsai and Chen (2020).Meanwhile,the fast bin scheme predicts the evolution of particle spectra explicitly,without making any assumptions.As such,it has demonstrated some superiority over bulk methods in many aspects of cloud simulations (Yin et al.,2017).Table 2 summarizes some of the key specifications and features of each scheme.
3.Synoptic overview
The most intense snowstorm event of 2017 in North China occurred on 21–22 February.During this time,aclosed low-pressure system known as the southwest vortex formed at 850 hPa in Sichuan and Guizhou provinces in southwest China (Fig.1).The system moved eastward and created multiple frontal zones.The warm frontal zone extended from the low-pressure center to Jiangsu and Anhui provinces.At the same time,a deep trough at 500 hPa generated strong southwesterly winds ahead of it,which facilitated water vapor transport.The integrated vapor transport (IVT)(Rutz et al.,2014) contours at 0000 UTC revealed the presence of a strong moisture flux with a maximum value exceeding 400 kg (m s)–1extending from the warm sector to ahead of the warm front.The most intense snowfall (>3 mm h–1water equivalent snowfall) occurred to the north of the warm front.By 1200 UTC,the deep trough and strong vapor transport band had moved further eastward,causing the intense snowfall area to shift from Shaanxi and Shanxi to Shandong and Hebei provinces.
4.Identification of the warm conveyor belt
The large-scale WCB ascent can be defined as a coherent ensemble of trajectories with an ascent rate of at least 600 hPa within 48 hours,from a Lagrangian perspective(Madonna et al.,2014).In this study,48-hour backward trajectories from 0800 UTC on 21 February to 0800 UTC on 19 February were computed using the Lagrangian analysis tool LAGRANTO (Sprenger and Wernli,2015),based on 6-hourly 3D wind field,pressure,liquid water content,and snow ice water content of the 1° × 1° reanalysis data from ECMWF (ERA5).To examine the air parcel transits near the aircraft observation location,a large rectangular area covering North China was selected as the terminal of the trajectories.Eventually,a total of 48 trajectories were identified as the WCB.Figure 2 displays the ensemble of trajectories that form part of the large-scale WCB air stream,ascending from near Hebei between 0000 to 0300 UTC on 21 February 2017.The inflow part of the WCB,where the upstream with strong ascent is characterized by IVT greater than 400 kg(m s)–1,indicates that this WCB transported a large amount of water vapor from South China.As a result of condensation processes,the cloud liquid water content along the trajectories exhibits a peak value (>0.4 g kg–1) in the region with strong ascent (Fig.2) in Sichuan province.After crossing the warm front,the WCB shifts eastward due to its merger with the jet stream in the upper troposphere,and the LWC is gradually depleted by snowfall along the trajectory.As the WCB ascends from the boundary layer to the upper troposphere,an extensive stratiform cloud band forms,responsible for the surface snowfall.
Fig.1.850-hPa geopotential height (grey contours),IVT [red contours,labels in kg (m s)–1,only values greater than 250 kg (m s)–1 are shown],and water equivalent snowfall in mm h–1 (color filled) at (a) 0000 UTC and (b) 1200 UTC on 21 February 2017 from ERA5.

Fig.2.WCB trajectories with an ascent rate of at least 600 hPa in 48 hours near the location where the aircraft observation was performed at 0000 UTC on 21 February 2017.Colors indicated (a) the pressure level and (b) the LWC (g kg–1) along the WCB air parcels.The red star shows the location where the aircraft observation was performed.
Fig.3.24-h cumulative rainfall (mm) from four microphysics schemes in the inner domain: (a) conventional Morrison two moment,(b) P3,(c) HUJI Fast bin,and (d) NTU.
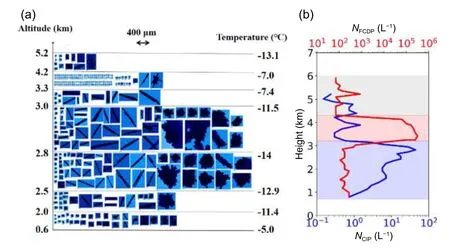
Fig.4.2D images and number concentration of cloud particles obtained during the vertical observation,(a) CPI images and (b) number concentrations of cloud droplets (NFCDP,red solid line)and ice particles (NCIP>100μm,blue solid line).
Although different ice microphysics schemes with different terminal velocity often produce different snow distribution as well as the snowfall intensity.This was not the case in this study.The 24-hour precipitation simulation using four microphysics schemes shows no significant difference in the distribution area and intensity of precipitation(Fig.3).The region with precipitation exceeding 8 mm is typically situated in the southern part of Hebei Province and western Shandong Province,while the observed 24-hour precipitation in the area was usually less than 5 mm.The P3 and Morrison schemes exhibit similar simulated precipitation,while the HUJI fast bin scheme had some scattered precipitation cores.Overall,the NTU scheme was comparable to the MORR and P3 schemes,with a slightly smaller area of precipitation.
5.Features of vertical Microphysical and thermodynamic structure
Currently,there is limited in-situ observation of the fine vertical structure of the supercooled water layer.However,Keppas et al.(2018) estimated the thickness of a supercooled water layer using X-band dual-polarization radar data in the eastern UK to be approximately 1 km thick between a height of 2.5 km to 3.5 km,with the LWC in the WCB of up to 0.2 g kg–1.Numerous researchers have proposed conceptual models based on radar and limited in-situ data to depict the fine structure of a WCB’s microphysical processes,particularly in terms of the distribution of ice and snow crystal morphology in the vertical direction.
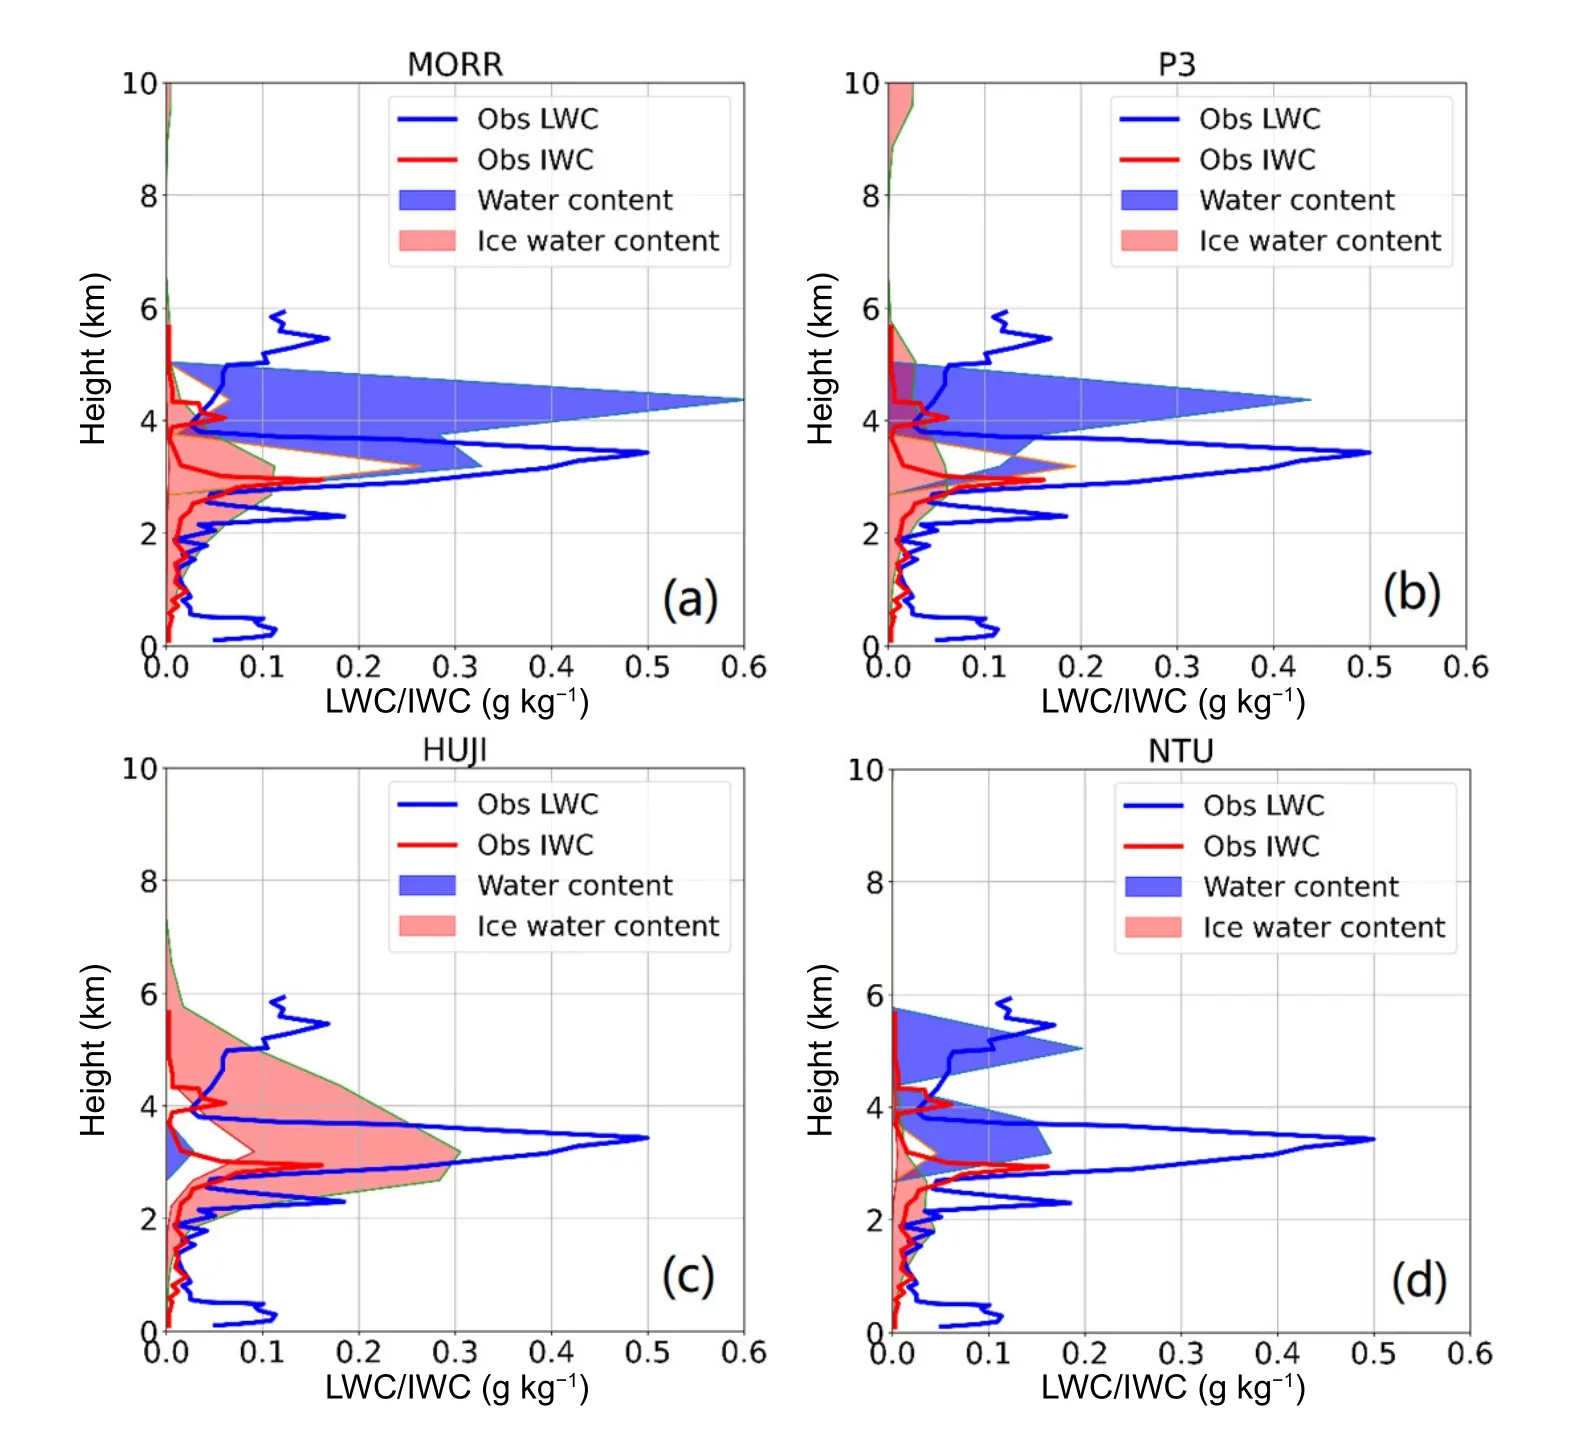
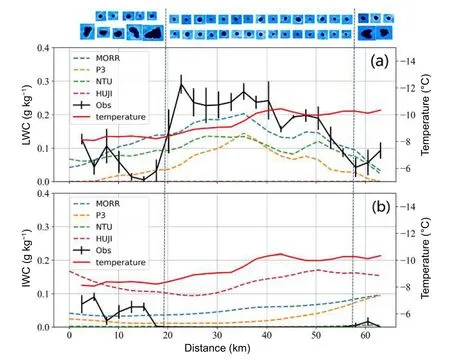
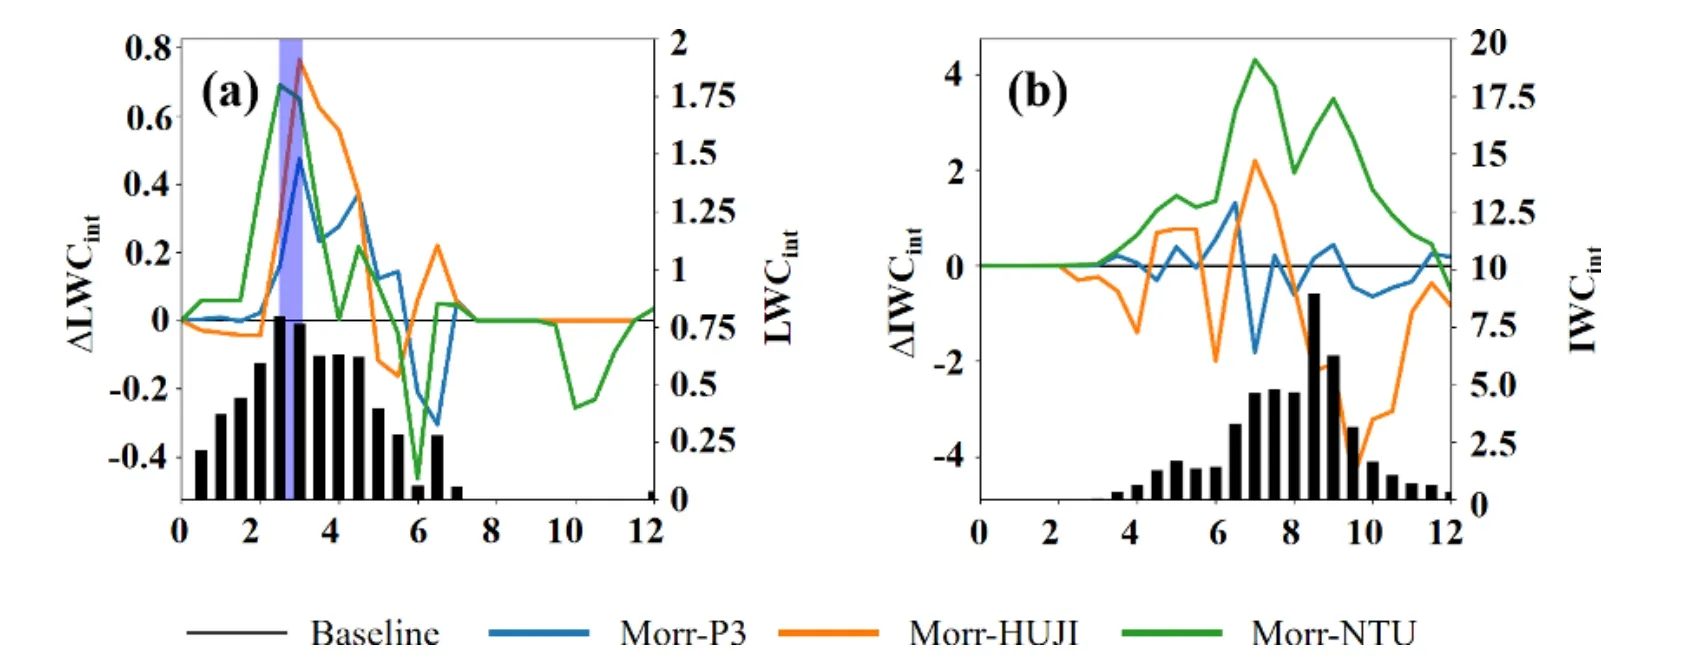
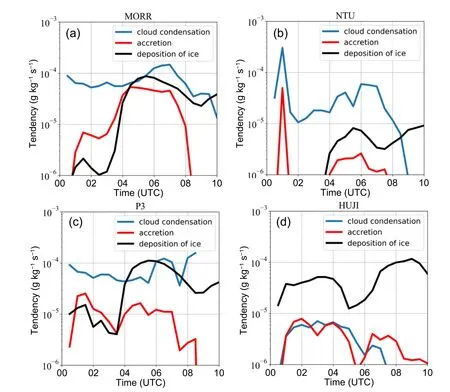
During the observations,high-resolution 2D images of ice particles (Fig.4) were obtained by CPI,which demonstrated a diverse vertical distribution of particles within the WCB and revealed typical microphysical processes that occurred during the ice falling.The cloud structure was divided into three distinct layers based on the thermodynamic structures (Fig.5) and the particle habits are shown in Fig.4.In the first layer,with a height range of 5.2 to 4 km(–13°C Fig.5.Average thermodynamic vertical structure at 0300 UTC at the location where the aircraft observation was conducted.Solid lines and blue dots represent that from model simulations and in-situ observations,respectively,for(a) temperature,(b) relative humidity,(c) wind speed (V-Component),and (d)wind speed (U-Component). The second layer,between 3.3 to 4.0 km,was dominated by a large number of spherical small particles coherent with some dendrites,with a temperature of–7°C and relative humidity around 100%.This layer was apparently influenced by the warm and humid air carried by the WCB,with wind speeds of up to 25 m s–1.The high relative humidity in this layer provided an ideal condition favoring the condensational growth of droplets and depositional growth of ice particles.Both the number concentrations and liquid water content of cloud droplets,measured by FCDP,dramatically increased to 105L–1and 0.5 g m–3,respectively.However,due to the relatively warm ambient conditions,the efficiency of ice nucleation processes,including depositional nucleation and droplet freezing nucleation,was low,resulting in a very low ice number concentration (NCIP>100usually smaller than 1 L–1).Additionally,persistent LWC in layered clouds is often attributed to the existence of a pristine air mass with very low concentrations of ice nuclei (IN) and cloud condensation nuclei (CCN).This scenario has been supported by recent research studies (Rosenfeld et al.,2013;Wang et al.,2015,2021),such as the observation of the coldest supercooled drizzle documented in the literature.This event also occurred at–19°C in orographic layered clouds over the Cascades and in a high-level stratus deck at a temperature of–21.6°C.However,in our case,we were unable to measure aerosol and ice nuclei (IN),which prevented us from identifying the true cause of the abundant supercooled liquid water.As a result,further investigation is needed to fully understand the underlying mechanisms and processes that contributed to the formation and maintenance of supercooled liquid water in this context. In the upper region of the third layer,which marks the lower boundary of the WCB at an altitude of approximately 3 km,strong wind shear generates turbulence.This turbulence enhances the processes of aggregate formation,riming,and the Hallett-Mossop process for ice crystals.As a result,the residence time of precipitating particles increases,promoting the growth of heavily rimed particles and frozen droplets on snow surfaces,as well as a large number of secondary ice crystals (NCIP>100~70 L–1) such as needles and columns in this area.Notably,the presence of aggregates,graupel particles,and needle and columnar particles in this instance suggests the growth of ice crystals during their descent,as well as other significant microphysical processes such as the multiplication of ice crystals. Despite the low relative humidities (ranging from 40%to 80%) in the cloud's lower portion (altitude~3000 m),the number concentrations of ice particles reach their maximum just below the second layer and gradually decrease to 1 L–1at 1 km due to the evaporation process in the third layer. This scenario is commonly observed during the winter season in a WCB.The fine structure of the WCB cloud was examined in situ,which further confirmed the existing conceptual model that was established through individual cases using dual-polarization radar,as demonstrated in studies by Gehring et al.(2020) and Keppas et al.(2018). This study also presents the vertical thermodynamic and microphysical properties captured by in-situ data for the first time over north China.Figure 4 shows the aircraft's vertical measurements of thermodynamic profiles,including wind speed,relative humidity,and temperature,indicating an obvious inversion layer between 3 and 4 km,which is consistent with the strong wind speed (up to 25 m s–1) in the same layer.The measured relative humidity profile also shows a significant change from the ground to 4 km,increasing from about 40% at the ground to near saturation(~100%).This is because warm and humid air from South China climbs above and overruns the dry and cold air via long-range transportation along WCB trajectories (Fig.2).In general,the thermodynamic profiles measured by the onboard instruments are similar to those from WRF simulations,except for the relative humidity below 2000 m,where the WRF-simulated relative humidity is much lower than the in-situ measurements.There could be a couple of reasons behind the disparity observed in the simulated relative humidity (RH) compared to the in-situ observations.One possible explanation lies in the inaccuracy of the initial and boundary conditions utilized to initialize the WRF model.These conditions play a crucial role in determining the simulated RH,and any discrepancies or biases in these inputs can significantly impact the model’s performance.Additionally,a potential factor contributing to the differences in RH might be the microphysical bias between the model and the in-situ data.For instance,the model may fail to accurately capture certain processes,such as the stronger evaporation of hydrometeors in the lower altitude,which can moisten the atmosphere. Previous studies have demonstrated that when a WCB rises from the boundary layer and the ascent rate is strong enough (which is typically the case for most WCBs),supercooled liquid water (SLW) can be generated and persist into the mid-troposphere (Pfahl et al.,2014;Keppas et al.,2018).Therefore,Fig.6 demonstrates an overview of the significant spatial variations in the cross-section of cloud structures in WRF simulations using different microphysics schemes along the 115°E parallel.The bulk microphysics,including the mixing ratio of snow water content,graupel,and liquid water content over the grid points,is examined. Fig.6.Cross sections of the bulk water content of snow (blue contours,labeled in g kg–1) along 115°E,graupel(black contours,labeled in g kg–1),liquid water (color filled),and equivalent potential temperatures (red line,labeled in K) from the WRF model with different microphysics schemes at 0300 UTC for (a) NTU,(b) HUJI Fast Bin,(c)conventional Morrison two moment,and (d) P3. Fig.7.Vertical distribution of bulk microphysical parameters,in terms of LWC and IWC at 0300 UTC from WRF simulations and aircraft observations (blue solid line) for the (a)Morrison two moment,(b) P3 scheme,(c) HUJI fast bin,and (d) the NTU scheme. While there is considerable diversity in microphysical quantities across these simulations,some key features of WCBs were captured by all four schemes.For instance,both simulations depicted a distribution of supercooled liquid water along the slant elevation of the isotherms.This supercooled liquid water is primarily located at an altitude of 3–5 km near 36.5°–37.5°N.Additionally,along the 115° longitude vertical cross-sections,some convection structures embedded in stratiform were observed.In these convective areas with high snow water content,the supercooled water is rapidly consumed by riming and the sublimation processes of snow falling from upper levels,leading to a relatively small water content. Out of the four schemes,the HUJI scheme showed a much higher snow water content than the other schemes,with the maximum snow water content exceeding 0.5 g kg–1at 38°N.It is worth noting that the simulation results of the latest microphysical scheme (NTU) for snow water content are considerably different from those of other schemes.Specifically,it generally does not show the water content of snow,and the predominant ice phase particles are graupel. Figure 7 compares the vertical distribution of liquid water content (LWC) obtained from aircraft observations and simulations with four microphysics schemes in the region where in-situ observations were performed.The P3 scheme is an updated version of the MORR scheme and considers more complex ice-phase processes,such as variations in ice particle density and falling velocity due to riming.As a result,both schemes produce similar results for cloud microphysical quantities,with maximum LWC values of 0.44 g kg–1and 0.6 g kg–1for P3 and MORR,respectively.Overall,the simulation results from the MORR and P3 schemes can generally reflect the supercooled water layer above a height of 3 km,although the maximum value is larger than the actual observation in MORR,and the spatial distribution of supercooled water in the vertical direction is wider than the observation in both schemes.In contrast,the HUJI fast bin scheme significantly underestimates the supercooled water layer,with a maximum LWC value of less than 0.1 g kg–1,which is nearly five times lower than the observed value of 0.5 g kg–1.The HUJI scheme also produces larger ice water content (IWC) values than MORR and P3,with a maximum IWC value of 0.3 g kg–1compared to 0.1 g kg–1in MORR and P3.It should be noted that,at least in this case,the NTU scheme with its triple moments and detailed treatment of ice processes does not show a significant advantage in simulating the vertical distribution of the supercooled water layer,although it performs better than the HUJI scheme. Based on the vertical microphysical tendencies of different microphysics schemes when simulating the WCB(Fig.8),there are some notable differences between the schemes.The conventional Morrison two-moment scheme showed the largest droplet condensation rate and a small deposition rate from 3 to 4.5 km where the WCB band is located.This scheme also exhibited remarkable agreement with insitu observations in terms of the supercooled liquid water layer and ice water content.The P3 scheme also showed similar tendencies to the Morrison scheme.Given the similarities in their formulation,it is not surprising that the Morrison and P3 schemes generate similar tendencies for condensation and deposition rates.However,there may be some differences in the specific parameterizations used in each scheme,as well as the tuning of those parameters,that could lead to some differences in their performance.For example,the P3 scheme includes a more detailed treatment of sedimentation,with a parameterization that takes into account the shape of the droplet size distribution.This could lead to differences in the deposition rate compared to the Morrison scheme,which uses a simpler sedimentation parameterization. Fig.8.Vertical distribution of microphysical tendencies for the four schemes at 0300 UTC for(a) MORR,(b) P3,(c) NTU,and (d) NTU. On the other hand,the NTU scheme tended to generate much smaller condensation and deposition rates compared to the Morrison and P3 schemes,given that the NTU scheme uses a more complex method to describe the formation process of cloud droplets compared to some other bulk schemes.Specifically,the NTU scheme uses a modal approach to represent the droplet size distribution,which assumes that the droplets can be separated into several size bins or modes with different mean sizes and standard deviations.However,compared to the Morrison and P3 schemes,which are conventional two-moment schemes that track both droplet number and mass,the NTU scheme still has deficiencies in terms of the microphysics processes it includes.For example,while the Morrison and P3 schemes include parameterizations for droplet autoconversion and accretion,the NTU scheme does not explicitly represent these processes.Instead,the NTU scheme uses a simplified approach that assumes the droplet size distribution evolves only through condensation and evaporation processes. Meanwhile,the HUJI scheme with its bin method showed much larger ice deposition rates than the three bulk microphysics schemes,but much smaller condensation rates for cloud droplets.In addition to the complexity of the microphysics scheme,there may be other factors that contributed to the poorer performance of the HUJI scheme in simulating the WCB,such as the specific assumptions and parameterizations used in the scheme.The role of ice nucleation in determining microphysical properties can certainly play an important role in determining the overall structure of a cloud,particularly in the presence of supercooled liquid water (Burrows et al.,2022).Meanwhile,the ability of a microphysics scheme to accurately capture ice nucleation and subsequent growth and sedimentation of ice particles can be critical in simulating the formation and evolution of clouds. The larger deposition rates in the HUJI scheme could indicate an overestimation of precipitation particles,while the smaller condensation rates may contribute to an underestimation of the liquid water content.Improving the representation of microphysics in bin schemes with in-situ data could help reduce uncertainties and improve the accuracy of microphysical processes in the WCB.It is also important to consider similar assumptions for all schemes to isolate the impact of physics from numerics.These findings suggest that choosing an appropriate microphysics scheme is critical for accurate simulation of the WCB and its associated precipitation processes. After conducting vertical measurements,several horizontal flights were performed to obtain the distribution of bulk microphysical properties at the 620-hPa pressure level.Figure 9 displays the simulated results of four schemes for microphysical quantities,specifically the IWC and LWC,at 620 hPa at 0300 UTC.At this time,a large-scale stratiform cloud extended from southwest to northeast,which is parallel to the background wind field and apparently influenced by the WCB.The figure reveals that three parameterized schemes,namely MORR,P3,and NTU,show a supercooled water belt extending from the southwest to northeast at 620 hPa,parallel to the wind direction.Among them,the MORR scheme predicts a higher mixing ratio of supercooled water,and the range of the supercooled liquid cloud is much wider than the other schemes.Although the simulated results of the P3 scheme are similar to the MORR scheme,the range of the supercooled cloud water is narrower than that of the MORR scheme.It should be noted that,in the HUJI bin scheme,the supercooled water belt at 620 hPa is absent due to the predominance of ice-phase particles at this level.As a result,the IWC quantities are much higher than those of other bulk schemes.The NTU scheme also exhibits a supercooled liquid water band at 620 hPa,and the LWC along the flight track is comparable to the two conventional schemes,MORR and P3. Figure 10 illustrates the LWC and IWC variations obtained from in-situ observations and predicted by four schemes at 620 hPa,with the flight track indicated by the red line in Fig.9a.Since the spatial resolution of the aircraft data is much higher (~100 m) than that of the model (~3 km),the in-situ data are averaged every 3 km to match the spatial resolution of the WRF model.According to the aircraft data,the content of supercooled liquid water increased as the aircraft approached the center of the cloud band,reaching a maximum of 0.3 g kg–1,before decreasing again as it approached the edge of the cloud.At the edges of the cloud,only a small amount of ice water content (<0.1 g kg–1) was observed,indicating that the cloud was primarily composed of supercooled liquid water,with ice particles only forming in localized regions,the edge of the cloud,where the evaporation process exist.Also,the variations of cloud droplets and ice particles at the edge of the cloud were probably related to the entrainment of dry and cold air (Fries et al.,2021).The figure also reveals that,although different microphysics schemes produce a wide range of values for LWC and IWC,three bulk microphysics schemes (MORR,P3,and NTU) predict a similar trend of LWC along the flight track,with the LWC of MORR being much closer to the in-situ observation.However,the MORR and P3 schemes over-predicted IWC at 620 hPa,whereas in-situ observations indicated that the cloud at 620 hPa was almost entirely in the liquid phase,with only a few ice-phase particles appearing at the edge of the cloud.Of the four schemes,the HUJI bin microphysics scheme performed the worst in predicting the cloud phase within the WCB for this case,compared to the in-situ observation. Fig.9.Liquid water content (LWC,shaded area) and ice water content (IWC,contours) at 620 hPa from four microphysics schemes: (a) Morrison two moment,(b) P3,(c) NTU,and (d) HUJI fast bin.The red solid line represents the flight track during horizontal observation. Fig.10.Intercomparison (a) LWC and (b) IWC between the in-situ observation and model simulation along the flight track as indicated in Fig.9.The IWC and LWC are averaged every 3 km to fit the model domain,and vertical bars denote the standard deviation of in-situ data.The high-resolution 2D images of particles along the flight track are shown at the top. To assess the impact of various microphysical schemes on the temporal evolution of the microphysics,specifically regarding the liquid water and ice water contents,we computed the cumulative water content of liquid and ice hydrometeors for each vertical grid point and averaged them over a region corresponding to the location of the aircraft observations,denoted as LWCintand IWCint.The differences among the four microphysical schemes can then be characterized by the disparities between LWCintor IWCint,which are defined as follows: The LWCintand IWCintfrom the conventional Morrison two-moment scheme,denoted as LWCint_MORR and IWCint_MORR,are selected as the baseline simulation to compare with those from new schemes. The temporal variability of the liquid water content(LWCint) and the difference in LWCintbetween the four microphysical schemes (ΔLWCint) provide further confirmation of the significant diversity in microphysics among the schemes.As depicted in Fig.11,the LWCintof the Morrison scheme mostly occurs prior to 0600 UTC with a maximum value of over 0.8 g kg–1,whereas the ice water content(IWCint) dominates after 0400 UTC.These variations suggest an inverse correlation between the two parameters.The differences in LWC between the schemes are relatively small during the first two hours,as the ΔLWCintis approximately 0.However,between 0200 and 0400 UTC,the ΔLWCintgradient increased in the P3,HUJI,and NTU schemes.For the HUJI scheme,the maximum value of ΔLWCintexceeded 0.75 at 0400 UTC,indicating a rapid consumption of liquid water content compared to the MORR.Intriguingly,the LWC in the NTU scheme disappears much faster than in the HUJI and P3 schemes between 0000 and 0400 UTC. Fig.11.Temporal variations of (a) LWCint and ΔLWCint and (b) IWCint and ΔIWCint from 0000 to 1200 UTC are shown.The solid lines represent the ΔLWCint and ΔIWCint,and the bar plots indicate the mean LWCint and IWCint for the Morrison scheme,which is altered to represent the baseline simulation. The temporal variations of the averaged microphysical tendencies for different microphysics schemes over the observation area,namely NTU,Morrison two moment,P3,and the HUJI,are shown in Fig.12.The results indicate that the microphysical processes associated with the phase change of liquid droplets significantly influence the general cloud structure evolution of the WCB over time.The Fig.12 provided in the study highlights the primary microphysical processes that affect the liquid and ice water content within the observation area.It is evident that the MORR and P3 schemes produce a higher condensation rate of liquid water droplets compared to the NTU and HUJI schemes,while the deposition rates of solid ice particles in the MORR and P3 are one to two orders of magnitude smaller than the condensation rate before 0400 UTC,resulting in a lower IWC before that time.The low IWC environment before 0400 UTC is more conducive to the condensational growth of liquid water for MORR and P3 schemes since the consumption of water vapor by ice crystals is not obvious at this time.It is noteworthy that both the condensation and deposition processes in the NTU scheme are less active than in MORR and P3 after 0100 UTC.For example,at 0300,the average condensation rate is about 2 × 10⁻⁵g (kg s)–1in NTU,whereas,in MORR and P3,it is about 7 × 10⁻⁵and 6.5 ×10⁻⁵g (kg s)–1,respectively.Meanwhile,the riming and deposition of ice are 1-2 orders of magnitude smaller than the condensation rate in MORR and P3.As the snow event progressed,the microphysical properties of the cloud underwent significant changes.After 0400 UTC,the ice particles within the cloud had largely developed,leading to an increase in the rates of accretion and deposition by approximately one order of magnitude in both the MORR and P3 microphysical schemes compared to earlier times.This resulted in the condensation and accretion rates becoming comparable in the MORR scheme,with both rates reaching approximately 7 × 10⁻⁵g (kg s)–1. Fig.12.Variation of main average microphysical tendencies with time for different schemes from 0000 to 1000 UTC,including condensation of cloud droplets,accretion,and deposition of ice phase particles for the (a) MORR,(b) NTU,(c) P3,and (d) HUJI schemes. In contrast,the accretion process remained relatively weak in the P3 scheme,despite the large increase in deposition rate.These findings suggest that the different microphysical schemes may exhibit distinct sensitivities to the development of ice particles within clouds,with some schemes being more effective at capturing the impact of such processes on cloud properties than others. Overall,although the microphysical tendencies indicate that the liquid phase process is predominant during the snowfall event,the microphysical processes,including cloud condensation and ice deposition in NTU are less active than in MORR and P3.This indicates that the NTU scheme may not accurately capture the complexity of snowfall processes in the WCB,particularly in high-altitude regions.The NTU scheme uses a modal approach to represent the droplet size distribution,which assumes that the droplets can be separated into several size bins or modes with different mean sizes and standard deviations.However,compared to the Morrison and P3 schemes,which are two-moment schemes that track both droplet number and mass,the NTU scheme is still simpler in terms of the microphysics processes it includes.For example,while the Morrison and P3 schemes include parameterizations for droplet autoconversion and accretion,the NTU scheme does not explicitly represent these processes.Instead,the NTU scheme uses a simplified approach that assumes the droplet size distribution evolves only through condensation and evaporation processes. The microphysical processes experienced by hydrometeors in HUJI significantly differ from those in the other schemes,as demonstrated in the figure.HUJI exhibited predominant depositional growth of solid ice particles throughout the entire snowfall event,with a condensation rate[10–6-10–5g (kg s)–1] of liquid water droplets,one order of magnitude smaller than that of the other schemes.The higher deposition rate and lower condensation rate in HUJI are consistent with a larger IWC and lower LWC,which,in turn,result in the accretion rate of ice particles being smaller during the snow event.On the contrary,ice growth in the other schemes (e.g.,MORR and P3) relies more on the accretion of supercooled water droplets. The comparison of microphysics schemes has revealed the complexity of microphysical processes involved in precipitation.Usually,it is believed that bin schemes offer greater accuracy in capturing the distribution of ice particles and the production of snow.However,in this case,the bulk scheme has performed better than the bin scheme in terms of the properties and location of the supercooled liquid water layer in the WCB,highlighting the challenges in accurately predicting precipitation due to the complex nature of the microphysical processes involved.Therefore,further research is required to develop more accurate and efficient microphysics schemes to improve our understanding of precipitation processes.These findings have important implications for precipitation forecasts,as the microphysical properties of snowflakes produced by different schemes can significantly affect the accuracy of detailed cloud structure forecasts. Thoroughly investigating the microphysical properties of WCBs,especially the supercooled liquid water layer,is of utmost importance for enhancing the accuracy of precipitation forecasts and mitigating potential hazards to local communities.In this study,we have investigated the cloud structure of a snow event in North China,which was influenced by a Warm Conveyor Belt (WCB).We used a mesoscale numerical model (WRF) with four different microphysical schemes and the Lagrangian analysis tool LAGRANTO in conjunction with aircraft observations to analyze the microphysical properties of the cloud.Our findings can be summarized as follows.; (1) This study presents typical thermodynamic features of a WCB,such as the inversion layer and enhanced vertical wind shear,as well as a supercooled liquid water layer(LWC) with up to 0.5 g kg–1of water content.The high-resolution CPI images confirmed the presence of rimed ice particles and column and needle ice particles,possibly produced by secondary ice production processes,providing the first confirmation of the conceptual model of a WCB cloud over North China.These observations highlight the importance of supercooled liquid water in forming the cloud structure of WCB,particularly the formation and evolution of ice. (2) Among the four microphysics schemes used,the Morrison two-moment scheme generally reproduced the macroscale and microscale cloud structures reasonably well when compared to observations,particularly for the supercooled liquid water layer and vertical thermodynamic structure.However,the prediction of ice water content (IWC)remains a challenge for the Morrison scheme,as it tends to overestimate the IWC at high altitudes.This is likely due to the simplifications in the treatment of ice particle shapes and activation processes in the scheme.Despite this limitation,the Morrison two-moment scheme remains a valuable tool for simulating WCB clouds and improving our understanding of the complex microphysical processes involved. (3) Our investigation revealed a significant disparity in the cloud structures generated by different microphysical schemes.The NTU triple-moment scheme,being the latest,produced considerably lower amounts of supercooled liquid water compared to the Morrison scheme.This lower supercooled liquid water content in the NTU scheme is likely the result of a more complex representation of particle growth and collision processes that results in slower rates of droplet growth and ice deposition.Additionally,the less efficient cloud activation process used in the NTU scheme,which is reliant on both the relative humidity and updraft speed,may result in a lower efficiency of cloud droplet formation.These factors may collectively contribute to the lower cloud condensation rate and ice deposition rate observed in the NTU scheme. (4) In this case,the differences in bulk microphysics between HUJI and two bulk schemes,namely MORR and P3,may be mainly attributed to the distinct nucleation procedures of cloud droplets and ice,except for the complexity of the snow and cloud droplet treatment.In MORR,only a conventional ice nucleation process related to the ambient temperature was considered,which produced a relatively small number of ice crystals due to the warm air (about–7°C) in the WCB.However,HUJI employed a hybrid equation incorporating the sensitivity of the ice saturation and temperature to simulate the ice nucleation process.Therefore,the larger ice saturation rate in WCB promoted fast ice nucleation in the early stage of the snowfall event in the HUJI scheme,producing a large number of ice crystals.This led to strong depositional growth of ice-phase hydrometeors and,in turn,suppressed the activation and condensation growth of cloud droplets. Based on the findings of this study,several future directions can be explored to further our understanding of snowstorm events influenced by warm conveyor belts.First,it would be valuable to conduct additional case studies to investigate the variability of cloud structures and microphysical properties.Second,further research is needed to improve the performance of microphysical schemes in simulating supercooled liquid water and ice phase processes.This could involve incorporating new parameterizations or modifying existing ones based on observations and theoretical considerations. Although the selected microphysical schemes were compared and evaluated in terms of their representation of cloud structures and microphysical properties,it is important to note that the performance of these schemes may vary depending on specific meteorological conditions and geographical regions.Additionally,it is important to acknowledge certain limitations of this study.For instance,the analysis conducted in this research is still Eulerian (fixed domain) rather than Lagrangian (storm following),A Lagrangian approach would provide valuable insights into the cloud evolution and movement,but it presents significant technical and computational challenges that are beyond the scope of this study. Acknowledgements.The authors would like to express their sincere gratitude to Dr.Zuowei XIE for his kindness in sharing the Lagrange analysis tool LAGRANTO,which greatly contributed to the success of this work.This research was jointly supported by the China National Science Foundation under Grant Nos.41875172 and 42075192.The authors would also like to extend their appreciation to the anonymous reviewers for their valuable comments and suggestions,which helped improve the quality of this research.Their insightful feedback and constructive criticism were instrumental in shaping the final outcome of this study.
6.Results
6.1.Microphysical Process Rates of Four Schemes

6.2.Observation and model simulation of horizontal cloud microphysical properties

6.3.Temporal variation of microphysics
6.4.Microphysical processes in different schemes varied with time
7.Conclusion and future work
杂志排行

Advances in Atmospheric Sciences的其它文章
- The First Global Map of Atmospheric Ammonia (NH3) as Observed by the HIRAS/FY-3D Satellite
- Comparison of the Minimum Bounding Rectangle and Minimum Circumscribed Ellipse of Rain Cells from TRMM
- Cloud-Type-Dependent 1DVAR Algorithm for Retrieving Hydrometeors and Precipitation in Tropical Cyclone Nanmadol from GMI Data
- Assessment of Crop Yield in China Simulated by Thirteen Global Gridded Crop Models
- A Study on the Assessment and Integration of Multi-Source Evapotranspiration Products over the Tibetan Plateau
- Downscaling Seasonal Precipitation Forecasts over East Africa with Deep Convolutional Neural Networks