Comparison of the Minimum Bounding Rectangle and Minimum Circumscribed Ellipse of Rain Cells from TRMM
2024-03-26HongkeCAIYaqinMAOXuanhaoZHU3YunfeiFUandRenjunZHOU
Hongke CAI ,Yaqin MAO ,Xuanhao ZHU3, ,Yunfei FU* ,and Renjun ZHOU
1Plateau Atmospheric and Environment Laboratory of Sichuan Province, School of Atmospheric Sciences,Chengdu University of Information Technology, Chengdu 610225, China
2School of Earth and Space Sciences, University of Science and Technology of China, Hefei 230026, China
3Center for Atmospheric Optics, Anhui Institute of Optics and Fine Mechanics,Chinese Academy of Sciences, Hefei 230031, China
ABSTRACT Based on the TRMM dataset,this paper compares the applicability of the improved MCE (minimum circumscribed ellipse),MBR (minimum bounding rectangle),and DIA (direct indexing area) methods for rain cell fitting.These three methods can reflect the geometric characteristics of clouds and apply geometric parameters to estimate the real dimensions of rain cells.The MCE method shows a major advantage in identifying the circumference of rain cells.The circumference of rain cells identified by MCE in most samples is smaller than that identified by DIA and MBR,and more similar to the observed rain cells.The area of rain cells identified by MBR is relatively robust.For rain cells composed of many pixels (N>20),the overall performance is better than that of MCE,but the contribution of MBR to the best identification results,which have the shortest circumference and the smallest area,is less than that of MCE.The DIA method is best suited to small rain cells with a circumference of less than 100 km and an area of less than 120 km2,but the overall performance is mediocre.The MCE method tends to achieve the highest success at any angle,whereas there are fewer “best identification”results from DIA or MBR and more of the worst ones in the along-track direction and cross-track direction.Through this comprehensive comparison,we conclude that MCE can obtain the best fitting results with the shortest circumference and the smallest area on behalf of the high filling effect for all sizes of rain cells.
Key words: TRMM,minimum bounding rectangle,minimum circumscribed ellipse
1.Introduction
Clouds represent an important part of the weather and climate system as they directly participate in the water cycle and latent heat exchange of the earth–atmosphere system and alter the system radiation balance (Liou,1986;Rossow and Schiffer,1999).Rangno and Hobbs (2005) used aircraft to observe different clouds to obtain different macro and micro characteristics such as cloud top height,shape,optical thickness,and particle size.Different clouds have different radiative forcings (Wetherald and Manabe,1988),and the differences in their vertical structure determine the varying probability of precipitation (Rosenfeld et al.,2007,2012).Therefore,precipitation systems usually have different sizes,shapes,and intensities (Austin and Houze,1972;McAnelly and Cotton,1989),and the most basic precipitation unit can be defined as a rain cell.We regard rain cells as the projection of precipitating clouds on the ground,so several adjacent precipitation elements are identified as a rain cell (Austin and Houze,1972).In order to make a unified comparison,our identification and screening of rain cells is consistent with Fu et al.(2020).
An accurate description of rain cells is crucial,and only a deep understanding of the precipitation mechanism can promote the development of numerical prediction models and improve the accuracy of weather forecasts and climate predictions (Rossow et al.,2002;Arakawa,2004;Pincus et al.,2006).Using weather radar data,Austin and Houze (1972)established a horizontal area threshold for a single cumulus convective element with an area of 10 km2.The precipitation system was divided into synoptic-scale precipitation areas,meso-scale precipitation areas,and light rain cells,and their development,movement,and dissipation were studied(Austin and Houze,1972).Changnon (1981) observed the size (length and width) characteristics of rain cells in Illinois,USA,and used this,in combination with their movement direction,as a basis to divide local rain cells into two types.The most frequent was a relatively small (16 km long and 6 km wide),short-lived entity (50 min).A few rain cells,10%or less were much longer,wider and long lasting,which produced about half of the seasonal rain,and often produced hail.It means that this classification method connects the morphological,lifetime and weather phenomena of rain cells.Capsoni et al.(1987) defined a rain cell as the area surrounded by a 5 mm h-1contour line,collected more than 6000 rain cell ribbon slices using S-band weather radar,established an exponential model,and described its statistical properties.Lorente and Redaño (1990) established a local rain gauge observation network in Barcelona to analyze rain belt movement.Kawamura et al.(1996,1997) studied the movement,shape,size,and intensity distribution of convective precipitation based on rain gauge data and an advection–diffusion model.Sauvageot et al.(1999) concluded that the size distribution of rain cells for a given rain rate threshold can be represented by an exponential distribution,and the exponential parameters are weakly dependent on geographical location and are independent of the threshold.
Infrared or microwave observations are typically used for remote sensing observations of rain cells,(Mapes and Houze,1993;Mohr and Zipser,1996;Machado et al.,1998;Toracinta and Zipser,2001;Zuidema,2003;Hong et al.,2005).However,due to insufficient understanding of the relationship between cloud and precipitation,identifying and describing rain cells requires more direct parameters than simply using infrared or microwave brightness temperature (Rickenbach,1999).More direct parameters are needed to identify and describe rain cells,such as morphological,rain-cell lifetime,and precipitation parameters.Changnon (1981)divided rain cells into two categories based on these parameters.This problem remained unsolved until the Tropical Rainfall Measuring Satellite (TRMM) became operational in 1998 (Turk and Bauer,2006;Houze et al.,2015).Fu et al.(2006) used data from the TRMM satellite to study the vertical structure of rain cells over the Tibetan Plateau,and found that the TRMM algorithm may misclassify weak convection as layered precipitation in this region.Liu et al.(2008)defined many kinds of rain cloud parameters (e.g.,lightning ratio,size,and minimum brightness temperature) using the TRMM satellite observations.According to the lightning ratio and minimum brightness temperature,we can judge whether there is a strong convective updraft to study the precipitation system,and the size of precipitation particles is used to estimate and verify the rainfall.Hamada et al.(2015) studied rain cells in extreme events and found that the rain cells with the strongest rain intensity do not necessarily have the highest echo tops.Chen and Liu (2016) and Chen et al.(2017) combined TRMM and reanalysis (ERAInterim) data to study organized and isolated warm rain cells and larger precipitation systems (>104 km2),with consideration of their regional differences.Li et al.(2019) derived a simplified semiphysical retrieval algorithm for the latent heat of precipitation over the Qinghai–Tibet Plateau by combining WRF (Weather Research and Forecasting) simulations and satellite observation data such as TRMM.
The morphological characteristics of rain cells are related to many basic applications,especially the parameterization of cumulus clouds,the parameterization of water and energy cycles,atmospheric circulation models,and microwave propagation (Feral et al.,2000).The rise of computer image vision processing in the 21st century (Marot and Bourennane,2007;Du et al.,2011;Kwak and Habib,2014) has provided new ideas for rain cell research.The identification of rain cells is not only used to study their macroscopic and microscopic characteristics,but also to track their movement and improve the accuracy of the resultant weather forecasts.For example,Begum and Otung (2009)tracked rain cells to study their movement changes.Lakshmanan et al.(2009) used the watershed algorithm during image processing to track and identify storm cells,which is a classic algorithm used for segmentation and is especially useful when extracting touching or overlapping objects in images.In order to obtain the morphological characteristics of rain cells,researchers have successively located the rain cells observed by TRMM based on ellipse fitting obtained by minimizing the moment of inertia,and determined their major axes,minor axes,and inclination angles.The differences in the morphological characteristics of the patterns between storms over land or sea have been observed (Feral et al.,2000;Nesbitt et al.,2006;Liu and Zipser,2013).However,there are some shortcomings associated with this fitting method.For example,when fitting some rain cells,the rain pixels on the edge may be omitted,and the major axis and minor axis obtained from the fitting results have no specific relation to the actual rain cells.A rain cell is a collection of adjacent precipitation elements.Rain cells are surface manifestations of convection and are important for further understanding convective storms,designing mesoscale studies,and evaluating numerical cloud models.Although various methods have been used to examine the characteristics of rain cells observe by TRMM,the definition and errors of rain cells introduce large uncertainties due to orbital truncation effects.The DIA (direct indexing area) method involves the use of a rectangle to identify rain cells from orbit directly.Fu et al.(2020) studied the MBR (minimum bounding rectangle) method using a rectangular optimal matching method to intercept clouds.On this basis,we propose the MCE (minimum circumscribed ellipse) method,which uses elliptic optimal matching to intercept clouds.From the methodological perspective,MCE further reveals the influence of cloud symmetry and asymmetry on the identification method.Fitted ellipses could provide smoother profiles than fitted rectangles.On the basis of previous studies,and to further obtain the three-dimensional structure of rain cells,Fu et al.(2020) improved the MBR method to derive the horizontal geometric parameters,vertical geometric parameters,and physical parameters (different components of precipitation,such as convection and stratiform precipitation) and then revealed the differences in morphological characteristics and precipitation contribution between ocean and land surface rain cells.Moreover,this method makes up for the shortcomings of previous methods by minimizing ellipse fitting through the moment of inertia and takes into account the influence of the truncation effect of the TRMM satellite orbit on rain cells.The application of this method should therefore increase the accuracy of precipitation system research.
The purpose of this study was to build upon previous studies in this field by developing the MCE method,an optimal ellipse fitting method with long-axis priority,to identify rain cells.MCE optimizes the rain cell identification method of Fu et al.(2020).Their commonality is the long axis of the rain cell based on the two lines with the farthest geometric distance in the rain cell.The difference is that when the shape of the rain cell is symmetrical,MCE outperforms MBR in identifying the rain cell.Conversely,MBR outperforms MCE in identifying the rain cell if the boundary ellipse generated by MCE is inscribed to the boundary rectangle,as it means that the boundary ellipse has a smaller area and a shorter perimeter,which also means that the boundary ellipse is closely connected to the actual rain cell.Therefore,we try to establish the MCE and compare the results with the MBR,and describe in detail the improved longaxis-first best ellipse fitting to the geometric characteristics of the rain cells observed by TRMM.The fitting results are compared not only in terms of the cell area but also the circumference to reveal the approximation effect of different fitting methods such as MCE,MBR,and DIA.This study aims to provide a deeper understanding of the applicability of the long-axis-first strategy in rain cell identification methods.
This paper introduces an improved method for identifying rain cells and reveals the morphological features of clouds.Section 2 introduces the data and specific methods used in this study,and then section 3 quantitatively analyzes the statistical characteristics of the geometric parameters of rain cells.Section 4 investigates the applicability of the DIA,MBR,and MCE methods to the number,perimeter,area,shape,and geometric parameters of different rain cells,and demonstrates the relationship between the geometric parameters of rain cells.Section 5 presents our conclusions.
2.Data and methods
The standard TRMM 2A25 version 7 dataset from January 1998 to April 2015 (https://trmm.gsfc.nasa.gov/data_dir/data.html) was used in this study.TRMM was launched on 27 November 1997,officially ended on 15 April 2015,and was the first scientific satellite dedicated to the study of tropical and subtropical precipitation.The orbit of the satellite was circular with an inclination of 35° to the equator.The orbit height was 350 km and the scanning width was 215 km before boost.After boost,the orbit height was 403 km and the scanning width was 245 km.The Precipitation Radar (PR) carried on TRMM was a Ku-band electronic scanning radar that could measure the rainfall distribution of land and ocean in three dimensions.The operating frequency was 13.8 GHz,the vertical resolution was 250 m and the horizontal resolution was 4.3 km.The horizontal resolution mentioned in this paper is only for the nadir point;the longitude and latitude of the subsatellite point and the orbital edge are fixed,and the change in resolution does not affect the effect of our minimum external ellipse method.The TRMM 2A25 version 7 dataset provides radar reflectivity profile,heavy rainfall profile,precipitation type,surface precipitation intensity,and supplementary information.Since the official data service commenced in March 2014,the Global Precipitation Measurement (GPM) mission has taken the place of TRMM to provide next-generation global observations of precipitation.GPM carries a dual-frequency precipitation radar consisting of a Ku-band precipitation radar and a Ka-band precipitation radar.The former adopts the 13.6 GHz band,similar to TRMM/PR (Tapiador et al.,2012).
This paper uses the ground precipitation intensity data provided by the TRMM 2A25 version 7 dataset and excludes precipitation pixels with a precipitation rate less than 0.4 mm h-1.Capsoni et al.(1987) defined a rain cell as the area with rain rates greater than 5 mm h-1(as observed by S-band radar near Milan during April–October 1980)and obtained a formulation for the spatial number density of rain cells by using the cumulative rain-rate distribution.This formulation was modified by Awaka (1989) with a rainrate threshold at 0.4 mm h-1.In this study,a rain cell is defined by the presence of adjacent rain pixels with a near-surface rain rate of at least 0.4 mm h-1,or reflectivity of 17 dBZ,as previously described by Fu et al.(2020).
The improved MBR method involves finding the two pixel points,AB,with the farthest geometric distance in the rain cell.Their connecting line is defined as the major axis of the rain cell,which determines the rotation angle of the circumscribed rectangle.Next,the pixel,CD,that is farthest from the major axis on both sides of the major axis is identified,and four straight lines are generated through the four points,ABCD.As a result,two lines are perpendicular to the major axis and pass through the major axis endpoint,AB,while two are parallel to the major axis and pass through the CD points.The resultant four lines are orthogonal to each other to form the four sides of MBR and the four intersections,EFGH,are the four vertices of MBR,which is shown in the blue rectangle in Fig.1.
The long-axis-first MCE used in this paper is improved based on the above-mentioned MBR.The MCE method also uses the major axis,AB,as the major axis of the ellipse,takes the midpoint of AB,O(x0,y0),as the midpoint of the ellipse,half the length of AB as the semi-major axisaof the ellipse,the slope of AB and the inclination anglek=tanθ=(yB-yA)/(xB-xA)as the slope and inclination angle of the ellipse,and then the ellipse equation of MCEis established by the ellipse standard equation,(x/a)2+(y/b)2=1,the coefficientaandbrepresenting the length of half the major axis and half the minor axis respectively.The coordinates of the farthest point,C or D,on both sides of the major axis are substituted into the MCE equation to calculateband the larger value is selected as the semiminor axis of the MCE ellipse.If all the boundary pixels of the rain cell are within the ellipse region,the ellipse equation is considered valid.If some pixels are omitted from the ellipse area,the missing pixels are used to replace the ellipse equation and it is recalculated to obtain a largerbvalue and a corresponding larger and more circular MCE.
The brown rectangle in Fig.1 is the DIA result according to the satellite orbit coordinates.DIA does not need to be calculated as the range of rain cells can be directly extracted from the TRMM/PR product coordinate system.The directions of the four sides are parallel,which are perpendicular to the satellite motion direction,and do not contain any information pertaining to the rain cell itself.The value of the long-axis priority strategy lies in that it gives the physical meaning of the actual rain cell principal axis to the external graph,which is conducive to effectively capturing morphological and kinematic characteristics of the precipitation system,such as squall lines.The MCE and MBR methods only require the coordinates of the boundary pixels to obtain the geometric parameters of the rain cell.Compared with the traditional equal interval rotation search method (Freeman and Shapira,1975;Safabakhsh and Khadivi,2000),it has the advantages of small calculation scale and fast calculation speed.
The filling factor is defined as the ratio of the actual rain cell pixels to the identification result,and is an important index to compare the validity of the identification result.For a rain cell,the actual rain cell pixels are determined,then the comparison of filling coefficients of different identification results can be transformed into the comparison of circumference and area of the identification results.The identification results with the shortest circumference and the smallest area are most similar to the actual rain cell,which is called the best identification result.Conversely,the identification result with the longest circumference and the largest area is called the worst identification result.The area is closely related to the coverage area of the precipitation system and the total amount of precipitation,and the circumference represents the interface of material and energy exchange between the rain cell and its surroundings.These two geometric parameters are important indicators of the shape of rain cells.Lovejoy (1982) discussed the relationship between rain cell area and circumference based on the Mandelbrot fractal theory,and studied the geometry of cloud and rain area determined by satellite and radar.A clear relationship was found between the circumference and area of cloud cells and their microphysical properties,which can be used to classify cloud cells (von Savigny et al.,2011;Batista-Tomás et al.,2016).
The circumferences and areas of the three methods are not generally equal,but the rectangles identified by DIA and MBR may overlap–that is,the actual main axis of the rain cell is only parallel to the direction of satellite motion,although statistics show that this possibility is less than 1%.The best identification result is defined as the result that possesses the shortest circumference and the smallest area simultaneously.To ensure a fair comparison,the shortest circumference and the smallest area are considered (they are less than but not equal to the other two results).
For isolated rain cells with only one pixel (Fig.2a),the results of the three methods are essentially the same and they all achieve complete filling and are thus not considered in this study.There are only two arrangements in Fig.2 for the rain cells of two pixels (Fig.2b and Fig.2c).Both approaches are linearly packed,so the results of MBR and MCE also achieve full filling (Fig.2d and Fig.2e),but the DIA result is only 50% filled (Fig.2f).The circumscribed rectangle of MBR and the circumscribed ellipse of MCE rotate along the axis of the rain cell (Fig.2e) and therefore can obtain a better approximation of the actual rain cell with a higher filling ratio and less blank space.Conversely,the two sides of the outer rectangle of DIA are fixed along the track and across the track,leading to a large amount of blank area outside of the inclined rain cell.

Fig.2.Pixel arrangement and identification results of small rain cells (only one pixel and two pixels).
About 15.37% of the intercepted rain cells contain boundary pixels,and the identification results spill over the PR scanning area.Because of the possible existence of rain cell pixels outside of the boundary,there is great uncertainty in recognizing these rain cells,and therefore they are not considered here.We identify a total of 19 550 277 effective rain cells,accounting for 84.63% of the total number of rain cells,as the statistical scope of this study.The number of pixels peaks at four and five,accounting for 28.77% of the total number of rain cells,and the proportion of rain cells with more than 50 pixels is less than 4.1%.For rain cells with more than five pixels,the number of pixels (N) shows an exponential relationship with their occurrence probability density function (PDF),PDF=336.8N-1.956,R2=0.9993,passing a significance test at the 0.01 confidence level.
3.Comparison of identification results among the three methods
Regardless of circumference or area,the identification results of the three methods are concentrated near the 45°line in Fig.3,indicating good correlation at the 0.01 confidence level.The results show equivalent results for all three methods,suggesting that geometric characteristics of clouds can be used to approach the real situation of rain cells.The identification results are consistent for rain cells with an area of less than 15 × 103km2.As the area of the rain cells increases,the differences between the identification results increase,and the circumference consistency of the identification results is better than the area consistency.

Fig.3.Correlation between the geometric parameters of the three identification patterns.The black 45° diagonal line represents the same results of the two identification methods of the x-axis and the y-axis.The coefficients C and S represent the circumference and area of the identification result;the subscripts DIA,MBR,and MCE represent the identification method;and the red line shows the linear fitting result of the scatter points.
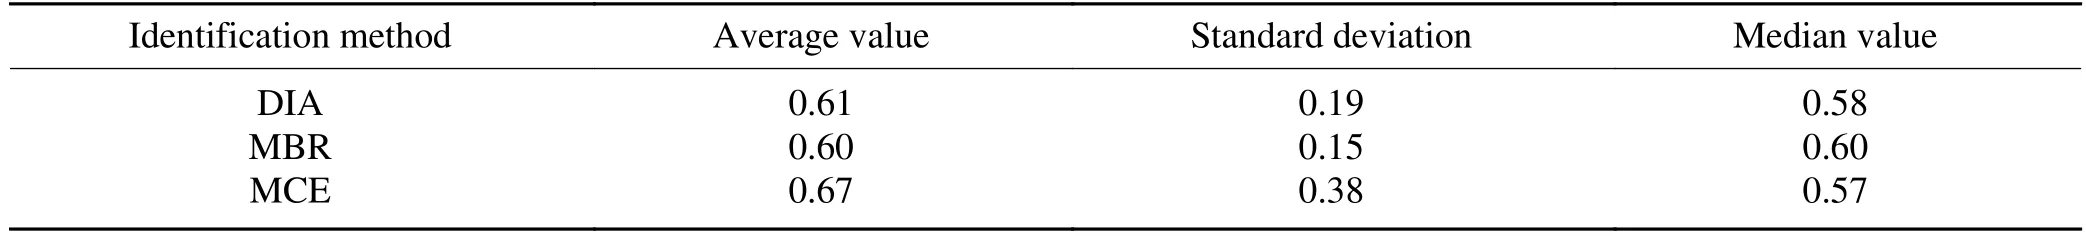
In Figs.3a–c,the scatter distribution is below the 45°focus line,and the slope of the scatter fitting line (red) is less than the 45° diagonal line,which indicates that the circumference of the identification results has a systematic difference ofCMCE The major axis of MCE is consistent with that of MBR,and the two furthest rain cells are used as the end points of the major axis.However,the lengths of the short semi-axes obtained by MBR on each side of the major axis may not be equal,whereas the lengths of the short semi-axes obtained by MCE on both sides of the major axis must be equal.Therefore,MCE is required to increase the length of the short semi-axes on both sides of the major axis because of the symmetry of the ellipse.As a result,the ellipse area of MCE is larger than that of MBR,and the corresponding filling rateβis lower than that of MBR.The advantage of MBR is particularly clear in identifying larger rain cells (the rain cell areaS>30 × 103km2),although the frequency of these large rain cells is very low.This means that the asymmetry of rain cells will affect the identification results,and the applicability of identification methods should be considered in the selection of identification methods for asymmetric rain cells(rain cell pixels located on the main axis side of rain cells)and symmetric rain cells. All three methods can reflect the properties and shapes of rain cells,and the horizontal geometry of rain cells extracted from them are statistically consistent (Fig.4). Fig.4.Probability density distributions of horizontal geometric parameters of rain cells: (a) length;(b) width;(c) circumference;(d) area;(e) shape factor α;and (f) filling rate β.The black solid line,blue dashed line,and red dotted line represent the DIA method,MBR method,and MCE method,respectively. In Fig.4a,the PDF of the rectangle length recognized by DIA in the range of 30 km The shape factorαis defined as the ratio of width to length of the rectangle or ratio of the minor axis to the major axis of the ellipse,α=W/L,0 <α<1,whereαdescribes the shape of the rain cell.The closerαis to 0,the thinner and longer the rain cell with a quasi-linear shape,and the closer it is to l,the fatter and rounder the rain cell with a quasi-square shape.Comparing the identification results of the three methods in Fig.4e,MCE identifies the most elongated rain cells (0 <α<0.3),and MBR identifies more elongated rain cells (0.35 <α<0.5) than DIA,showing that the long-axis priority strategy can more accurately describe the shape of the rain cell.MCE identifies more fat,round rain cells (0.77 <α<0.83 and 0.88 <α<1),which is also caused by the limitation of MCE in the identification of asymmetric rain cells. The filling rateβis defined as the ratio of the actual area of the rain cell to the identified area,which directly reflects the tightness of the identification method,0 <β<1.The closerβis to 0,the worse the identification result,and the larger the blank area brought by the identification method,and the closerβis to l,the better the identification result.Figure 4f shows that the MBR method can effectively improve the DIA identification effect for rain cells withβ<0.46 (17.0%),but has a negative effect on rain cells with 0.7<β<1 (26.3%).There are very few identification results withβ>0.8,less than 0.14% of all of the rain cell samples. The diagonal length of the rectangle is certainly longer than any edge,so choosing the major axis as the diagonal line can reduce the area of the MBR rectangle.However,the MBR method proposed by Fu et al.(2020) uses the major axis as the long side instead of the diagonal line,which is one possible reason why the filling rateβof its identification results are less than 0.8.When the boundary of the rain cell is parallel to the satellite orbit–that is,the rotation angleθ=0°–the area of DIA is smaller than MBR and the filling rateβof the DIA identification result is larger than that of MBR. As a result of the short-axis symmetric strategy,the identification results of MCE show considerable polarization,and the standard deviation of filling rateβis significantly larger than that of the other two methods (Table 1).As shown in Fig.4f,this has a negative effect on the rain cells withβ<0.4 and causes the most blank pixels in the identification results of the three methods.In the range 0 <β<0.46,the identification effect of 17.0% of the rain cells is worse than that of MBR.In contrast,in the range 0.67 <β<0.79 and 0.91 <β<1,the degree of closeness is highest from MCE,and in the range 0.67 <β<1,26.3% of the identification results are better than MBR. Table 1.Statistical results for the filling rate of the three identification methods. In general,there is clear improvement of the filling effect of MBR,with the largest median filling rate and smallest standard deviation (Table 1).In contrast,the average filling rateβvalue is largest for the MCE method,but the standard deviation is significantly greater than that of the other two methods,indicating that serious polarization drags down the overall performance of MCE. The circumference (or area) ratios of rain cells are identified by two different methods,i.e.,CMBR/CDIAandCMCE/CMBR,in Fig.5.A ratio less than 1 indicates that the method represented by the numerator is improved relative to the denominator;greater than 1 indicates that the method represented by the denominator better fits the rain cell sample than the numerator;and equal to 1 indicates that the results of the two methods are equal.The quartile of the ratio of circumference or area is determined to indicate the effectiveness of the identification method (Fig.5).That is,the results of the comparison of the two methods show which method can obtain a greater number of better results. The median of MBR relative to DIA,whether for circumference (CMBR/CDIA) or area (SMBR/SDIA),is around 1.This indicates that the proportion of positive contribution and negative contribution is approximately equal.About half of the rain cells are given a shorter circumference or smaller area by the MBR method,while the other half achieve better results with the DIA method.The approximation of the circumference by the MCE method is considerably better than that of DIA and MBR;70% of rain cells are better than in the DIA results;and 80% of rain cells are better than with MBR.However,the area contribution rate of the MCE method is not high.Compared with MBR,the fit to the rain cell data by MCE is improved for only 44.6% of rain cells,while the MCE area of some rain cells is considerably larger than the MBR area.This phenomenon can be attributed to the blank filling caused by the short-axis symmetry strategy of MCE.Compared with the short-axis asymmetric MBR,the short-axis symmetric MCE contains nearly half of the blank area.Therefore,the MCE method has poor identification effect on rain cells with significant asymmetry. The shortest circumference or the smallest area is defined as the best fitting graph and the longest circumference or the largest area is defined as the worst fitting graph.The best and worst performances of the three methods are shown in Fig.6. Fig.6.The ratio of the (a) best fitting graph,(b) worst fitting graph,and (c) the difference between the two.C (blank bars) and S (slashed bars) represent the circumference and the area,respectively,while CS (dotted bars) represents the circumference and area together.The best result is defined as the smallest area or the shortest circumference,and vice versa. The MCE method has the best fitting effect on the circumference of the rain cell;two-thirds of the best circumference result can be attributed to the MCE method (CMCEin Fig.6a),and this method has the least amount of influence on the worst circumference result (CMCEin Fig.6b).The MBR method has the poorest ability to successfully approximate the circumference of the rain cell and has a strong impact on the least good fitting and accounts for more than half of the worst fitting.Only MCE provides a net positive contribution to circumference (Fig.6c),accounting for about half of the sample size. A comparison of the rain cell areas shows the polarization of the MCE results,which has the strongest impact on the best fit (37%) and least fit (48%).Only DIA has a positive impact on the area,which is because it has the least impact on the worst fitting results. Comprehensive comparison of the area and circumference (dotted bars in Fig.6) indicates that MCE has the best fitting results (CSMCEin Fig.6a) and the best net effect(CSMCEin Fig.6c).This is because of its advantage in circumference approximation.The MBR method has the worst net effect (CSMBRin Fig.6c) and is affected by the poor circumference approximation (CMBRin Fig.6b).The net effect of area is similar (slashed bars in Fig.6c) and does not have any major effect on the comparison results for the identification methods.Overall,the approximation effect of DIA is mediocre;the probability of occurrence of the best result is equal to that of the worst result. The applicability of the three methods to different rain cells is assessed based on the response of the identification results to the differences in the macroscopic characteristics(number of rain cells,circumference,shape,and tilt angle). We use the median of the circumference and area ratio to measure the validity of the identification results (Figs.7a and b).For heavy rain cells with more than 40 pixels,there is a clear and robust effect of the identification method on the circumference.The median of the circumference ratio is stable.The identification results of MBR and DIA are similar,whereas the MCE circumference is considerably shorter than that of DIA and MBR.For small rain cells with less than 40 pixels,the median of the ratio of the MBR circumference to the DIA circumference is greater than 1,and the peak value is obtained atN=5,which indicates the DIA circumference is more suitable for a pixel number between 4 and 17 than that of MBR (Fig.7a,black line).MCE determines the circumference of light rain cells generally better than DIA (Fig.7a,red line).Only the rain cell composed of only three pixels has an MCE circumference worse than that of MBR (Fig.7a,blue line). Fig.7.Performance of the three methods under different numbers of rain cell pixels (N):(a) median of circumference ratios;(b) median of area ratios;(c) probability density of the shortest circumference;and (d) probability density of the smallest area. For heavy rain cells with more than 30 pixels,the median area ratio also shows good stability (Fig.7b).Compared with DIA and MCE,the MBR area has a better approximation effect and higher filling efficiency (Fig.7b,black and blue lines).However,the approximation effect of the MBR area is worse than that of DIA and MBR for small rain cells composed of four or five pixels. Figures 7c and d show the probability density ratios of the three identification methods to the shortest circumference and the smallest area.The MCE circumference provides the closest approximation to rain cells with different pixel numbers,especially for heavy rain cells withN>40.More than four-fifths of the shortest circumference result can be attributed to the MCE method,and the shortest circumference result increases with the number of pixels (Fig.7,blue line).Together with Figs.7a and c,the MCE method shows a very strong effect on the approximation of the circumference of the rain cell.For small rain cells withN<40,there are more results with the shortest circumference from the DIA method than from the MBR method,while the opposite is true for large rain cells withN>40.The MBR method shows most results with the smallest area of large rain cells(N>40),followed by MCE,and finally by DIA.The results vary little among methods when based on the number of pixels,but the identification effects from the MBR method for small rain cells (N<30) is not as good as that from DIA and MCE (Fig.7d).Figures 7b and d show that the approximation effect of MBR on the rain cell area is effective and robust.Although MCE can provide more results designated as the minimum area than DIA,the median of the MCE and DIA area ratio shows that the overall performance of MCE is poor,the identification results of MCE are seriously polarized,and the poor area estimation hinders the performance of MCE. Figure 8 shows the sensitivity of the best and worst approximation effects of the three methods to horizontal geometric features.The best and worst identification results are defined as the shortest circumference and the smallest area. Figures 8a and b show that MCE still produces the most best approximation results for rain cells of various circumferences,and its negative results for large rain cells with circumference greater than 70 km are less than those from the DIA and MBR methods.The MBR method is more suitable for heavy rain cells than the DIA method.When the circumference is greater than 90 km,there are more best identification results from MBR,and the worst identification results of MBR are reduced further when the circumference is greater than 120 km.However,MBR has a poor approximation effect on the circumference of light rain cells.The best identification results from MBR for rain cells with a circumference below 90 km account for less than 10% (Fig.8a),and the contribution rate of the worst identification results with a circumference below 60 km is more than 40% (Fig.8b).Compared with MBR,DIA is more effective in identifying smaller rain cells with circumferences less than 100 km and areas less than 120 km2,while MBR is better than DIA for larger rain cells.The variation of the contribution rate based on the area of the rain cell among the three methods (Figs.8c and d) is basically the same as the variation based on the circumference of the rain cell(Figs.8a and b). Fig.8.Probability density distribution of the circumference,area,and shape factors of the fitted graphic.The black solid lines,blue dotted lines,and red dotted lines represent the DIA,MBR,and MCE methods,respectively,with (a),(c) and (e) giving the best-fit results,and (b),(d) and (f) giving the worst-fit results. Whether the rain cell is slender or fat,MCE provides the best identification results for rain cells with various shape factors;especially for fat rain cells withα>0.55,more than one-third of the best results are attributable to the MCE method,while the least worst results comprise about 12%.However,the worst identification result of MCE is sensitive to the shape factor and elongated rain cells (α>0.5).The more slender the rain cluster,the higher the proportion of the worst identification result from MCE.For rain cells of various shape factors,MBR has the lowest proportion of best identification results (Fig.8e),and its contribution to the worst identification results for fat rain cells (α>0.5) is greater than that of MCE and DIA (Fig.8f).There are very few best identification results in the three methods for slender rain cells (α<0.25),with the proportion of the sample size for all of them being less than 8%. The rotation angle of the main axis of the rain cell is not fixed and is unrelated to the direction of satellite motion,neither parallel to the orbit (along-orbit direction)nor perpendicular to the orbit (cross-orbit direction).Figure 9 shows the identification effects of rain cells at different rotation angles.The rotation angle is defined as the angle between the major axis of the rain cell and the satellite orbit,where 0° indicates that the major axis of the rain cell is along the orbit direction and ±90° indicates that the major axis of the rain cell is perpendicular to the orbit direction. Overall,the probability density distributions of the best and worst identification results show rotation symmetry relative to the direction along the rail–that is,clockwise rotation(θ<0°) and counterclockwise rotation (θ>0°) have the same identification effect.The best and worst identification results show no clear relationship with the rotation direction.The MCE method has a greater effect on best identification results than it does on the worst identification result at any angle (Fig.9c),but there is no clear advantage near the 45° direction (Fig.9c,without red dots).The MBR method results are typically the worst in each quadrant.The probability of obtaining the best fitting result by DIA or MBR has a maximum value around ±60° (±45°),whereas the probability of obtaining the best identification result along the orbit direction (0°) and the cross-orbit direction (±90°) is very low. Fig.9.The probability density distribution of the best and worst fitting graphs under different tilt angles,with (a),(b) and (c) denoting the results of the DIA,MBR and MCE method,respectively.The solid line is the best fitting graph;the dotted line is the worst fitting graph;the red solid circles indicate that the probability of the best fitting is 10% higher than that of the worst fitting;and the blue hollow circles indicates that the probability of the best fitting is 10% lower than that of the worst fitting. Fig.10.Shape features of rain cells identified by (a) DIA,(b) MBR and (c) MCE.Contours represent the boundaries of objects,and the contour approximation can be used to describe and identify the shape of the object,which is convenient for subsequent contour feature extraction and object recognition work. Figure 10 shows the sensitivity of the three methods to the shape of the rain cell.The DIA method tends to identify rain cells as fat circles (0.5 <α<0.8),with few elongated rain cells (Fig.l0a).As a result of their major axis priority strategies,MBR and MCE identify more elongated rain cells.This is particularly the case for slender and small rain cells (0 <α<0.3,N<10),for which there is a stronger contribution from MCE to the identification results than from MBR or DIA.The MCE method also identifies more fat,round rain cells (0.8 <α <0.9),which is another polarization of this method,producing more elongated rain cells and more fat,round ones. The DIA method directly uses the coordinate index of TRMM satellite products to intercept the rain cell area.The four sides of the DIA rectangle,which does not reflect the physical meaning of the rain cell itself,are extracted simply from the satellite orbit in the along-orbit direction and across-orbit direction,without any consideration for the shape of the rain cell.The MBR and MCE methods adopt the strategy of long-axis priority,in which the long side of the MBR and the major axis of the MCE are determined by the two farthest points on the boundary of the rain cell.On this basis,MBR adopts a short-axis asymmetric strategy and MCE adopts a short-axis symmetric strategy,calculating the shortest minor axis on both sides of the major axis,thereby establishing the MBR and the MCE.In this study,the DIA,MBR and MCE methods were used to identify TRMM/PR rain cells,and the differences among the three identification results were compared.The applicability of the three methods was demonstrated by analyzing the sensitivity of the identification results to the macroscopic characteristics (number of rain cells,circumference,area,shape,and tilt angle). These three methods were found to successfully reflect the geometric characteristics of the cloud and geometrically approximate the real situation of the rain cell.The long-axis priority strategy is effective for approximating the circumference and area of the rain cell.Since MBR and MCE adapt to the rotation of the main axis,the identification effect is generally better than that of DIA.The ability of MCE to identify the circumference of rain cells is particularly good.The circumferences of rain cells identified by MCE in most samples are shorter than those identified by DIA and MBR,which are closer to the real rain cells.However,the results of the identification of the area of the rain cell are highly polarized,and the short-axis symmetry strategy will produce more blank filling for asymmetric rain cells.The areas of rain cells identified by MBR are therefore more robust than those identified by the other methods.The DIA method has certain advantages for small rain cells with a circumference of less than 100 km and an area of less than 120 km2,but the overall performance is mediocre.By comparing the circumference and area,MCE can more easily obtain the best fitting results with the shortest circumference and the smallest area for all sizes of rain cells. The results show that MBR is effective and robust in improving the area identification.For rain cells composed of a large number of pixels (N>20),MBR performs better than MCE,but the probability of obtaining the best identification result is less than that of MCE.The best fitting results are consistently obtained by the MCE method,with good performance for rain cells of various sizes,shapes,and rotation angles.As a result,the asymmetric identification rate of some samples is very low because of the short filling area of MCE. The DIA method tends to identify the rain cells as fat circles (0.5 <α<0.8),and few elongated rain cells are obtained as a result of the poor ability of DIA to describe the rotation of rain cells.Thanks to the long-axis priority strategy,the MBR and MCE methods identify more elongated rain cells.This is another kind of polarization of MCE,producing more elongated rain cells and more fat,round rain cells. The probability density distribution of the best and worst identification results shows the rotational symmetry relative to the direction along the track.That is,the identification effects of clockwise rotation and counter-clockwise rotation are basically the same,and the best and worst identification results have no clear relationship with the rotation direction.The probability of DIA or MBR obtaining the best fitting result has a maximum value around ±60° (±45°),while the probability obtaining the best identification result is very low in the along-track direction (0°) and across-track direction(±90°). The approximation method of MBR and MCE can also be used to extract information for other meteorological elements,such as identifying the geometric characteristics and evolution process of high-temperature and low-temperature regions.Moreover,the application of these methods is not limited to satellite data but can be applied to reanalysis data and forecast products.On that basis,these approximation methods could be used to construct a simplified atmospheric model composed of numerous and varied air masses. Acknowledgements.This study was supported by the National Natural Science Foundation of China (Grant Nos.U20A2097,42075087,91837310) and the National Key Research and Development Program of China (Grant No.2021YFC3000902).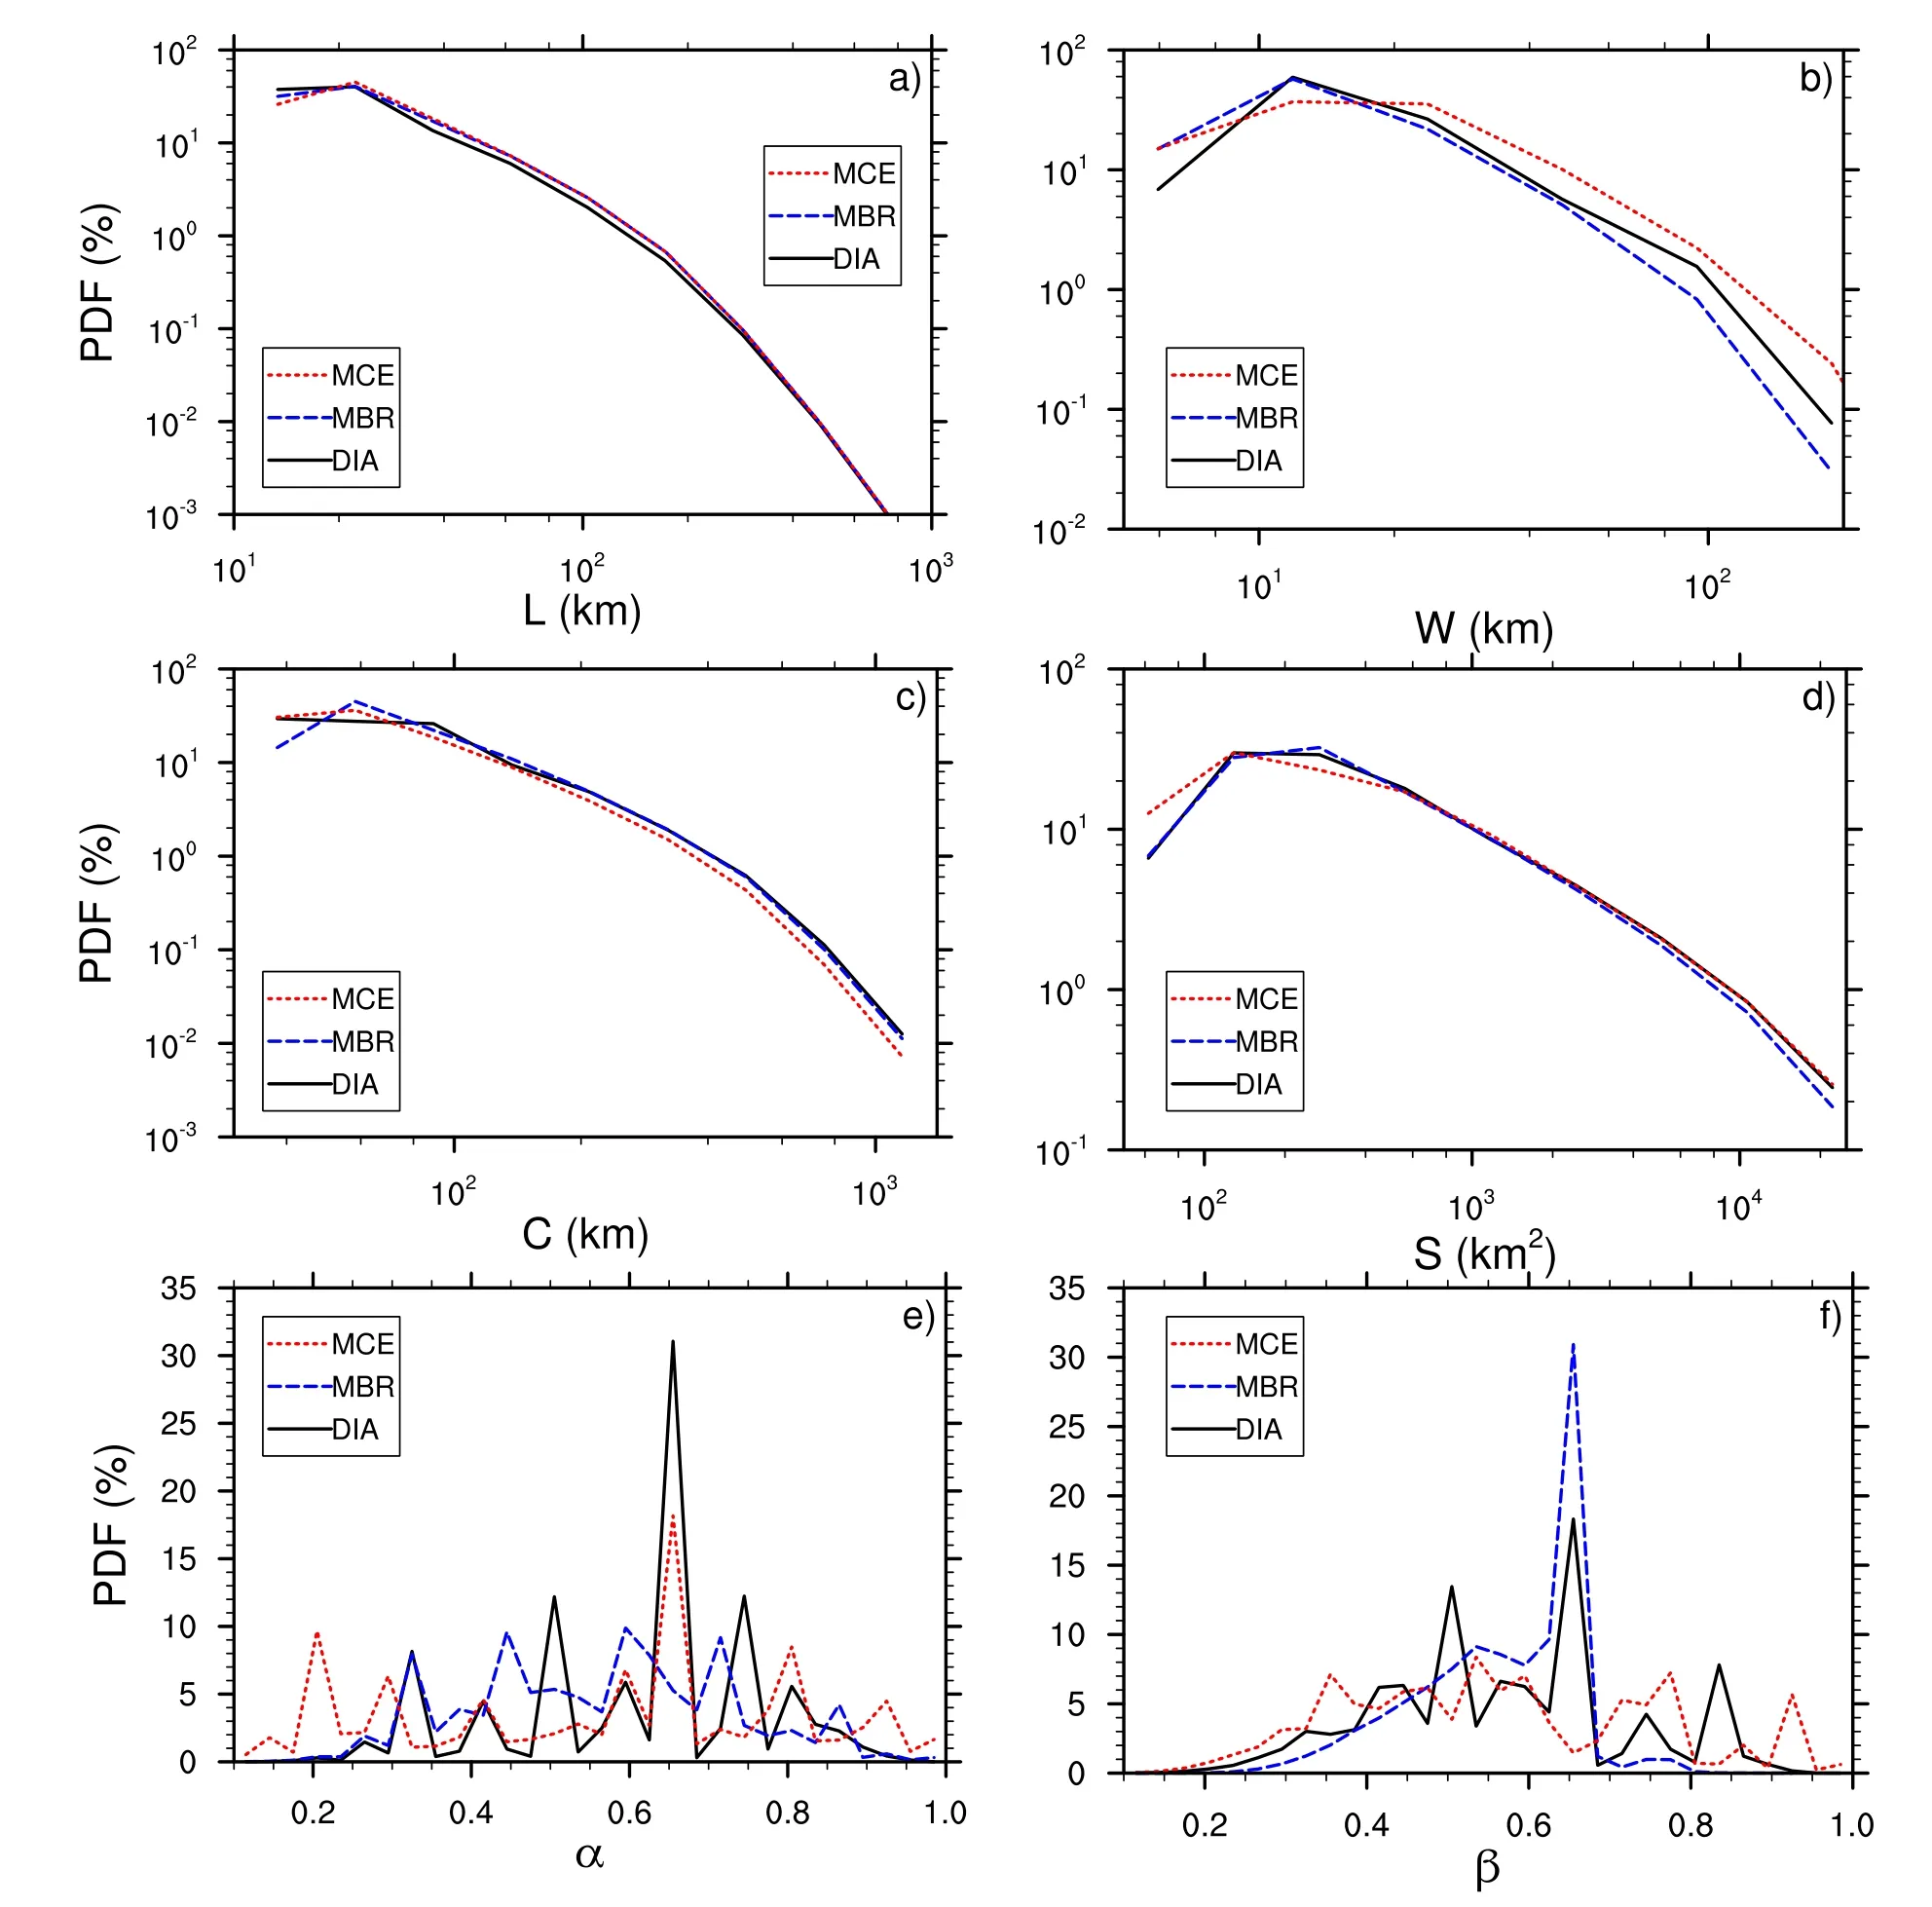

4.Applicability of the three identification methods to different rain cells


5.Summary
杂志排行

Advances in Atmospheric Sciences的其它文章
- The First Global Map of Atmospheric Ammonia (NH3) as Observed by the HIRAS/FY-3D Satellite
- Cloud-Type-Dependent 1DVAR Algorithm for Retrieving Hydrometeors and Precipitation in Tropical Cyclone Nanmadol from GMI Data
- Assessment of Crop Yield in China Simulated by Thirteen Global Gridded Crop Models
- A Study on the Assessment and Integration of Multi-Source Evapotranspiration Products over the Tibetan Plateau
- Downscaling Seasonal Precipitation Forecasts over East Africa with Deep Convolutional Neural Networks
- Seasonal Variation of the Sea Surface Temperature Growth Rate of ENSO