Assessment of Crop Yield in China Simulated by Thirteen Global Gridded Crop Models
2024-03-26DezhenYINFangLIYaqiongLUXiaodongZENGZhongdaLINandYanqingZHOU
Dezhen YIN ,Fang LI* ,Yaqiong LU ,Xiaodong ZENG ,Zhongda LIN ,and Yanqing ZHOU
1International Center for Climate and Environment Sciences, Institute of Atmospheric Physics,Chinese Academy of Sciences, Beijing 100029, China
2University of Chinese Academy of Sciences, Beijing 100049, China
3Institute of Mountain Hazards and Environment, Chinese Academy of Sciences, Chengdu 610041, China
4State Key Laboratory of Numerical Modeling for Atmospheric Sciences and Geophysical Fluid Dynamics,Institute of Atmospheric Physics, Chinese Academy of Sciences, Beijing 100029, China
5State Key Laboratory of Desert and Oasis Ecology, Xinjiang Institute of Ecology and Geography,Chinese Academy of Sciences, Urumqi 830011, China
ABSTRACT Global gridded crop models (GGCMs) have been broadly applied to assess the impacts of climate and environmental change and adaptation on agricultural production.China is a major grain producing country,but thus far only a few studies have assessed the performance of GGCMs in China,and these studies mainly focused on the average and interannual variability of national and regional yields.Here,a systematic national-and provincial-scale evaluation of the simulations by 13 GGCMs [12 from the GGCM Intercomparison (GGCMI) project,phase 1,and CLM5-crop] of the yields of four crops(wheat,maize,rice,and soybean) in China during 1980–2009 was carried out through comparison with crop yield statistics collected from the National Bureau of Statistics of China.Results showed that GGCMI models generally underestimate the national yield of rice but overestimate it for the other three crops,while CLM5-crop can reproduce the national yields of wheat,maize,and rice well.Most GGCMs struggle to simulate the spatial patterns of crop yields.In terms of temporal variability,GGCMI models generally fail to capture the observed significant increases,but some can skillfully simulate the interannual variability.Conversely,CLM5-crop can represent the increases in wheat,maize,and rice,but works less well in simulating the interannual variability.At least one model can skillfully reproduce the temporal variability of yields in the top-10 producing provinces in China,albeit with a few exceptions.This study,for the first time,provides a complete picture of GGCM performance in China,which is important for GGCM development and understanding the reliability and uncertainty of national-and provincial-scale crop yield prediction in China.
Key words: global gridded crop model,historical crop yield,China,multi-model evaluation
1.Introduction
China is the largest producing country of wheat and rice,the second largest producer of maize,and the fourth largest producer of soybean in the world as of 2020,with a share of about 18%,28%,22%,and 6% of the global production,respectively (FAOSTAT,2022).China has approximately 136 million hectares of cropland,ranking it third in the world,where crop production feeds around 22% of the world’s population (Ghose,2014;FAO,2021).With population expansion,economic growth,and urbanization in China,concerns arise regarding its future ability to feed itself and related global impacts (Zhao et al.,2021).Therefore,understanding and predicting the spatiotemporal variability of wheat,maize,rice,and soybean yield in China is vital for food security,global grain trade,and achieving the second goal of UN Sustainable Development.
The temporal and spatial variability of crop yield is affected by climatic and environmental conditions,agronomic management (such as fertilizer application,irrigation,and timing of sowing),and genetic strategies (Kukal and Irmak,2018).Ray et al.(2015) demonstrated that climate variability explained approximately one-third of yield variability in China.In North China,irrigation (Wang et al.,2008),high levels of soil organic carbon and nitrogen (Tian et al.,2019),and appropriate harvest and sowing dates (Sun et al.,2007) can enhance crop yield.Xiao and Tao (2014) and Liu et al.(2013) disentangled the relative contributions of different factors and highlighted the importance of agronomic managements and cultivar improvement for winter wheat on the North China Plain and rice in East China by combining field experiments with a process-based crop model.Yu et al.(2012) demonstrated using the Agro-C model that rice genetic improvement was the principal driver of China’s rice production,especially after nitrogen fertilizer application declined.
Global gridded crop models (GGCMs) are globally consistent and grid-and process-based crop modeling systems that represent crop growth processes and their linear and nonlinear responses to various driving factors in different crop phenological stages (Müller et al.,2017).GGCMs can be separated into two categories: site-based and those used in ecosystem models.Both are derived from a field-scale crop model,but the latter also considers the biophysical and biogeochemical influence of agriculture on the land surface and has become an important component of land surface and Earth system models (Levis et al.,2012;Wu et al.,2016;Müller et al.,2017;Lombardozzi et al.,2020).They have been increasingly applied for assessing climate change impacts,adaptation,and environmental impacts of agricultural production (e.g.,Lobell et al.,2006;Rosenzweig et al.,2014;Yin et al.,2015;Jägermeyr et al.,2020).Comprehensive evaluation of GGCMs’ historical simulations is essential for understanding the reliability of GGCMs in these applications.
The Global Gridded Crop Model Intercomparison(GGCMI) was initiated in 2012,coordinated by the Agricultural Model Intercomparison and Improvement Project and the Inter-Sectoral Impacts Model Intercomparison Project(Elliott et al.,2015).It aims to bring together a diverse international community of crop modelers for climate impact assessment as well as model intercomparison and improvement at the global scale,using the same and standardized protocol (Elliott et al.,2015).So far,the first two phases of GGCMI have been completed,i.e.,historical yield simulations (Phase 1,Elliott et al.,2015) and sensitivity simulations of yield responses to different atmospheric CO2,temperature,water,and nitrogen levels (Phase 2,Franke et al.,2020).Three simulation scenarios were included in GGCMI phase 1: (1) default: management and technology assumptions and growing seasons that models typically use for simulations in the historical period,presenting the best performance of each model;(2) fullharm: harmonized growing seasons and nitrogen fertilizer inputs;and (3) harmnon: the same as fullharm but with unlimited nitrogen fertilizer supply(Elliott et al.,2015).
Müller et al.(2017) evaluated the average and interannual variability pattern (quantified by temporal correlation)of GGCMI phase 1 default simulations and pointed out that the observed pattern of wheat,soybean,and maize yield can be partly reproduced by these models at the global scale and for top-10 producing countries.Li et al.(2022) assessed the performance of nine models in the GGCMI phase 1 fullharm scenario in simulating the average and interannual variability of yield in seven regions of China and concluded that GGCMI models simulated regional yields of maize better than other grain crops and pointed out the best model of each region.Until now,however,no study has evaluated the performance of GGCMI models in reproducing the observed spatial pattern and trend of crop yield in China(the trend is much stronger than the interannual variability for China’s crop yield;see Fig.3 later in the paper),or on the provincial scale to guide provincial agricultural management.
CLM5-crop is version 5 of the Community Land Model(CLM5) with modeling of actively managed crops(Lawrence et al.,2019;Lombardozzi et al.,2020).It was a GGCM developed from CLM4.5post-crop used in GGCMI phase 1 (Levis et al.,2012,2018) by Lombardozzi et al.(2020).It is the only GGCM worldwide used formally in an Earth system model (CESM2) and its code is open to the public.Lombardozzi et al.(2020) evaluated its skill on the global scale,but the performance of CLM5-crop in simulating crop yield in China is still unclear.
In this study,we perform a comprehensive national and provincial evaluation of yield simulations of the four main grain crops (i.e.,wheat,maize,rice,and soybean) in China made by 12 models from the GGCMI phase 1 default scenario and CLM5-crop to provide a complete picture of GGCM performance.The systematical analyses,which include spatial and temporal evaluations such as the average,spatial pattern,long-term trend,and the magnitude and pattern of interannual variability,are conducted by comparing model simulations with collected national and provincial observations for 1980–2009.
2.Data and methods
2.1.GGCMs
This study evaluates the performance of 13 GGCMs(Table 1) in simulating crop yield in China.Among them,12 GGCMs (CLM4.5post-crop,LPJ-GUESS,LPJmL,ORCHIDEE-crop,PEGASUS,CGMS-WOFOST,EPICBoku,EPIC-IIASA,GEPIC,pAPSIM,pDSSAT,and PEPIC) are from GGCMI phase 1.Simulation data of the 12 GGCMI models were obtained from Müller et al.(2019).The 12 models were selected with the exclusion of EPICTAMU and PRYSBI2 because EPIC-TAMU did not provide default simulations and PRYSBI2 did not distinguish between rainfed and irrigated crops required by the GGCMI protocol (Elliott et al.,2015).

Table 1.Summary of the GGCMs used in this study.
In this study,simulations of the default scenario in GGCMI that present the highest simulation skill of each model are used to evaluate the model performance (section 3) and simulations of the fullharm and harmnon scenarios are compared to investigate the simulated response of yield to nitrogen fertilization (section 4).Additionally,simulations of the default scenario are also used to investigate the simulated response of yield to climate in section 4.Furthermore,the GGCMI simulations were run at a spatial resolution of 0.5° for 1980–2010 and were driven by the climate dataset AgMERRA (Ruane et al.,2015).Our study uses the simulations for the period 1980–2009 because the yields in 2010 could be missed due to their method of assigning simulations to calendar year (Elliott et al.,2015).
CLM5-crop had several primary developments compared to CLM4.5post-crop used in GGCMI phase 1,including the ability to simulate transient crop distribution and crop management due to the introduction of dynamic land units(carbon,nitrogen,water,and energy are conserved during all transitions),phenological triggers that vary with latitude,and tuning of allocation and phenological parameters (Lombardozzi et al.,2020).The phenology phases are governed by the growing-degree-day threshold values,and the management strategies include cropland expansion,fertilization,and irrigation (Lombardozzi et al.,2020).A detailed description of CLM5-crop can be found in technical documentation(https://www.cesm.ucar.edu/models/cesm2/land/CLM50_Tech_Note.pdf).
In this study,we performed a transient 1850–2009 run of CLM5-crop (component name: IHistClm50BgcCrop).The simulations were driven by atmospheric forcing (precipitation,temperature,specific humidity,surface pressure,wind speed,and solar radiation) from GSWP3v1,with a 0.9°(latitude) × 1.25° (longitude) horizontal resolution.Crop distribution,industrial fertilizer,and irrigated area were derived from Land Use Harmonization Version 2 (Hurtt et al.,2011).
2.2.Benchmarks
The wheat,maize,rice,and soybean yields of 31 provinces (autonomous regions or municipalities) during 1980–2009 were collected from the National Bureau of Statistics of China (NBSC,https://data.stats.gov.cn/easyquery.htm?cn=E0103).The planting area and nitrogen fertilizer application rate were also obtained from the NBSC.The growing season of wheat,maize,and rice obtained from ChinaCropPhen1km (Luo et al.,2020) and climate data obtained from CN05.1 (Wu and Gao,2013) were used to calculate growing season temperature and precipitation.
2.3.Aggregating simulated yield data
In order to compare with the yield observations,which were available at provincial and national scales,gridded simulations were aggregated into provincial and national yieldY(t) for yeartfor each grain crop type using the areaweighted average method:
Here,yis the gridded simulated yield andais the harvested area in grid celliunder fully irrigated (ir) or purely rainfed(rf) conditions for GGCMI models and for irrigated crop functional types (CFTs) and rainfed CFTs for CLM5-crop.Because the GGCMI models simulated crops on all agricultural lands no matter which type of crop was planted and whether irrigated or rainfed methods were used in the real world (Elliott et al.,2015),MIRCA2000,with a spatial resolution of 30 arc minutes (Portmann et al.,2010),was used to calculate the harvested area of gridded irrigated/rainfed crop types,following Müller et al.(2017).
2.4.Statistical analyses
This study performs a systematic evaluation of GGCMs in simulating crop yield in China,including the multi-year average of national yield,spatial pattern,long-term trend,pattern and magnitude of interannual variability,and temporal variability of yield in top-10 producing provinces.
The Pearson correlation coefficient is used to evaluate the ability (skill) of models to reproduce the observed spatial or temporal variability pattern,following many earlier evaluation studies (e.g.,Sperber et al.,2013;Müller et al.,2017;Li et al.,2019).The Pearson correlation coefficient is a number between -1 and 1 that measures the strength and direction of the linear relationship between two variables.The simulation skill is higher if the Pearson correlation coefficient between simulations and observations is closer to 1.Student’st-test was used to assess its significance.If the Pearson correlation coefficient between simulations and observations is positive and significant,then the simulations are skillful.Spatial correlation is used to evaluate the similarity of spatial distribution between observations and simulations,while temporal correlation is used to evaluate the similarity of observed and simulated time series for a province or for the national average.
We estimated the long-term trend using the ordinary least-squares method.The significance was tested using the Mann–Kendall test.
The detrended component of time series was regarded as the interannual variability.Its amplitude and pattern were quantified using the coefficient of variation (CV,the standard deviation divided by the mean) and the Pearson correlation coefficient,respectively.
As the multi-model ensemble (MME) mean can represent the overall performance of multiple models and often performs better in reproducing observations than individual models (Martre et al.,2015;Wallach et al.,2018),the MME was calculated as the average of the GGCMs.Furthermore,we used standard deviation (SD) to estimate the intermodel spread.
The normalized root-mean-square error (RMSE) [Eq.(2);Li et al.,2022] of anomalies was applied to evaluate the temporal variability of simulated yield for top-10 producing provinces.The mean null model (temporal mean of observations) (Hantson et al.,2020),also called the climatology forecast in meteorology (Li,2011),was used to assess whether a GGCM was skillful.
whereysim,iandyobs,iare the simulated and observed yield in yeari,andnis the number of years.
3.Results
3.1.Multi-year average of national yield
GGCMI models generally underestimate national rice yield but overestimate yield for the other three crops [Fig.1,Table S1,in the Electronic Supplementary Material (ESM)].The observed,1980–2009 averaged national crop yields are 3.51×10-1,4.49×10-1,5.79×10-1,1.53×10-1kg m-2for wheat,maize,rice,and soybean,respectively,while the GGCMI MME yields are 3.94×10-1,5.59×10-1,4.36×10-1,2.16×10-1kg m-2(Table S1,in the ESM).The MMEs overestimate the crop yield of wheat,maize,and soybean by 12%,24%,and 41%,respectively,but underestimate rice by 25%.Among the twelve GGCMI models,seven,nine,and ten models overestimate the yield of wheat,maize,and soybean,among which CGMS-WOFOST simulates yields more than twice those observed for soybean (Figs.1a,b and d).Seven out of ten models underestimate the rice yield,among which CLM4.5post-crop,LPJ-GUESS,and EPIC-Boku simulate a yield less than half that observed (Fig.1c).EPICIIASA performs the best for wheat,maize,and rice,and PEGASUS does the best for soybean (Fig.1).The GGCMI models show large intermodel spread,with the maximum spread of 2.26×10⁻¹kg m-2for rice and the minimum of 0.84×10⁻¹kg m-2for soybean (Table S1,in the ESM).
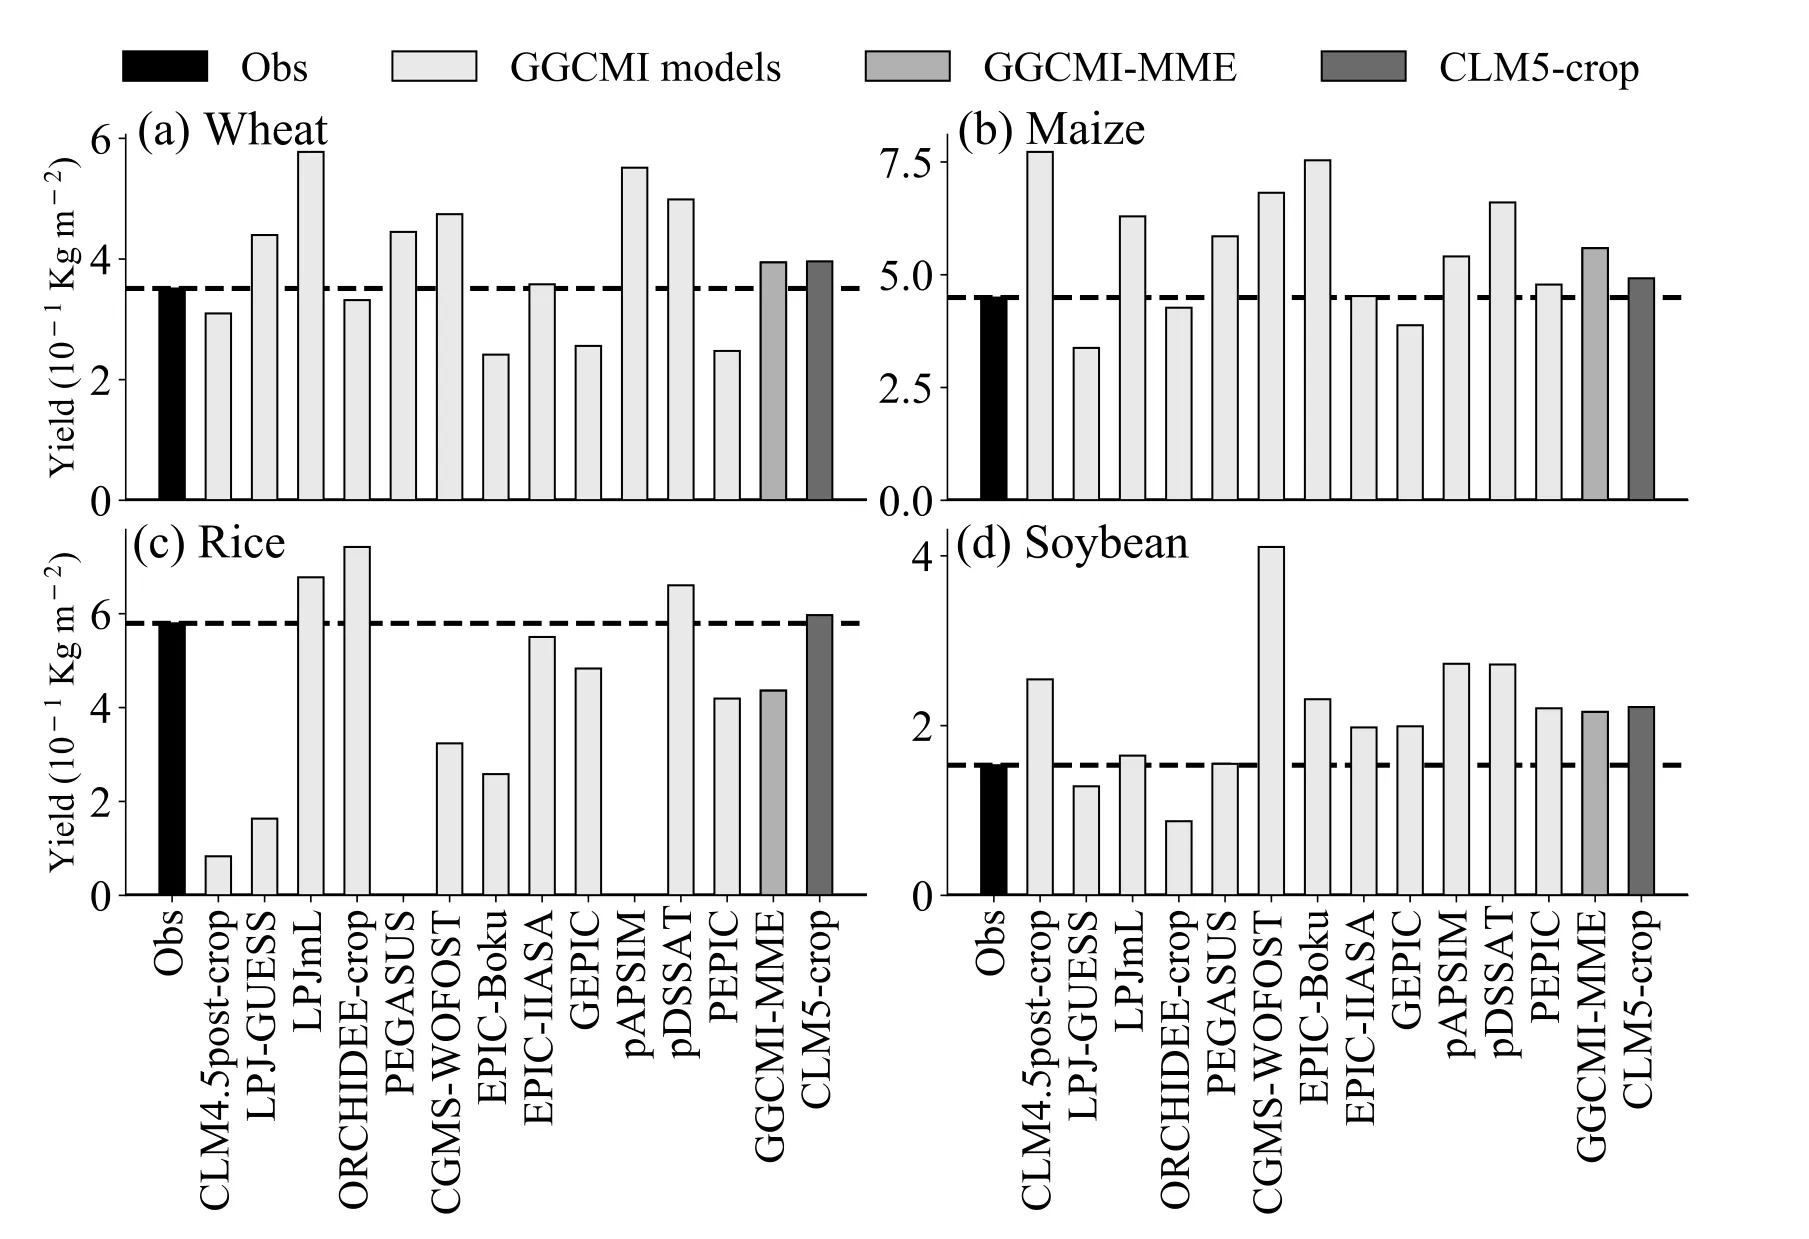
Fig.1.Multi-year average national yield (units: 10-1 kg m-2) for (a) wheat,(b) maize,(c) rice,and (d)soybean,from observations and GGCM simulations for 1980–2009.See Table S1 (in the ESM) for values corresponding to the bars.
CLM5-crop reproduces the national yields of wheat,maize,and rice well,but overestimates the soybean yield by 45% (Fig.1).It outperforms most GGCMI models for wheat,maize,and rice,and is close to or even better than the GGCMI-MME (Fig.1,Table S1,in the ESM).
3.2.Spatial pattern
Most of the GGCMs fail to reproduce the spatial patterns of crop yields (Fig.2).No model can skillfully simulate the spatial pattern for wheat.Only one model is skillful for maize (PEGASUS) and for rice (EPIC-IIASA),and two models are skillful for soybean (LPJmL and CLM5-crop) (Fig.2).Some of the models even simulate a significant negative correlation (e.g.,EPIC-Boku for wheat,LPJmL for maize) (Figs.S1h and S2d,in the ESM).Most of the GGCMs overestimate the yield in Southwest China for wheat (Fig.S1,in the ESM)and maize (Fig.S2,in the ESM).The models with significant negative spatial correlation for rice (CLM4.5post-crop and LPJ-GUESS) tend to simulate high yields in southern China(Figs.S3b and S3c,in the ESM).
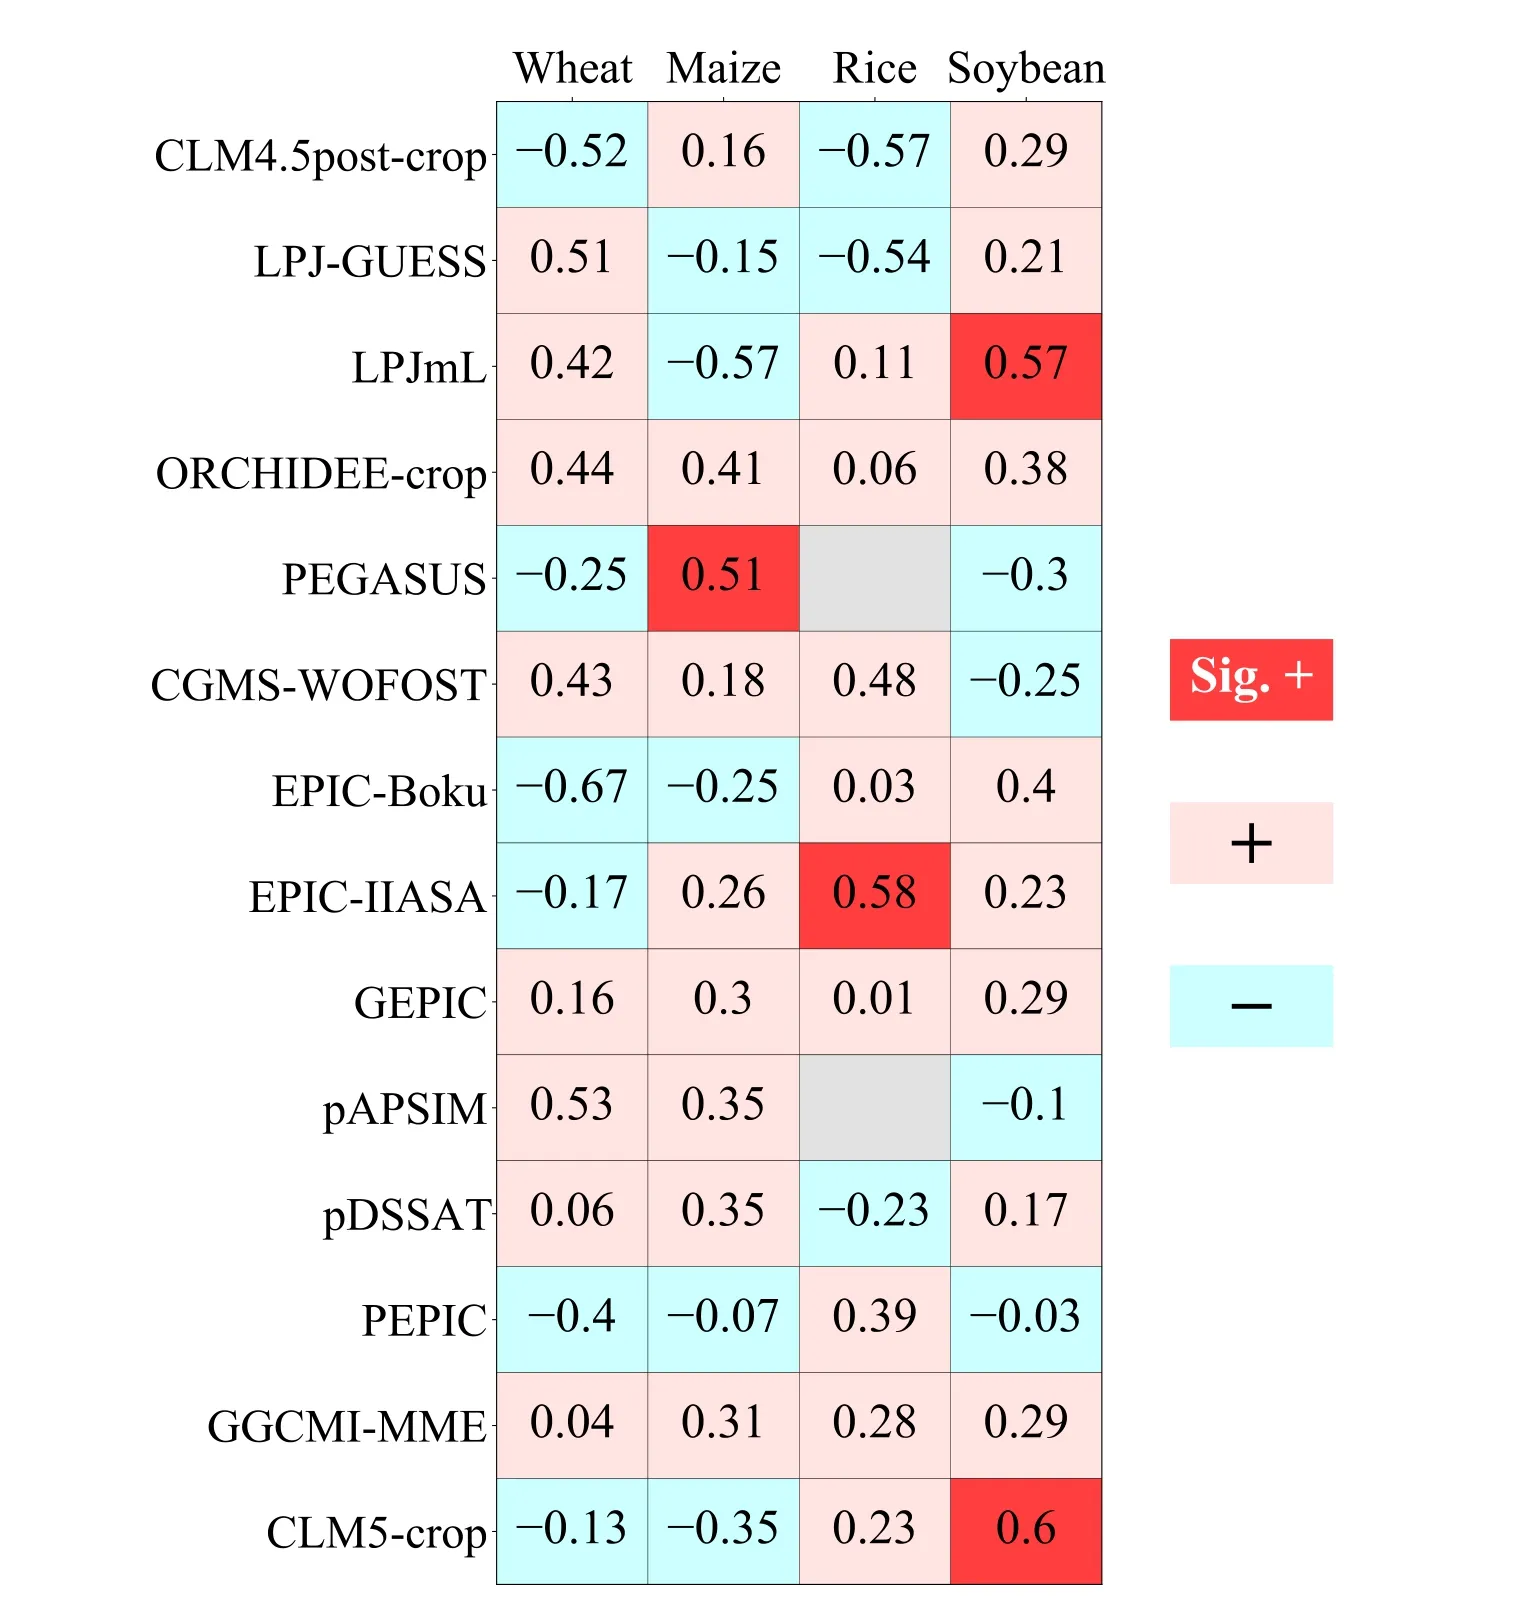
Fig.2.Spatial correlation between observations and simulations for four crop types.Only provinces where production accounts for more than 1% of the national total are considered.See Figs.S1–S4 (in the ESM) for spatial distribution of crop yields corresponding to this figure.
3.3.Temporal variability
3.3.1.Trend
The observed national yields show significant increases during 1980–2009 for all four crop types (Fig.3),with trends of 0.080×10-1,0.074×10-1,0.065×10-1,and 0.020×10⁻¹kg m-2yr-1for wheat,maize,rice,and soybean,respectively (Table S2 in the ESM).The long-term trend is much stronger than the interannual variability for wheat,maize,and rice (Figs.3a–c),with the SDs of the former being 3.6,2.2,and 2.3 times the latter,respectively.
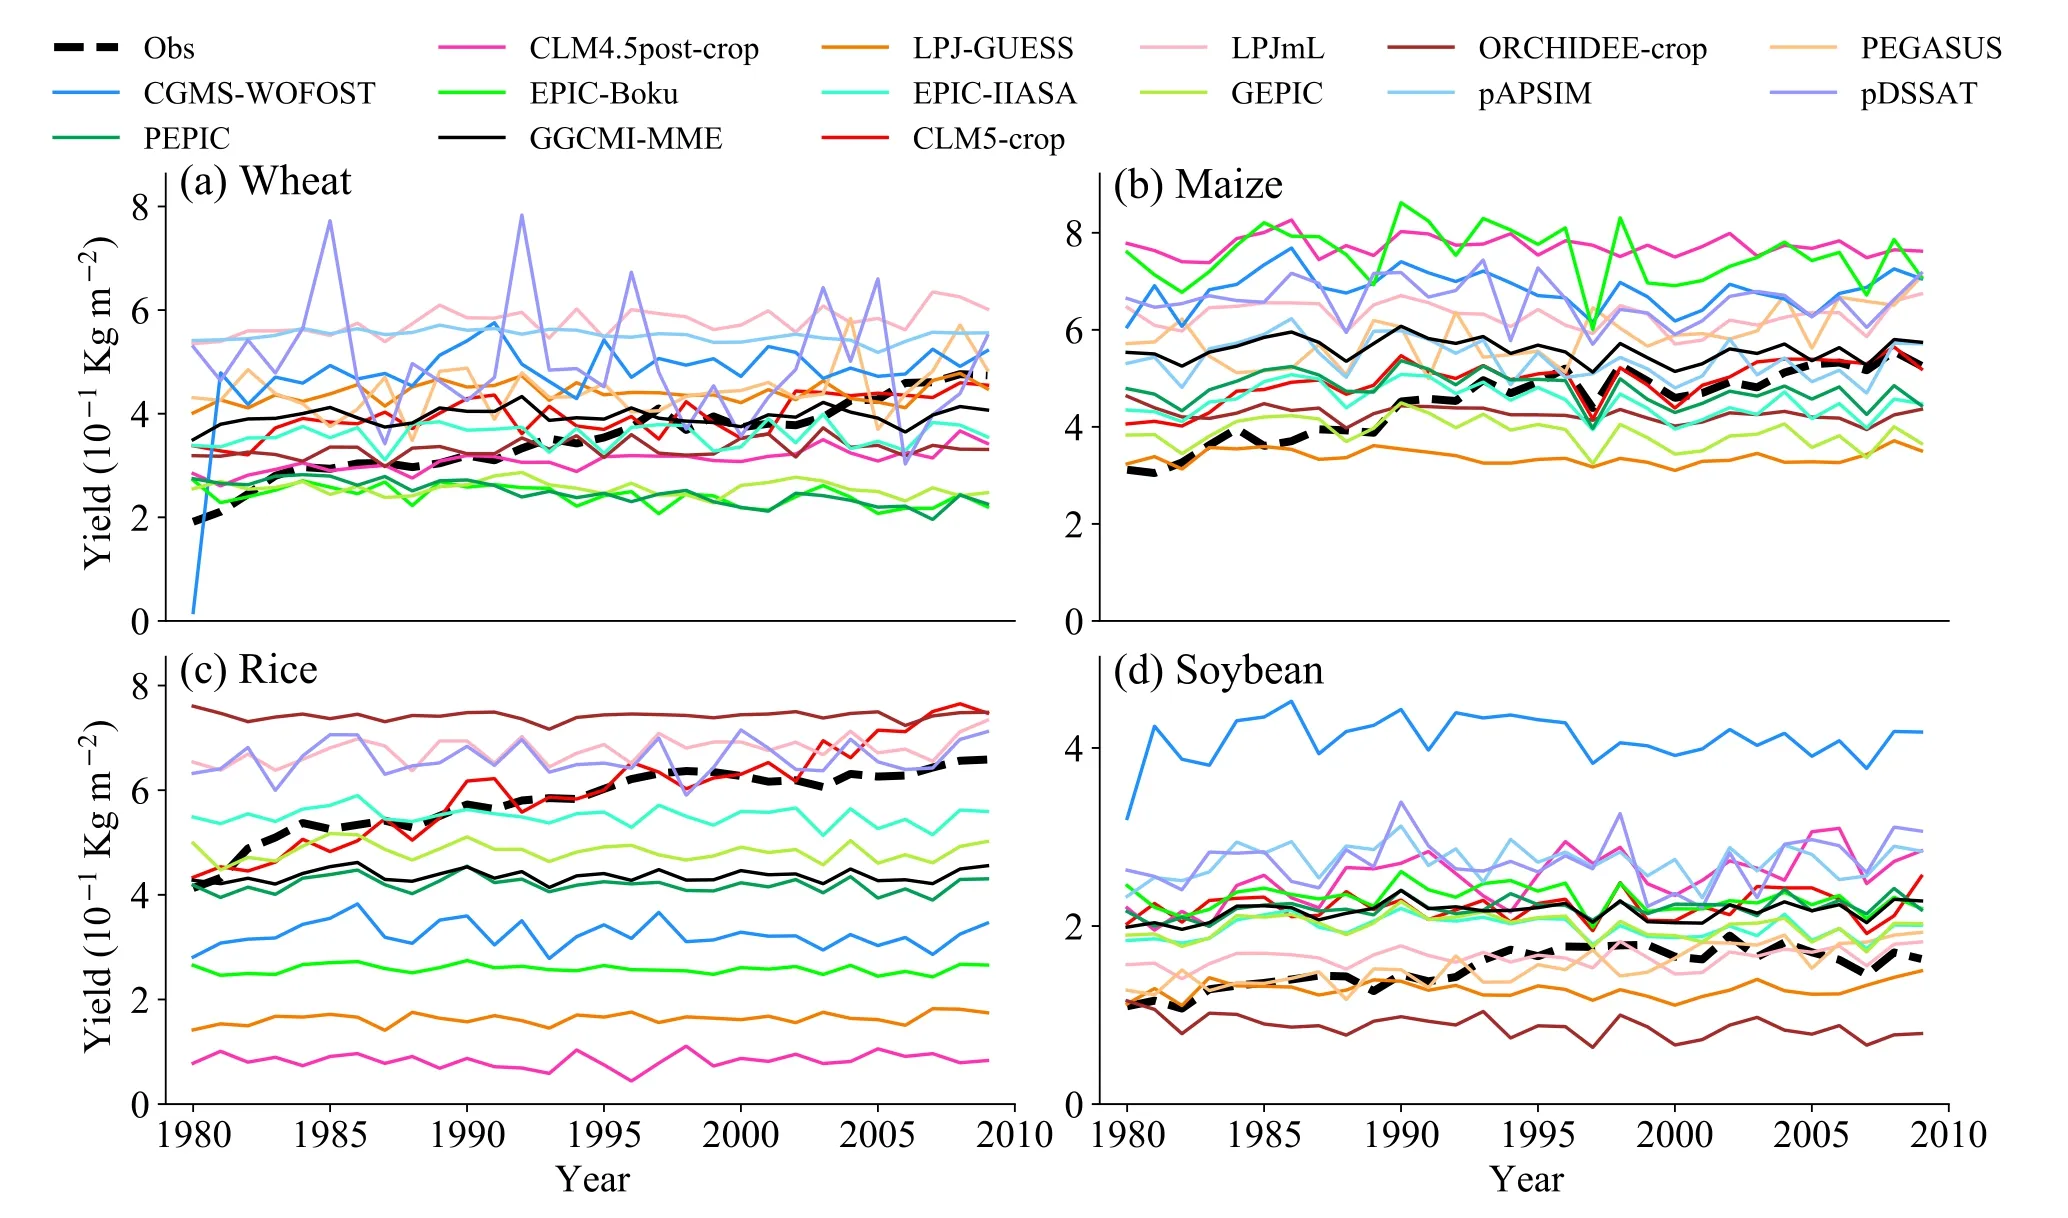
Fig.3.Temporal change in observed and simulated yield for (a) wheat,(b) maize,(c) rice,and (d) soybean in China in 1980–2009.Lines in warm colors are for ecosystem models and lines in cool colors are for site-based models.
Most of the GGCMI models and the MME fail to capture the significant upward trends (Figs.3–4).Some of the ecosystem models,as well as CGMS-WOFOST,can capture the significant increases,but with lower trend magnitude,except CLM4.5post-crop and PEGASUS for soybean (Fig.4).Contrary to the observations,all of the GGCMI models except PEGASUS simulate a decreasing trend in national maize yield (Fig.4b).

Fig.4.Long-term trend (units: 10-1 kg m-2 yr-1) of observed and simulated national yield for (a) wheat,(b) maize,(c)rice,and (d) soybean in 1980–2009.A star above the bar denotes statistical significance according to the Mann–Kendall test at the 0.05 level.See Table S2 (in the ESM) for values corresponding to the bars.
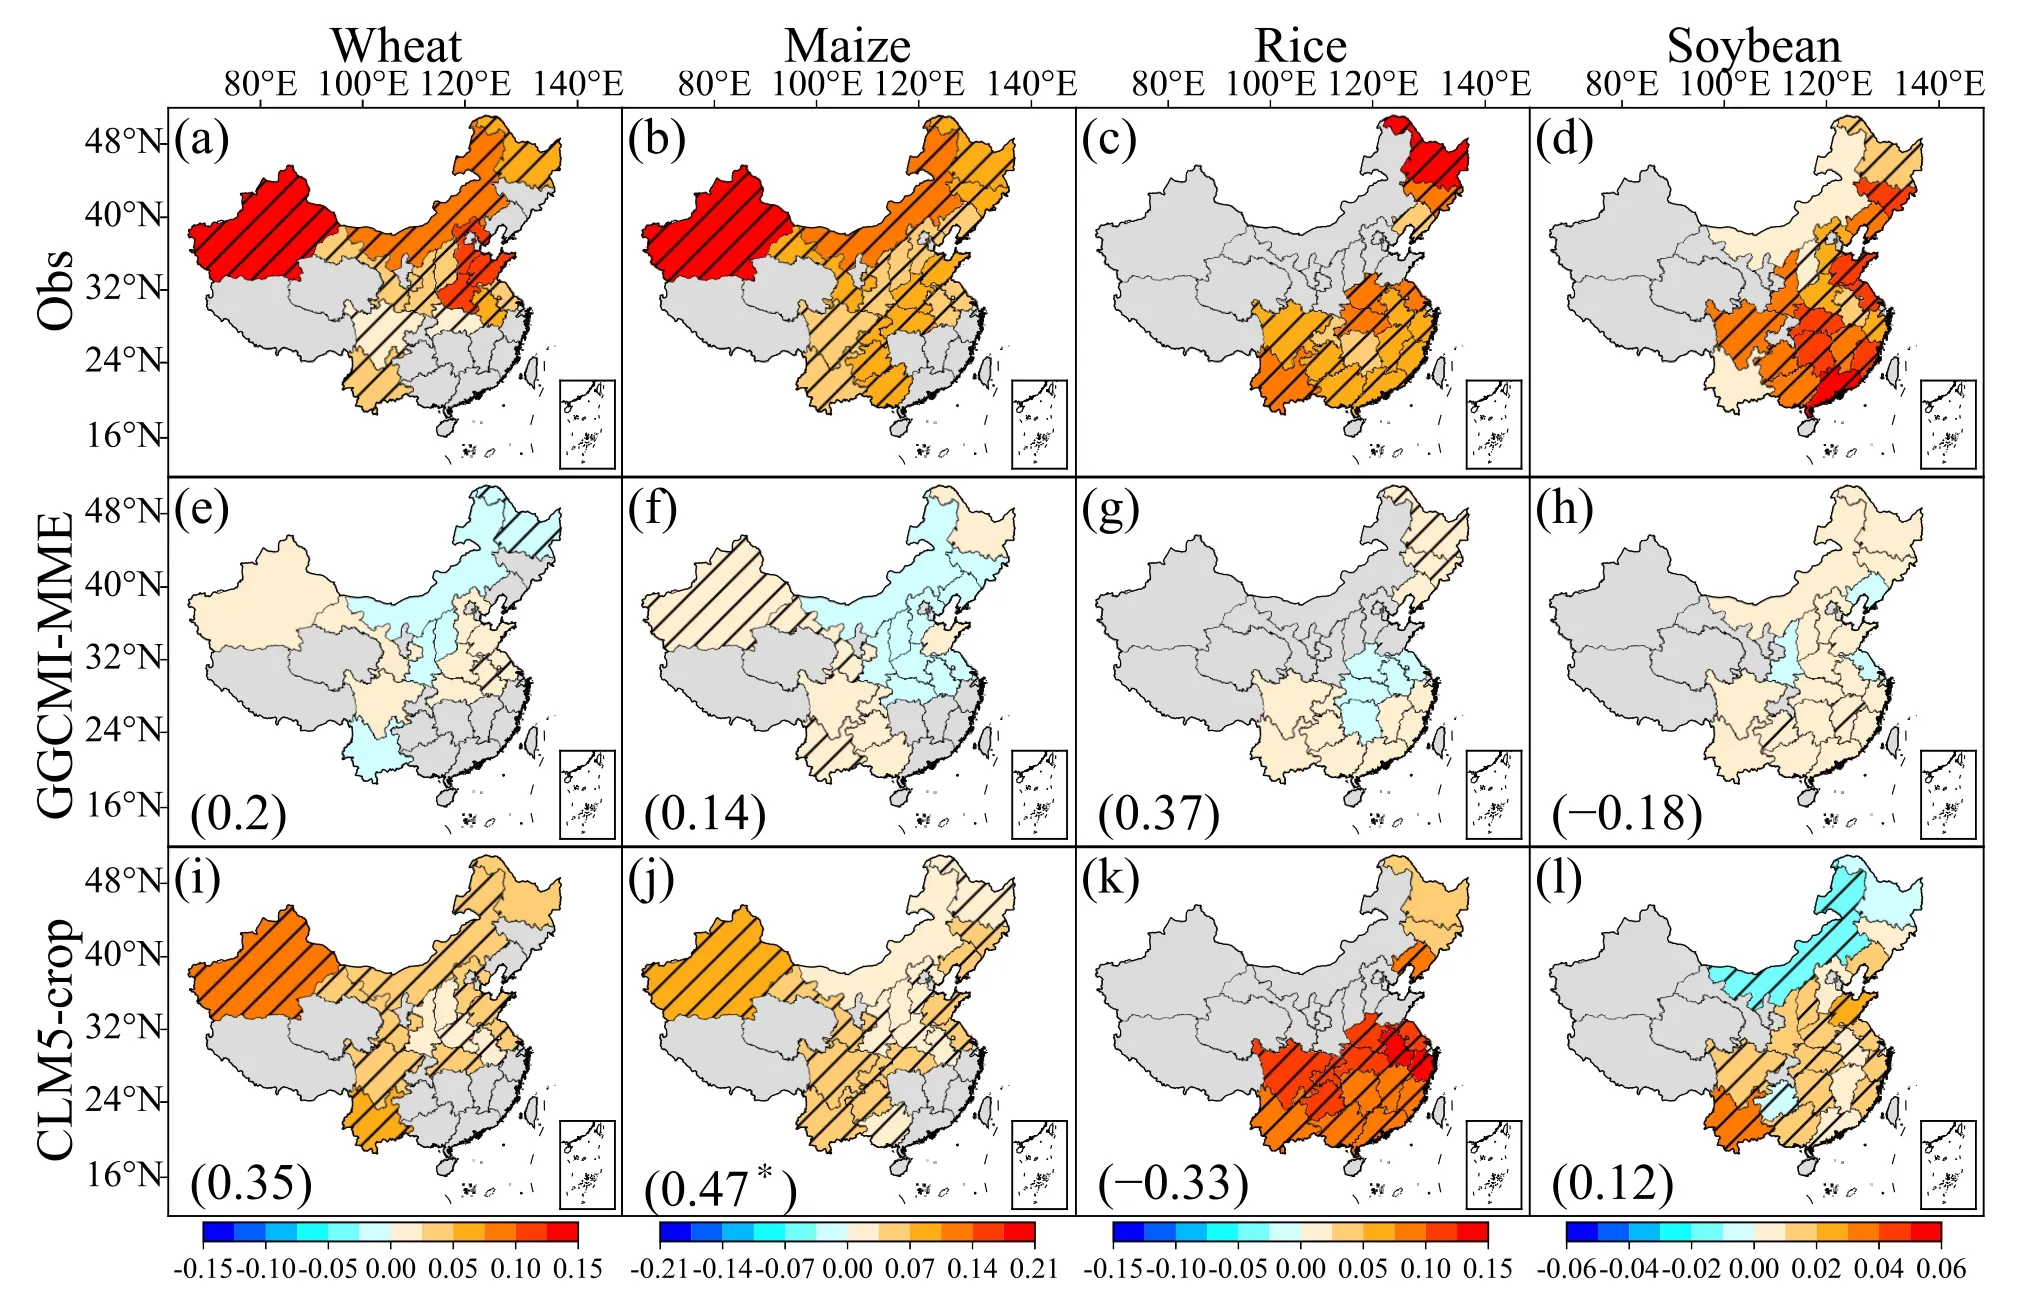
Fig.5.Spatial distribution of the long-term trend (units: 10-1 kg m-2 yr-1) of observations,the MME of GGCMI models,and CLM5-crop for four crops during 1980–2009.Provinces with a significant trend (p <0.05) are striped.Provinces where production accounts for more than 1% of the national total are considered and the numbers in parentheses are the spatial correlation coefficient between observed and simulated trends.An asterisk (*) denotes statistical significance according to Student’s t-test at the 0.05 level.See Figs.S5–S8 (in the ESM) for the spatial distribution of individual GGCMI models.
CLM5-crop simulates an upward trend in national yield for all crop types and successfully captures the significant increases in wheat,maize,and rice,even though it also underestimates the trend magnitude for wheat and maize (Fig.4).It outperforms 11 of the 12 GGCMI models for wheat,maize,and all models for rice,as well as the GGCMI-MME for wheat,maize,and rice (Fig.4,and Table S2 in the ESM).
Similar to the above national results,observed yields exhibit a significant increasing trend over most provinces for the four crop types (Figs.5a–d).The GGCMI MME fails to capture the significant upward trend in most provinces (Figs.5e–h),whereas individually,CLM4.5postcrop does (for wheat) and CLM4.5post-crop and PEGASUS also do (for soybean) (Figs.S5a,S8a,and S8e,in the ESM).In contrast,CLM5-crop captures the significant upward trend in most provinces for wheat,maize,and rice,but generally underestimates the trend magnitude,except for rice,and incorrectly locates the high values for wheat,rice,and soybean (Figs.5i–l).
3.3.2.Interannual variability
The magnitude of the interannual variability of the observed yield is weak,with CVs of 0.06 for wheat,0.07 for maize,0.04 for rice,and 0.09 for soybean (Table S3,in the ESM).Overall,the GGCMs can reproduce the small values,except for PEGASUS (CV=0.11),CGMS-WOFOST(CV=0.18),and pDSSAT (CV=0.23) for wheat,and CLM4.5post-crop (CV=0.17) for rice (Fig.6,Table S3 in the ESM).Several models reproduce less than half the observed interannual variation,e.g.,pAPSIM (CV=0.02)for wheat,CLM4.5post-crop (CV=0.03) and ORCHIDEEcrop (CV=0.03) for maize,ORCHIDEE-crop (CV=0.01)for rice,and PEPIC (CV=0.04) for soybean (Table S3,in the ESM).CLM5-crop performs better than GGCMI MME for maize,rice,and soybean (Fig.6).

Fig.6.As in Fig.1 but for the amplitude of interannual variability,which is calculated using the coefficient of variation (CV) of detrended time series.See Table S3 (in the ESM) for values corresponding to the bars,and Figs.S9–S13 (in the ESM) for spatial distribution of CVs.
Spatially,the observational interannual variability is higher in the northeastern region of China for wheat and maize,northeastern and southwestern regions for rice,and middle reaches of the Huanghe River,northeastern region,and southwestern region for soybean (Fig.S9,in the ESM).The GGCMI MME simulates the spatial pattern of CV for maize (Fig.S9f,in the ESM) and soybean (Fig.S9h,in the ESM) reasonably well.The GGCMI models simulate the spatial pattern best for maize,with seven out of twelve models showing significant positive spatial correlation with observations (Fig.S11,in the ESM).Furthermore,those models with significant positive spatial correlation can generally capture the high CVs in the northeastern region,while those models with significant negative spatial correlation are inclined to simulate high CVs in the southern region (Figs.S10–S13,in the ESM).CLM5-crop can reproduce the spatial pattern of CV for rice and soybean reasonably well,with a significant spatial correlation of 0.55 and 0.61,respectively (Figs.S9k–l,in the ESM).For wheat (Fig.S9i,in the ESM) and maize (Fig.S9j,in the ESM),CLM5-crop generally simulates relatively high CVs in northwestern China,where the observational CVs are actually low.
GGCMI site-based models generally perform better in terms of modeling the interannual variability pattern of national yield,especially for maize (Fig.7).For GGCMI models,all significant positive correlations are simulated by site-based models (Fig.7).The MME of GGCMI site-based models shows higher simulation skill for all four crops(0.23,0.57,0.33,and 0.34) than the MME of GGCMI ecosystem models (0.1,-0.02,0.05,and -0.06) (Fig.7,Table S4,in the ESM).The site-based models perform the best for maize,with four out of seven models exhibiting significant positive correlation with observations and a significant correlation of 0.57 for the site-based MME (Fig.7,Table S4,in the ESM).CLM5-crop can simulate the interannual variability pattern of maize well,with a significant correlation of 0.64,but its skill for the other three crops is poor,with insignificant temporal correlations of 0.16,0.18,and 0.09 for wheat,rice,and soybean (Table S4,in the ESM).
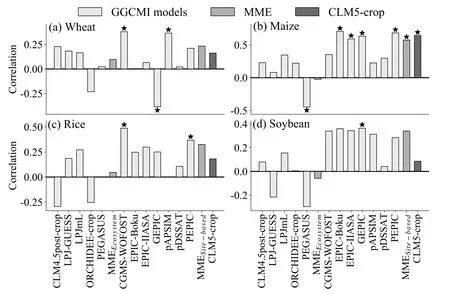
Fig.7.As in Fig.4 but for the temporal correlation of the interannual variability of national yield between observations and simulations based on detrended time series.See Table S4 (in the ESM) for values corresponding to the bars.MMEEcosystem and MMESite-based are the MME means of the GGCMI ecosystem models and site-based models,respectively.
In terms of provincial yield,GGCMI ecosystem-model MME is unable to skillfully simulate the interannual variability pattern,especially for wheat and rice (Fig.8).GGCMI site-based MME,meanwhile,simulates the interannual variability of provincial maize and soybean yield better,with average correlations more than twice those of wheat and rice(Figs.8e–h).Provinces with simulation skill for wheat,maize,and soybean are mainly located in North China for the site-based models (Figs.S14,S15,and S17,in the ESM).Moreover,CLM5-crop can skillfully simulate the interannual variability of provincial maize yield in North China(Fig.8j).

Fig.8.As in Fig.5 but for the spatial distribution of the temporal correlation coefficient between observed and simulated yields during 1980–2009.Numbers in parentheses are the weighted average of the provincial temporal coefficient with planting area as the weight.See Figs.S14–S17 (in the ESM) for the spatial distribution of individual GGCMI models.
3.3.3.Top-10 producing provinces
We used the RMSE of yield anomalies to test the skill of models in simulating the temporal variability of yield for top-10 producing provinces,to serve as model selection for crop yield forecasting/projection and agricultural management of the major crop-producing provinces.As shown in Fig.9,there is at least one model whose simulation is skillful for the top-10 producing provinces,except for wheat in Shaanxi and soybean in Heilongjiang and Hebei,though most of the GGCMs cannot simulate the interannual variability skillfully (i.e.,worse than the mean null model,depicted by the white boxes).The best models for wheat,maize,and rice are mostly the CLM family of models (CLM5-crop or CLM4.5post-crop) (Figs.9a–c).The best models for soybean are PEPIC,GGCMI-MME,PEGASUS,CLM5-crop,and LPJmL (Fig.9d).The skill is improved from CLM4.5postcrop to CLM5-crop mainly for maize and rice.

Fig.9.RMSEs of the time series of yield anomalies simulated by GGCMs for top-10 producing provinces in China.Right-hand labels describe the best performing GGCMs for that province and the RMSE.White boxes indicate the skill is worse than the mean null model (temporal mean of observations,also called the climatology forecast in meteorology).
For wheat,LPJmL clearly produces the best yield simulations for Henan,Shandong,and Anhui,while the CLM family of models works best for the other seven provinces (Fig.9a),mainly because they can reproduce the significant upward trends (Fig.5i,Fig.S5a,and Fig.S5c,in the ESM).For maize,CLM4.5post-crop and PEPIC perform the best for Liaoning and Shanxi,respectively,because they are skillful in simulating the interannual variability pattern (Fig.9b,Fig.S15a,and Fig.S15l,in the ESM).CLM5-crop shows the best simulations for the remaining eight provinces,mainly because it successfully captures the significant increases in yield in these provinces,except for Inner Mongolia,and is skillful in simulating the interannual variability pattern for Jilin,Shandong,Hebei,and Inner Mongolia (Fig.5j,Fig.8j and Fig.9b).For rice,LPJ-GUESS performs the best for Hunan,and LPJmL for Anhui and Zhejiang,mainly because they simulate the interannual variability pattern of rice yield well in these provinces (Fig.9c and Figs.S16b–c,in the ESM).GEPIC and EPIC-IIASA have the best simulations for Sichuan and Heilongjiang,respectively,while CLM5-crop does for the remaining five provinces,mainly because they successfully capture the significant upward trends (Fig.5k,Fig.9c,and Figs.S7g–h,in the ESM).For soybean,LPJmL works the best for Hebei,and GGCMI-MME for Henan,Inner Mongolia,and Sichuan,mainly due to the well reproduced patterns of interannual variability (Fig.8h,Fig.9d and Fig.S17c,in the ESM).CLM5-crop is the most skillful for Shandong,mainly due to the simulated significant upward trend (Fig.5l and Fig.9d).PEPIC shows the best yield simulations for Northeast China,mainly because it successfully captures the significant increases in Heilongjiang and Jilin and simulates the interannual variability pattern well in Liaoning (Fig.9d,Fig.S8l,and Fig.S17l,in the ESM).PEGASUS shows the best simulations for Anhui and Jiangsu,due to its good performance in simulating not only the significant upward trend but also the pattern of interannual variability (Fig.9d,Fig.S8e,and Fig.S17e,in the ESM).
4.Discussion
The finding that GGCMI models fail to capture the significant upward trends in wheat,maize,and rice yield is partly because of the incorrect input data of nitrogen fertilizer supply and/or inaccurate simulations of yield response to agronomic management and cultivar improvement.Nitrogen is an important nutrient required for crop growth,and nitrogen fertilization can alleviate the nitrogen limitation in photosynthesis and nitrogen competition between microorganisms and crops (Sinclair and Rufty,2012;Lombardozzi et al.,2020).As shown in Fig.S18 (in the ESM),GGCMI input data do not consider the observed significant increase in nitrogen fertilizer supply in China for 1980–2009,which leads to the underestimated trends in the GGCMI models that consider nitrogen stress (e.g.,CLM4.5post-crop,ORCHIDEE-crop,PEGASUS,site-based GGCMs except for CGMSWOFOST).Furthermore,many of the GGCMI models often simulated lower yields in the harmnon scenario (no nitrogen stress) than in the fullharm scenario in China (Figs.S19–S21,in the ESM),suggesting inaccurate simulations of the yield response to increased nitrogen fertilization,possibly due to inaccurate assumptions of the fertilization scheme (e.g.,timing,duration,and rate) and biogeochemical scheme(e.g.,photosynthesis and nitrogen cycle).Besides,LPJGUESS,LPJmL,and CGMS-WOFOST in GGCMI Phase 1 did not model nitrogen stress.On the contrary,CLM5-crop uses a nitrogen fertilizer input that rises significantly as observed (Fig.S18,in the ESM),and models the nitrogen cycle and nitrogen–carbon interactions,which enables it to capture the significant upward yield trends of the three crop types.In addition,no GGCM considers the improvement in management level (e.g.,developments in mechanization,inter-cropping,multiple-growing season,intra-annual rotation,or crop residue management) or the changes in crop cultivars and policies,which are important for yield increases in China over the past few decades (Yu et al.,2012;Liu et al.,2013;Xiao and Tao,2014).
Many GGCMs fail to reproduce the spatial pattern and interannual variability of crop yield in China.This may be partly caused by their poor performance in capturing the response of crop yield to climate conditions.For example,CGMS-WOFOST,EPIC-IIASA,and PEPIC can successfully reproduce the observed yield–climate relationship for rice,while other models perform poorly (Fig.S22,in the ESM).Correspondingly,the simulation skill of these three models is much better than others in simulating the spatial pattern and interannual variability of rice yield,with their spatial and temporal correlations being higher than 0.3 (Fig.2,and Table S4 in the ESM).Similar conclusions can be made for wheat and maize (Figs.S23 and S24,in the ESM).In addition,GGCMs make a number of simplifications in terms of sowing date,cultivars,and response to extreme weather disasters (Barlow et al.,2015;Müller et al.,2017;Rötter et al.,2018;Heinicke et al.,2022),which may partly explain their poor capability in reproducing the spatial pattern and interannual variability of crop yield.
Earlier studies (Müller et al.,2017;Li et al.,2022) that evaluated GGCMI models in simulating the average and interannual variability patterns of national and regional yields in China showed that models generally underestimate rice yield but overestimate the yields for the other three crop types in China,which is consistent with our results.They also pointed out that GGCMI models perform better for maize than other crop types in their simulation of the interannual variability pattern,and our results also show that GGCMI site-based models perform the best for maize,with four out of seven site-based models exhibiting significant positive temporal correlation and a significant temporal correlation of 0.57 for the site-based MME (Fig.7 and Table S4,in the ESM).However,our study also evaluated the spatial patterns and long-term trends of crop yields,thereby providing a complete picture of model performance,which is critical for comprehensively estimating the capability of models in predicting and projecting yields.Besides,our study,for the first time,evaluated the temporal change in yield for top-10 producing provinces,and CLM5-crop in simulating China’s crop yield.In China,provincial agricultural management is largely independent.Therefore,information on model skill and the best performing models at the provincial scale can serve as a guide for model platform selection in predicting and projecting future provincial crop production and carrying out numerical experiments for adjusting and developing agronomic measures.CLM5-crop is the updated version of CLM4.5post-crop in the GGCMI project,and the only one formally used in an Earth system model.Lombardozzi et al.(2020) evaluated the performance of CLM5-crop on the global scale and demonstrated that it can successfully simulate the significant increases in global crop yield,which is consistent with our results.However,our study also provides a more comprehensive evaluation of CLM5-crop performance in China,which should prove useful for quantitatively assessing national and provincial food safety,given the good performance of CLM5-crop in simulating the national average and long-term trends of wheat,maize,and rice yield,and the temporal variability of yields in the top-10 producing provinces.Despite the above strengths of our study,there are two major limitations.First,we did not collect yield statistics on scales smaller than the provincial scale (e.g.,county scale),so we could not evaluate simulations of the spatial distribution of yield averages,trends,and interannual variability in more detail.And second,we did not evaluate the simulation of carbon fluxes.Evaluation of the carbon cycle may help in identifying the reasons for yield simulation skill.
5.Conclusions
The performances of 13 GGCMs (12 models from the GGCMI phase 1 default scenario,and CLM5-crop) in simulating crop yields in China during 1980–2009 were comprehensively evaluated in this study.Results showed that the selected GGCMI models tend to overestimate wheat,maize,and soybean yields but underestimate rice yield in China,with the MME result being 12%,24%,and 41% higher than observed for wheat,maize,and soybean,and 25% lower for rice,while CLM5-crop can simulate the national yields of wheat,maize,and rice well.GGCMs generally fail to simulate the spatial pattern of crop yields in China.No model can simulate the national spatial distribution of wheat yield skillfully,and only one,one,and two models perform well for maize,rice,and soybean,respectively.GGCMI models perform poorly in simulating the long-term trends of crop yields in China,but some can simulate the interannual variability and extremes reasonably well.Conversely,CLM5-crop can capture the observed significant upward trends for wheat,maize,and rice,but works poorly in simulating the interannual variability.In addition,at least one model can skillfully reproduce the observed temporal variability of yield in the top-10 producing provinces,except one province for wheat and two provinces for soybean.The best models are generally CLM4.5post-crop for wheat,CLM5-crop for maize and rice,and PEPIC or GGCMI-MME for soybean.
There were a few limitations in our study.First,we focused on evaluating GGCMs at national and provincial scales,and the performances of GGCMs at smaller scales (e.g.,county scale) remain unknown,which needs addressing with further collection and collation of yield statistics.In addition,the responses of yields to extreme weather and climate need to be evaluated in the near future.Lastly,the reasons behind simulation biases should be more thoroughly investigated by analyzing related processes (e.g.,carbon cycle processes).
The findings of our study can serve as guidance for GGCM development in the future.Our results suggest that model development should target and consider cultivar differences and improvement and improve the representation of agronomic management (e.g.,machinery and technological advances,multiple cropping seasons,residue management and soil tillage,and more realistic fertilizer and irrigation application).Also,parameter calibration and optimalization as well as the representation of the influence of pests and extreme weather disasters on agricultural systems may improve the simulation skill for the interannual variability of yields.In addition,our evaluation results could be helpful for understanding model results and biases,as well as model selection when predicting or projecting national and provincial yields,and for developing correction methods that can be applied to model yield outputs.
Acknowledgements.This study was co-supported by the Guangdong Major Project of Basic and Applied Basic Research(Grant No.2021B0301030007),the National Key Research and Development Program of China (Grant Nos.2017YFA0604302 and 2017YFA0604804),the National Natural Science Foundation of China (Grant No.41875137),and the National Key Scientific and Technological Infrastructure project “Earth System Science Numerical Simulator Facility” (EarthLab).We thank Christoph Müller for his help in answering our question about GGCMI phase 1 simulation data,the two anonymous reviewers for their valuable comments and suggestions,and the Editor for handling our paper.
Electronic supplementary material:Supplementary material is available in the online version of this article at https://doi.org/10.1007/s00376-023-2234-3.
杂志排行

Advances in Atmospheric Sciences的其它文章
- The First Global Map of Atmospheric Ammonia (NH3) as Observed by the HIRAS/FY-3D Satellite
- Comparison of the Minimum Bounding Rectangle and Minimum Circumscribed Ellipse of Rain Cells from TRMM
- Cloud-Type-Dependent 1DVAR Algorithm for Retrieving Hydrometeors and Precipitation in Tropical Cyclone Nanmadol from GMI Data
- A Study on the Assessment and Integration of Multi-Source Evapotranspiration Products over the Tibetan Plateau
- Downscaling Seasonal Precipitation Forecasts over East Africa with Deep Convolutional Neural Networks
- Seasonal Variation of the Sea Surface Temperature Growth Rate of ENSO