Multi‐objective particle swarm optimisation of complex product change plan considering service performance
2023-12-01RuizhaoZhengYongZhangXiaoyanSunFaguangWangLeiYangChenPengYulongWang
Ruizhao Zheng | Yong Zhang| Xiaoyan Sun | Faguang Wang | Lei Yang |Chen Peng | Yulong Wang
1School of Information and Control Engineering,China University of Mining and Technology,Xuzhou,China
2Shenzhen Skyworth RGB Electronics Co.,Ltd,Shenzhen, China
3School of Mechatronic Engineering and Automation,Shanghai University,Shanghai,China
Abstract Design change is an inevitable part of the product development process.This study proposes an improved binary multi-objective PSO algorithm guided by problem characteristics (P-BMOPSO) to solve the optimisation problem of complex product change plan considering service performance.Firstly, a complex product multi-layer network with service performance is established for the first time to reveal the impact of change effect propagation on the product service performance.Secondly,the concept of service performance impact (SPI) is defined by decoupling the impact of strongly associated nodes on the service performance in the process of change affect propagation.Then, a triple-objective selection model of change nodes is established, which includes the three indicators: SPI degree, change cost, and change time.Furthermore, an integer multiobjective particle swarm optimisation algorithm guided by problem characteristics is developed to solve the model above.Experimental results on the design change problem of a certain type of Skyworth TV verify the effectiveness of the established optimisation model and the proposed P-BMOPSO algorithm.
K E Y W O R D S multi-objective, particle swarm optimization, product change, service performance
1 | INTRODUCTION
Design change is an inevitable part of the product development process [1–3].In real production, some product parts often need to be redesigned or reselected due to subjective/objective reasons, such as product iteration, supply chain disruption,blockage, and change in laws and regulations [4, 5].More importantly, changing a critical part can propagate and affect other related parts in a product[6,7].With the development of technology, the internal structure of advanced products and machines is becoming more and more complex [8].For the complex product design problems(CPD),if the product design change process is not controlled effectively,these changes will have a notable impact on service performance, cost, and product schedule[9,10],even lead to change failure.Therefore,it is essential to study the CPD problems[11,12].
To study CPD problems, firstly,it is necessary to establish an accurate model of product parts.In recent years, the development of complex network technology provides a new idea for product change research.Taking product parts as nodes and the relationship between parts as edges, we can build a complex product network, so that complex network knowledge can be used to analyse and solve CPD problems.Compared with other models, the complex product network model can better reflect the coupling strength between different parts [13].Existing work mainly uses the design structure matrix (DSM) to quantitatively represent the dependencies between parts[14,15].To address the shortcoming of DSM that is only suitable for some specific product instances, Diagne et al.[16] proposed an extended conceptual design semantic matrix (MSX-CDSM).This approach adds additional information to the traditional DSM matrix, making it possible to model a product series simultaneously.Cheng et al.[17]the abstracted complex product into a weighted DSM network, which accurately portrays the association degree between parts.Masmoudi et al.[18] proposed the definition of macro node based on DSM and diagrams, reducing both the DSM's dependency and the complexity of analysing product change problems.Li et al.[19]proposed a design change model based on integrated optimal scheduling,reducing the total time of design change occurrence by introducing scheduling optimisation methods.Yu et al.[20] proposed a design optimisation model responding to user demand changes for CPD problems by taking customer satisfaction as an optimisation objective.Jiang et al.[21] developed a function-behaviourstructure network model suitable for product design.Ma et al.[22] proposed a mathematical programming model to predict the change propagation impact and established a design change analysis model based on change propagation prediction results.Zheng et al.[11] comprehensively assessed the impact of product change on the whole product and proposed a fourphase model to assess the impact to improve the model assessment efficiency.These works laid a good foundation for effectively analysing the propagation mechanism of product change.However, they do not consider service performance indicators directly related to the user experience, so their constructed network models are hard to meet actual needs.
After establishing a product part correlation model, a suitable metric needs to be defined to evaluate the importance of nodes and the feasibility of a change plan.To evaluate the importance of a part node, Kitsak et al.[23] gave the metric based on K-core values.They conclude that the larger the K-core value is,the more important the node is.Bae et al.[24]stated that a node's neighbours influence its importance.Cheng et al.[17]proposed three variability metrics based on weighted network theory, that is, degree-changeability, reachchangeability, and between-changeability, to accurately identify ’expensive’ parts/modules.Ma et al.[25] estimated the change propagation impact by using metrics, such as propagation likelihood, node degree, long-chain linkage, and design margin.To measure the impact of network change on a product system,Yu et al.[26]defined two new metrics,that is,network mutation scale and extra network change cost.However, due to the limitations of complex product network models used,the above indicators do not intuitively reflect the impact of product changes on service performance.There still is a lack of corresponding research results on revealing the impact of part changes on product service performance.
Furthermore, it is also necessary to search for optimal product change propagation paths/plans in order to effectively control the impact of change effect propagation.Yang et al.[27]proposed a search method based on a product model and a change propagation mechanism to help decision-makers obtain an optimal change solution when paths are not unique.Zhang et al.[28] developed a rough set-based propagation space-reducing tool to search for the shortest change propagation path.Li et al.[29]proposed an improved breadthfirst algorithm to search for the change path with the shortest duration time.Zheng et al.[30] proposed a dynamic optimisation method for configuration change paths by combining a dynamic upstream optimisation strategy and a dynamic downstream search strategy.
Evolutionary optimization is an essential approach to solving real-life engineering design problems, such as vehicle component design problems [31–34], structural design problems [35–38], and mechanical manufacturing problems[39–41].In recent years, scholars have used evolutionary optimization techniques with global search capability to solve production design change and other similar NP-hard problems.To solve the economic lot scheduling problem, Kayvanfar et al.[42] employed three multi-objective techniques,that is, the non-dominated sorting genetic algorithm II(NSGAII), the non-dominated ranking genetic algorithm(NRGA), and the multi-objective hybrid algorithm with NSGAII and PSO.Hafsi et al.[43] proposed a geneticallymodified multi-objective PSO algorithm (GMPSO) for the scheduling application workflows on hybrid Clouds.GMPSO incorporates genetic operations into multi-objective PSO to enhance its performance.Xue et al.[44]proposed a new multiobjective PSO algorithm with a competitive mechanism(MOPSO-CM)for integrating energy smart grid as ontologies.Luo et al.[45] designed a NSGA-II-based change path optimisation method and demonstrated its effectiveness with the print calculator design problem.Aye et al.[33] studied a kind of multi-surrogate-assisted optimisation method for the optimisation of vehicle crashworthiness,where the performance of different surrogate models along with the proposed multisurrogate model is investigated.Finally, their proposed multisurrogate model was proved to be competitive in solving constrained optimisation problems.Yildiz et al.[46] proposed an elite opposition-based learning grasshopper optimisation method (EOBL-GOA) for engineering design problems such as the welded beam design problem,the suspension arm of the vehicles, and so on.Their optimum results indicate that the EOBL-GOA is one of the best algorithms reported in the literature.Ma et al.[25] used an ant colony algorithm to minimise the change propagation intensity and find an optimal path.The work can find an ideal propagation path with the minimum change risk, but the obtained path is still hard to meet the actual need,because it ignores the impact of a design change on associated nodes outside the path.Most of all, the optimisation of design change plans in some practical problems often need to consider multiple metrics simultaneously,such as change time, change cost, and the impact on service performance.However,a few research work considers multiple metrics simultaneously.Ren et al.[47] considered change cost,intensity and path length, and proposed a non-dominated ranking genetic algorithm II (NSGA-II) based on parallel search strategy to search for multiple optimal change paths.On the one hand, this algorithm does not consider the impact of changes on service performance when finding the optimal change path;on the other hand,it may inherit the disadvantage of existing evolutionary algorithm.
In summary, the existing methods still have the following research gaps.(a) Existing models do not consider the service performance indicator related to the user experience, though the service performance is the core factor in measuring the success or failure of product change.(b) Existing indicators cannot be directly used to evaluate the impact of product changes on the service performance.(c) The optimal change path obtained by existing methods is still hard to meet the actual needs because it ignores the impact of a design change on associated nodes outside the path.(d)The existing methods can only give only one change path at a time and cannot meet the different preferences of decision-makers.
Aimed at the aforementioned disadvantages and real application requirements, the paper studies an improved binary multi-objective PSO algorithm guided by problem characteristics (P-BMOPSO) for searching for optimal product change plans.Based on the established multi-layer network model of complex products, considering the impact of change effect propagation on product service performance,as well as change cost and time, a change plan optimisation problem of CPD is modelled as a triple-objective constrained optimisation problem.Following that, an improved multiobjective PSO algorithm is proposed to solve the above model.Specifically,the main contributions of this paper are as follows.
• Establish a multi-layer network model of complex product with service performance.Compared with traditional product network models,this model introduces the concept of service performance layer for the first time,it can reflect the impact of design changes on the product performance more comprehensively.
• Develop the concept of service performance impact degree(SPI) to assess the impact of a change on product service performance.By decoupling the relationship between associated nodes in the change propagation network, the SPI degree can obtain more accurate prediction results.
• Establish a triple-objective change node selection model for the change plan optimisation problem.Compared with the commonly used change path planning model that is only dedicated to searching a path to be changed,the established model can select key nodes from multiple change propagation paths, so the resulting change plan is more manoeuvrable.
• Propose an integer multi-objective PSO algorithm guided by problem characteristics to solve the established change node selection model.Several new operators/strategies including the update strategy of integer particles, the adaptive mutation, and the repair strategy of infeasible solutions, significantly improve the ability of PSO to handle the above model.
The rest of this paper is organised as follows.Section 2 focuses on establishing the complex product multi-layer network with service performance.Section 3 analyses the product change propagation mechanism and establishes the change node multi-objective selection model.Section 4 gives the improved multi-objective PSO algorithm.After that, Section 5 verifies the effectiveness of the proposed algorithm by experiments.Finally, Section 6 concludes the paper.
2 | MULTI‐LAYER COMPLEX PRODUCT NETWORK CONSIDERING SERVICE PERFORMANCE
Complex product is a product that contains more parts and has complex relationships between parts.In many existing works, complex network technology has been used to represent complex products[2,4].As shown in Figure 1,a complex network can be represented asG= (V,E,W), whereV={vi|i=1,2,…,m′} is the set of nodes,E=■eij|i,j=1,2,…,m′,i≠j■.Represents the set of edges, andW=■wij|i,j=1,2,…,m′,i≠j■.represents the set of weights.
Complex product consists of multiple parts.Treating a part as a node in the complex network, the relationships between parts as network edges, and the correlation strength between parts as weights,a single-layer complex network model can be built for the product design problem.However, this singlelayer model does not reflect the impact of changed nodes on product service performance.
To accurately analyse the change propagation mechanism and its impact on the product service performance,this section develops a multi-layer network model of complex products with service performance.Figure 2 shows its structure, where the upper layer is the service performance layer(i.e.SPI layer),and the lower layer is (i.e.Part layer).A product usually contains multiple service performances, denoted as{SP1,SP2,…,SPn}, wherenis the number of service performances to be considered.The connection degree between thei-th part,vi,and thej-th service performance,SPj, is denoted asw′ij.The larger thew′ijis,the stronger the connection degree betweenviandSPj, thus, the more significant the influence of the partvion the service performanceSPj.The connection degree between the partviand the partvkis denoted aswik.Take the first service performanceSP1and the two nodes,v1andv2,as an example, the connected edge betweenv1andv2ise12, and its weight isw12; the connection degree between the partv2and the service performanceSP1isw′21.It is worth noting that the network built is a directed network, sow12andw21may not be equal.
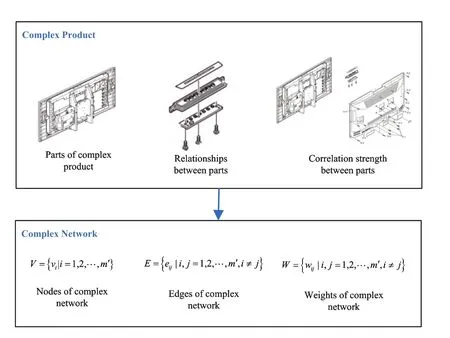
F I G U R E 1 Complex product & Complex network

F I G U R E 2 The multi-layer network model for complex products
In general, connection degrees between parts and their impacts on service performance are determined by relevant product parameters.For example, their electrical parameters can determine the connection degree between the TV's motherboard and the power supply.To accurately evaluate the connection degree between two components, Zhang et al.proposed the intuitionistic interval-valued fuzzy sets method [48].Since considering the membership degree, nonmembership degree, and hesitation degree simultaneously,the method has more vital ability and flexibility to deal with uncertain information in the product design problem.The paper also uses the method and expert experience to obtain connection degrees between parts.
Furthermore, to evaluate service performances of the product,it is necessary to determine its relevant parts or nodes and the influence degree of these nodes on the service performance.Here, the influence degree of a part to a service performance can be evaluated/obtained by the historical design data of the product and relevant expert experience.As an example,the audio performance of TV is mainly influenced by three parts, that is, the audio component, the amplifier component and the speaker cable.For the audio component,we mainly use Sound output power (units: Watt) and Sound output amplitude (units: Volt) to evaluate its performance;Signal-to-noise Ratio (units: dB) is used to judge the performance of amplifier components; and for the speaker cable,Internal resistance per unit length (units: Ohm/m) and Total harmonic distortion (units: %) are used.According to the product's historical design data and relevant expert experience,the influence degrees or weights are set to be 0.45, 0.4, and 0.15 respectively.
The above multi-layer network model has the following characteristics:(a) Compared with traditional product network models, this model introduces the service performance layer for the first time.(b) Several related parts determine a service performance together,but each part has a different connection degree to the same service performance.(c) The change of a single product part may influence multiple service performances.Although there is no direct correlation between these service performances, there is also a coupling between them due to the mechanism of change affecting propagation.
3 | MULTI‐OBJECTIVE SELECTION MODEL FOR CHANGE NODES
Considering the impact of change on product service performance, change cost and time simultaneously, we model the change plan optimisation problem of CPD as a triple-objective constrained optimisation problem.Without loss of generality,product parts are referred to as nodes in subsequent sections.Firstly,a node change propagation model used in this paper is given, based on which the scope and impact degree of the changed node on the production network can be determined.Furthermore, the decision variables of the model and their ranges are given.Subsequently,we define the SPI degree for a single node, and then the overall SPI degree for a change node plan (i.e.candidate solution) is calculated.Finally, the multi-objective optimisation model of CPD is developed by considering the three indicators, and practical constraints.
3.1 | Model assumption
(a) The initial change source has a limited area of influence which the change propagation model can determine, and parts outside this area are not affected by the change.
(b) Redesigning a part that needs to be changed can fully satisfy the product performance requirements, so it will ensure that the part has no impact on service performance; correspondingly, choosing not to change it will affect the service performance of the product.
3.2 | Decision variables and coding
3.2.1 | Product change propagation model
Product change means that a part of a product needs to be redesigned or reselected due to product iterations and upgrades,supply chain disruptions etc.Change propagation means that the change of one part will affect the performance of those parts directly associated with it, and this influence will indirectly spread to other related nodes.Taking the TV product design as an example, the Wi-Fi chip model of a certain type of TV is RTL8188.If the chip's supply is interrupted or the radio frequency performance of the TV needs to be upgraded,the part of the Wi-Fi chip needs to be changed.The changes to this part will be propagated to other related parts,such as radio frequency antennas,power supply chips etc.These affected parts also need to be changed to fit the changes to the original part.
As previously mentioned, the change in one node inevitably affects other nodes.Accurately describing the propagation mechanism of product change effect among nodes is essential for evaluating the impact of changes.For this reason,this subsection proposes an improved product change propagation model by introducing the concepts of change effect propagation coefficient,product change intensity,and product design margin.
Change effect propagation coefficient
When a node changes,its change effect will affect other related nodes somewhat.The change effect propagation coefficient represents the degree that the change effect is propagated from one node to another node.When a node is changed with a certain intensity,the larger the propagation coefficient between the node and a neighbourhood node, the more the neighbourhood node is affected by the change of the node.
Using the TV design as an example, the dimensional parameters of the frame are almost decisive for the dimensional parameters of the backplane.When the parameters of the frame are changed, the probability that the size of the backplane needs to be changed is higher,and then its change effect propagation coefficient is higher.Accordingly, when the TV chip parts are changed,they usually do not affect the fuse parts because the power supply to the TV is nearly unchanged, and then the change effect propagation coefficient is smaller.
The change effect propagation coefficient from the nodevito the nodevjis mainly determined by the following factors:the connection degree between them and the relationship between the nodeviand other downstream nodes, the change effect propagation coefficient fromvitovjis as follows:

Product change intensity
The change degree of a node is usually vary each time,and the greater a node's change degree,the more significant its impact on the service performance.For example,if a changed part has a substitute with poor performance, that is, the performance parameters of the substitute are inferior to the changed part.The worse the performance of the substitute is,the bigger the product change intensity is.Conversely,if the product part has a better replacement part, the product change intensity is comparatively smaller.
The changing intensity of a nodeviis defined as the change degree of the corresponding indicator of the node before and after the change, as follows:
whererinitial(vi) andrpresent(vi) denote the real performance indicator values corresponding to the nodevibefore and after the change respectively.Usually, this performance indicator is determined by the actual functionality of a node, such as the resolution of the TV screen and the speed of the wireless chip.
Product design margin
When designing a product, it is common to leave specific tolerances or scalability for critical parts/nodes,collectively called the design margin[49].In many practical problems,the design marginrtl(vi) of a nodeviis mainly obtained by the tolerance decision of the node.When the changing intensityr(vi)of the nodeviis higher thanrtl(vi), the product performance will be affectedbythe change,and a product change strategy needs to be implemented; otherwise, we think the change has a limited impact on the product performance;so that it can be ignored.
Product change propagation model
A node is affected by multiple upstream nodes.Based on the above propagation coefficient and the product change intensity,the change intensity of the downstream nodevjcan be calculated as follows:
whereus(j) denotes the set of upstream nodes of the nodevj;for an upstream nodeviinus(j),p(vi,vj) is the change effect propagation coefficient fromvitovj;r(vi) is the product change intensity of the nodevi.
When a change occurs at a node, firstly, the change effect intensity of each relevant node along all possible propagation paths is calculated by the Equation (3).For a change propagation path,we set the following two propagation termination conditions: the change effect propagates to the node whose out-degree is 0, or the changing intensity of the currently affected node is less than its design margin.Based on the above steps,we can determine all nodes affected by the change byIV(vi)={iv1,iv2,…,ivm}and their change intensity values byr(IV(vi)) = {r(iv1),r(iv2), …,r(ivm)}.
3.2.2 | The coding of change node selection plan
For an initial change nodevi, we can determine all nodes affected by the change, that is, the setIV(vi).In the practical product design process, if all affected nodesIV(vi) are effectively changed, the service performance of the product can be maintained or even improved, but it also leads to a significant increase in change time and cost.In particular,not all affected nodes can be changed due to many factors including the supply chain or product compatibility.It is reasonable to select part of key nodesIV(vi)for change in order to reduce the change time and cost while ensuring the product service performance.
In view of this, the above change node selection problem can be modelled as a kind of combinatorial optimisation problem.Without loss of generality,consider a product design change problem that is caused by the change of the nodevi,we use a binary encoding vector to represent its corresponding change plan or optimisation solution, as follows:
wherecvj= 1 indicates that the nodeivjinIV(vi) is selected for change; otherwise, the nodeivjremains unchanged.
3.3 | Service performance impact degree
In existing work,product functions were often used to evaluate the performance of the product.However, product functions cannot fully reflect the user's satisfaction with a product.Therefore, this section introduces the service performance,which is more focussed on the user experiences or satisfactions.
In this paper,service performance is defined as an indirect indicator,which evaluates the degree to which a product meets a certain demand of users.As we know, user satisfaction is relevant to users and from users' evaluation of product performance.Moreover, judging the user's satisfaction degree at the product design stage is usually difficult.Here, the service performance of the product can be predicted by the designers according to related product functional/performance parameters easy to obtain, such as audio, video and wireless RF parameters in TV.
As mentioned in Section 1,a product part change will affect the performance of those parts directly associated with it, and this influence will spread to indirectly other related nodes.To adapt to this change, part of these parts must change their performance parameters, while the values of these parameters directly affect the function of the corresponding parts.In particular, Section 1 gives the method of calculating a single node's service performance, and the overall service performance of the product is defined and calculated in Section 2.
3.3.1 | Impact of a single-node on the product service performance
Product service performance reflects user satisfaction with a product.Design change caused by supply chain disruption and blockage often affect the service performance of a product.At the same time, unreasonable design change plans can significantly degrade the product service performance.Before evaluating the impact of a design change plan on the product service performance, in this section, we first calculate the impact degree of a single-node on the product service performance.
Generally, the impact degree of a node on the service performance is determined by multiple factors at the same time, including its change intensityr, its importanceImnode,and its indirect influenceImstr.Specifically, when a nodeviis changed, its overall impact degree on an associated service performance is as follows:
In the above equation, the changing intensityr(vi) represents the change degree of the nodevi;Imnoderefers to the importance degree of a product part,that is,the impact degree of changing this node on product performance.If the change of a part has a greater impact on product performance, the part should be set to a higher value forImnode.Imstrrepresents the indirect influence brought by the change affecting the propagation of the nodeviin the network.Its value can be obtained by the node degree,the betweenness centrality,the closeness centrality,the eigenvector centrality,and Hyperlink-Induced Topic Search(HITS).The node degree indicates the association degree of a node with other nodes in a complex network[50];it is often defined as the number of connected edges between the node and other nodes.The definitions and calculations of the betweenness centrality,the closeness centrality,the eigenvector centrality and the HITS can be found in the literature[51].
In this paper, we use the method of literature [51] to calculate the indirect influence of a node, that is,Imstr.(Imnode+Imstr) is defined as the SPI coefficient.The higher the SPI coefficient of a node, the greater its impact on the service performancve under the same change intensity.Therefore, in Equation (5), we take the product of the SPI coefficient and the changing intensity as the impact degree of a node on corresponding service performance.
3.3.2 | Impact of a change plan on the product service performance
This subsection calculates the impact of a change plan on the product service performance.As mentioned earlier, service performance is usually jointly affected by multiple nodes.If the impact degrees of these nodes on the service performance are directly superimposed,it will inevitably exaggerate the resulting impact degree value.To this end, a node-modularity-based decoupling method is proposed for calculating the product SPI degree of a change plan.
In complex network, the node modularityQis often used to evaluate the connection strength between multiple nodes.The greater the modularity between multiple nodes, the stronger they are connected, so the greater their coupling strength.This paper usesQto evaluate the coupling degree between parts associated with service performance.For thek-th service performance,SPk,supposing the set of associated nodes isVsp(k),its modularityQcan be calculated as follows:
whereNerepresents the total number of edges of all nodes inVsp(k).For the nodesviandvjinVsp(k), if there are edges between them,thenAij=1;otherwise,Aij=0.Thed(vi)andd(vj)denote the degrees ofviandvjrespectively.The range of modularity is[-0.5,1].In this paper,(1+Q)-1is chosen as the decoupling factor.
For a downstream nodeivjaffected by the initial change nodevi, it must be changed if the decision-makers want to maintain the current level of product service performance.Otherwise, it will degrade the service performance of the product because it fails to absorb the impact of the initial change nodevi.Therefore,for a change planCVcaused by the initial change nodevi, we use the unchanged nodes in the node-setIV(vi) = {iv1,iv2, …,ivm} to evaluate its impact degree on a service performance.Specifically, the overall impact degree of the change planCVon thek-thservice performance is as follows:

whereλkreflects the importance of thek-th service performance.The higher the value ofλk,the more important thek-th service performance.
It is worth noting that the SPI degree refers to the degree to which service performance is affected.It can be positive or negative.Here, the positive number indicates a decrease in service performance, and the negative number represents an increase in service performance.
3.4 | The built triple‐objective selection model
For a node to be changed,the designers must redesign it.Thus,this change will not only increase the economic cost of product design but also prolongs its completion time.For this reason,this paper uses time and economic costs as the two other metrics to evaluate a change plan,besides the SPI degree.For a change planCV= (cv1,cv2, …,cvm), its time and economic costs are as follows:
wheretiand costidenote the time and economic cost when changing thei-th part in CV respectively.
3.4.1 | Constraints
In the product design process, there are many practical constraints on the feasibility of a change plan due to the restriction of various factors.This section gives the following five common constraints.
Constraint 1: The nodevicannot be changed, that is,cvi≡0.For example,due to factors such as broken supply chain,technical blockade, and other reasons, designers cannot find a suitable substitute for the current part.
Constraint 2:The nodevimust be changed,that is,cvi≡1.For example,a part in use now cannot be obtained,and the redesigned cost exceeds expectations.
Constraint 3: When the nodeviis changed, its downstream nodevj∈ds(i)must be changed,that is,cvj=1,whereds(i)denotes the set of downstream nodes of the nodevi.For example,a node is closely related to its downstream node,and its downstream node is the important auxiliary node.
Constraint 4: If the nodeviremains unchanged, its downstream nodevjcannot be changed,that is,ifcvi=0 andj∈ds(i),thencvj=0.For example,the downstream nodevjis an essential auxiliary node of the nodevi, and its change is mainly determined byvi.
Constraint 5: If the nodeviremains unchanged, its downstream nodesvjmust be changed, that is, ifcvi= 0 andj∈ds(i),thencvj=1.For example,a function of the product must be changed, but the nodeviassociated with it is unchangeable.In this case, the downstream nodevjmust be changed to ensure product performance.
3.4.2 | The multi-objective optimisation model
In summary, the change plan optimisation problem can be modelled as a triple-objective constrained optimisation problem:
3.5 | Advantages of the proposed optimisation model
At present, the commonly used approach for modelling product design change is to adopt a change propagation path to portray the change effect propagation in the product network[25,52].All related literature is based on the following assumption: after a change occurs at the initial node, the change effect propagates along a continuous path, and those nodes on this path must be changed due to the change effect.Based on this assumption, this literature model the product design change problem as a kind of path-planning problem.Compared with these path planning models, the change selection model proposed in this paper has the following advantages.
(a) Existing path planning models ignore the impact of part change on product service performance.They consider only the propagation degree of a change path in the product network for seeking an optimal path with the least propagation degree.The proposed change selection model simultaneously considers three metrics, that is, service performance, change time, and change cost.So, it can provide decision-makers with multiple alternative change plans.
(b) Existing path planning models ignore the effect of part change on nodes outside the selected paths.In other words, the change is made only to those nodes on the change propagation path obtained.However, in many practical product design problems, the propagation of the change effect is usually in the form of a network, so it cannot be confined to a single path.Thus, the service performance of a product will be significantly reduced if the change is not made to critical nodes outside the optimal path.Compared with existing path planning models,the model built in this paper considers all affected nodes comprehensively,and the obtained change plan can cover critical nodes on multiple propagation paths simultaneously.
(c) After determining an optimal change propagation path,most existing methods assume that all nodes in the path can be changed.However,some product parts are difficult or even impossible to be changed.If an optimal path contains such parts, it will result in the path being unimplementable.The model proposed in this paper takes these practical factors into account.By setting appropriate constraint, the feasibility of the change plan can be ensured to the greatest extent.
4 | AN IMPROVED BINARY MULTI‐OBJECTIVE PSO ALGORITHM
The product design problem above shows the following characteristics.(a)Multiple performance indicators or objective functions.In particular,these objectives may conflict with each other.(b)Discrete decision variables.In general,the number of variables is proportional to the complexity of the product.(c)Complex constraints.The resulting change path must meet these constraints.
The significance of using PSO to address the problem in this paper is as follows: (a) Compared with traditional evolutionary optimisation methods such as genetic algorithm, PSO has the advantages of fast convergence speed and few control parameters [53], making it easy to implement in engineering problems.(b) PSO has been successfully applied to many discrete optimisation problems, such as feature selection [54],networked epidemic control [55] etc.
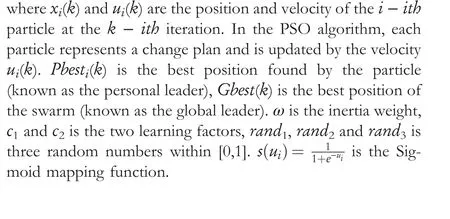
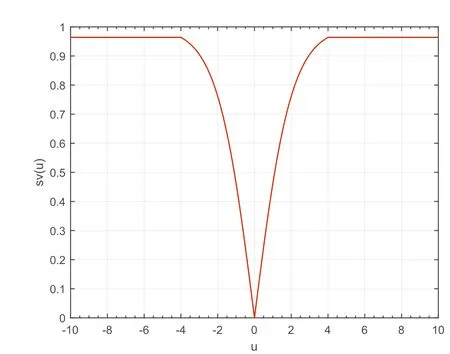
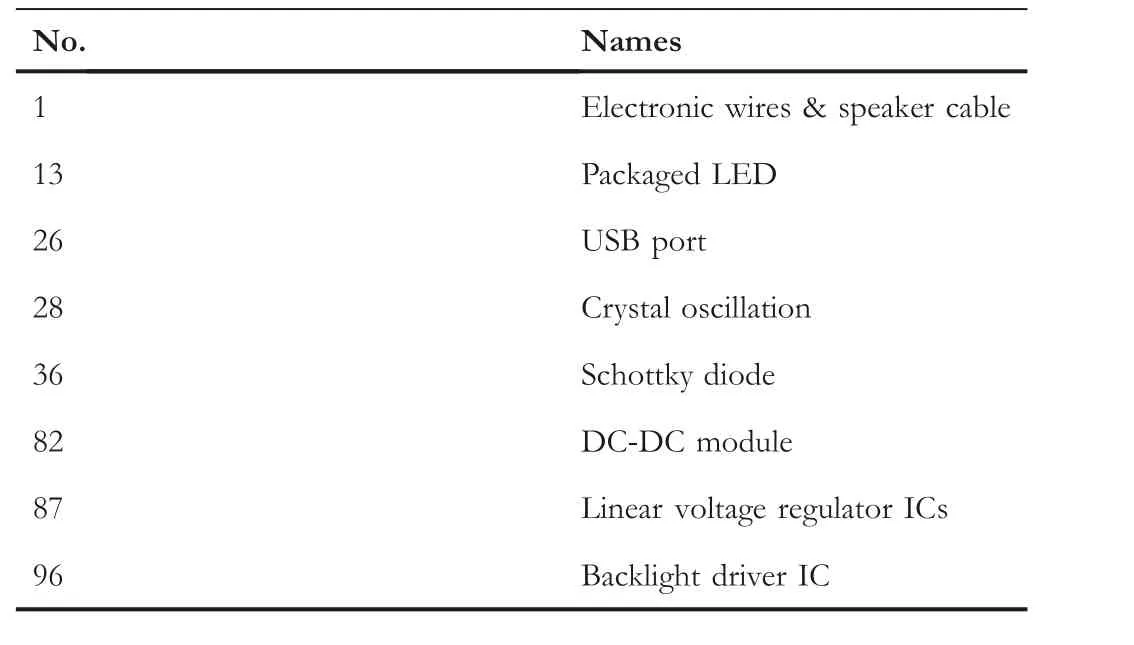
Aimed at the problem and algorithm characteristics above,an improved binary multi-objective PSO algorithm guided by problem characteristics(P-BMOPSO)is proposed to solve the proposed model.Firstly, an improved V-type mapping function suitable for discrete decision variables is developed to address the shortcoming of the traditional PSO; next, an adaptive mutation is proposed to improve the global search ability of the swarm.Finally, a repair strategy of infeasible solutions is given to deal with the complex constraints of the problem.In addition, the Pareto dominance relationship is used to deal with multiple conflicting objectives.Compared with single-objective optimisation problems, multi-objective problems often use the Pareto dominance relationship [56]to evaluate solutions.Taking a minimisation problem withMobjective functions as an example, its definition is as follows:For two solutionsx1andx2, if ∀i∈{1, 2, …,M},fi(x1) ≤fi(x2), and ∃j∈{1, 2, …,M},fj(x1) PSO has been extensively studied since it was proposed due to its effectiveness and simplicity, and various PSO variants have been proposed[57].Expanding the traditional PSO to discrete optimisation problems, Kennedy et al.proposed the typical binary PSO algorithm,called BPSO[58].BPSO introduced the Sigmoid Function to improve the update rule of particles, as follows. Analysing Equation (12), we can see that when the velocityuiconverges to 0,the Sigmoid functions(ui)will converge to 0.5.It means that the particle position will be chosen randomly within{0,1}at the same probability,making the swarm unable to converge in the later stage of the algorithm.Focussing on this, this section proposes an improved V-type mapping function as follows: whererand4is a random number within [0,1].To prevent the particle from moving too fast, we set the upper and lower limits of the velocity asumax= 4 andumin= -4. We can see that: (a) whenui(k+ 1) ≤0, the particle position is set to 0 at a certain probability.The smaller the velocity,the greater the probability that the position is set to be 0.(b)Whenui(k+1)>0,the particle position is set to 1 at a certain probability.The larger the velocity, the greater the probability that the position is set to be 1.(c3) When the velocity isuiclose to 0, the particle position will remain unchanged. F I G U R E 3 The V-type mapping function To improve the global exploration ability of the algorithm,this section proposes an adaptive mutation strategy based on crowding degree.The strategy determines a particle's mutation probability based on particles' crowding degree.The more crowded a region, the higher the probability of the particle being mutated. For a particlexiin the swarm, its mutation probability is: To ensure the feasibilityof a new particle position,a hybrid repair strategy is proposed in this section.For the five constraints given in Section 3.4,the proposed repair strategy is as follows. (a) When a part selected by the current infeasible solution violates Constraint 1,that is,the part that cannot be changed is selected as a changed part.In this case,the corresponding code value of the part is changed from 1 to 0. (b) When the infeasible solution violates Constraint 2, that is,the solution does not select a part that must be changed.In this case, the corresponding code value of the part is changed from 0 to 1, that is, the part is reselected as the changed part. (c) For Constraints 3-5, the penalty function method is used to guide the swarm to exploit more potential areas.For an infeasible solutionxi,firstly,its constraint violation degree is calculated based on the HM between it and its nearest feasible solutionxi′: where tanh is the inverse tangent function.Based on this function, the new fitness value of the infeasible solutionxibecomesf′(xi) =f(xi) ×g(xi). Based on the above work, the specific execution steps of the proposed binary PSO algorithm are as follows. A.Initialisation: randomly initialise theNparticles (i.e.randomly generateNdesign change plans); set related parameters of PSO, includingω,c1andc2; initialise the personal leader of each particle to itself, and the external archive is set to empty. B.Calculate the objective function values (i.e.SPI, Cost,Time) of all particles (change plans) by using Equation(11),select non-dominated solutions from the swarm,and save them in the archive; set the global leader of particles by the method in ref.[59]. C.Update the position of each particle using Equation (12),map the particle positions to binary numbers using Equation (14), and execute the mutation strategy in Section 4.3. D.Execute the proposed constraint-handling strategy.Modify the position of a particle by the method in Section 4.4 when it violates Constraints 1 and 2; re-calculate the objective function values of the particle by the penalty function method given in Section 4.4 when it violates Constraints 3–5; E.Calculate the objective values of particles by Equation(11); F.Update the external archive, and update the global and personal leaders of each particle by the method in [59]. G.Repeat Steps 3-5 until the termination condition is met,that is, the maximum number of iterations is reached. Furthermore, Algorithm 1 shows the pseudo-code of the proposed P-BMOPSO. Algorithm 1 The proposed P-BMOPSO I nput: The multi-layer network model of complex product;Output: The optimal solution set, that is, a set of Pareto optimal plans.1: Initialisation:Set related parameters, including the swarm size, N, the maximum iteration times, itermax, the inertia factor ω, and so on;Randomly initialise the swarm;Set the external archive ARCH to be empty;Set the personal leader of each particle to be itself;2: Calculate the objective values of all particles by Equation (11), and select non-dominated solutions;3: Save non-dominated solutions into ARCH,and set the global leader of particles;4: iter = 0;5: While iter < itermax, do 6: Update the particle's position by Equations (12) and (14);7: Execute the mutation strategy in Section 4.3;8: Execute the proposed constraint handling strategy in Section 4.4; 9: Calculate the objective values of particles by Equation (11);10: Update the external archive by the method in [59], and update the global and personal leaders of particles;11: iter = iter + 1;12: End While 13: Output the non-dominated solutions in ARCH, that is, a set of Pareto optimal plans. The main time complexity lies in Steps 4 and 6 of our algorithm since the remaining steps can be accomplished in linear time.In Step 4, checking whether a solution satisfies the 5 constraints needsO(5m) basic operations; calculating the constraint violation degree of a solution to constraints 3-5 needs one HM while calculating one HM needsO(m) basic operations.Consider the worst case that allNparticles are infeasible,Step 4 needsO(6×N×m)basic operations.Here,NandNare the sizes of the particle swarm and the dimension of decision variables respectively.Step 6 consists mainly of three operators, in which the update of the external archive needsO(4N2)basic operations,the Pbest update needs theO(N) basic operation, and the Gbest update needs theO(N)basic operation.According to the operational rules of the symbolO, the worst-case time complexity for the proposed algorithm can be simplified asO(6 ×N×m) +O(4N2).Further,since researchers usually setN≥m,the complexity of the algorithm isO(10 ×N2). The proposed algorithm is a variant of the MOPSO algorithm,Chakraborty et al.given its convergence condition in the objective function space[60].Now we repeat its main theorem.Theorem 1If S is the initial swarm,then subject to restraints outlined in(17),in a multi-objective search space the MOPSO algorithm will cause the swarm to mean to converge to the centre of the Pareto-optimal set Λ*;that is,if μt is the expected population means after t iterations,thenlimt→∞μt=X∗,where X∗denotes the centre of the Pareto-optimal set. For the proposed algorithm P-BMOPSO,its inertia weight is within the range of [0.4,0.9], and the values of two learning factors (c1andc2) are set to be 2.Obviously, the three coefficients satisfy Equation (17), and thus in the proposed P-BMOPSO algorithm the swarm can converge to the centre of the Pareto-optimal set Λ* as the number of iterations increases. This section verifies the proposed algorithm's performance through three experiments.In the first group of experiments,the effectiveness of the proposed improved position update strategy and the adaptive mutation is analysed.The second group of experiments compares the proposed P-BMOPSO with six existing multi-objective evolutionary algorithms.In the third group of experiments, an optimal change plan obtained by P-BMOPSO is compared with the optimal change path obtained by frequently used change propagation path models. To verify the effectiveness of the proposed model and algorithm,the design change problem of a certain type of Skyworth TV is used.The implementation process of the proposed method for the problem is as follows. Firstly, the design change problem is modelled as a multilayer complex network using the method proposed in Section 2.Here,101 essential parts of this TV model are selected to be modelled as 101 nodes of the complex network.Based on the historical change data of these parts and the experience of relevant experts, the relationships and connection degrees between parts are determined, where these relationships and degrees are modelled as 1706 connected edges and edge weights of the complex network. Secondly, considering the quality standards of the TV product, six service performances are determined, including audio performance, video performance, power supply performance,remote control performance,wireless RF performance and structural&appearance.A DSM matrix and a two-layer product network model can be established based on the above node relationships and service performances. Next, using the method proposed in Section 1, a product change propagation model can be built with the product's data in the Part layer,and the range of nodes affected by the initial change node can be determined by using the product change propagation model.The impact of a single node on the product service performance is calculated with Equation(5)in Section 1 with the data in the SPI layer.The impact of a change plan on the product service performance is calculated by Equations(6–8)proposed in Section 2.Based on all the above work, we can get the multi-objective optimisation model. Finally, the proposed multi-objective PSO algorithm is activated to search the Pareto optimal solution set of the model, that is, a set of optimal change paths.Here, the other two objectives (i.e.change cost and change time) are used to evaluate the quality of solutions or particles; please see Sections 3.3 and 3.4 for their calculation methods.Decisionmakers can select a suitable change plan from the above Pareto optimal solution set based on their preference for the three objectives. According to the historical change information of this enterprise, the following experiments select eight easy-tochange parts as the initial change nodes, respectively,including electronic wire,package LED, USB port, and so on.For each easy-to-change part above, we can obtain its change node selection model by the modelling method introduced in Section 3.The proposed P-BMOPSO and comparison algorithms are used to optimise the model.The specific initial change nodes are shown in Table 1.All experiments use the same running environment, that is, Intel Core(TM) i7 CPU,32.00 GB RAM storage.Python 3.8 is applied to implement the proposed algorithm. To investigate the performances of multi-objective evolutionary optimisation algorithms, we use hyper-volume metric(HV)[61].For a set of solutions,PS,the HV metrichv(PS)is calculated as follows: wherexis a solution inPS,Prefis a reference point for the HV,v(x,Pref)is the volume of the shape enclosed by the solutionxand the reference pointPref. In this paper,the particle swarm sizeNis set nearly to the dimension of the problem, that is,N= 100; the maximal number of iterationsitermaxis set to nearly twice the dimension of the problem, that is,itermax= 200.For other parameters,we directly adopt the common setting methods or values in existing PSO algorithms.Specifically,the size of the external archive is set to be the particle swarm size, the values of two learning factors(c1andc2)are set to be 2[62],and the linearly decreasing weight method [63] is used to automatically adjust the inertia factorw, as follows: whereωinirepresents the initial weight;ωendis the final weight,havingωini= 0.9,ωend= 0.4;iterrepresents the currentiteration times anditermaxrepresents the maximum iteration times. T A B L E 1 Initial change nodes The three objective values in Equation(11)are normalised for the convenience of calculation,and the reference point for HV is set to be[1].The HV can evaluate the distributivity and convergence of a set of optimal solutions at the same time.The larger the HV value of a set of optimal solutions, the better these solutions are.In the following experiments, each algorithm is repeatedly run 20 times to take its statistical result. 5.2.1 | The improved position update strategy Section 4.2 proposed the position update strategy based on the V-type mapping function (V-type based strategy for short) to overcome the shortcoming of the traditional binary PSO.The experiment illustrates its effectiveness by comparing it with the commonly used Sigmoid-based update strategy(Sigmoid-based strategy for short).We set the swarm size to 100 and the number of iterations to 200 for the two update strategies.Table 2 shows the HV values obtained by P-BMOPSO with the two strategies.Furthermore,thet-test is used to analyse the significant differences between the two strategies,where"++"indicates that the result of the V-type based strategy is very significantly better than that of the Sigmoid-based strategy,and"+" indicates that the result of the V-type based strategy is significantly better than that of the Sigmoid-based strategy. From the Table 2,it can be seen that:(a)for all eight initial changes in Table 1, the average HV values obtained by the proposed V-type based strategy outperform that of the Sigmoid-based strategy;(b) The performance of the proposed V-type based strategy is significantly better than that of the Sigmoid-based strategy, as shown in theirp-values.In summary, the proposed V-type-based strategy is effective. Furthermore,to compare the performance of the V-shape function with the traditional Sigmoid function,we also selected eight common discrete multi-objective optimisation problems,including MOKP [64], MONRP [65], ZDT5 [66], Sparse_CD[67], Sparse_IS [67], Sparse_CN [68], Sparse_FS [68], Sparse_PM [68].Except for the mapping function, the algorithm sets the same parameters in both sets of experiments, that is,the swarm size is set to 100 and the number of iterations is set to 200.The experimental results are shown in Table 3.From Table 3, we can see that: (a) For all the eight optimisation problems, the proposed V-function-based update strategy achieves better HV values than the Sigmod-based strategy.(b)Based on the statistical analysis results, the proposed Vfunction-based update strategy shows a significant advantage over the Sigmod-based strategy for all eight test problems.All demonstrate that the proposed V-shape function is effective for different discrete optimisation problems. 5.2.2 | Adaptive mutation strategy To improve the global exploration ability of the swarm, Section 4.3 proposed an adaptive mutation strategy based on crowding degree.This section verifies its effectiveness by comparing it with the commonly used random mutation strategy.The same parameters are used for the two strategies.Here, the swarm size is 100, and the number of iterations is 200.Table 4 shows the HV values obtained by P-BMOPSO with the two mutation strategies. From Table 4,it can be seen that:(a)for all the eight initial changes, the average HV values obtained by the proposed mutation strategy are better than that of the random mutation strategy; (b) Compared to random mutation strategy, the proposed adaptive mutation shows a significant advantage on six initial changes and a very significant advantage on five initial changes.All indicate that the proposed adaptive mutation strategy is also effective. T A B L E 3 Hyper-volume metric (HV) values obtained by the two mapping functions T A B L E 2 Hyper-volume metric (HV) values obtained by the two position update strategies (Mean/std) 5.2.3 | Comparison with the original BPSO algorithm To demonstrate the validity of these improved strategies, we compare the proposed P-BMOPSO with the original BPSO algorithm.Table 5 shows their results.For all eight initial changes, the proposed P-BMOPSO shows a very significant advantage,as shown in theirt-test results.This further indicates that the developed severalnewoperators/strategies are effective. This section compares the proposed P-BMOPSO with six classical multi-objective evolutionary algorithms.These comparison algorithms are as follows. • Non-dominated Sorting Genetic Algorithm-II (NSGA-II)[69]; T A B L E 4 Hyper-volume metric (HV) values obtained by the two mutation strategies (Mean/std) • Multi-objective Evolutionary Algorithm Based on Decomposition (MOEA/D) [70]; • Non-dominated Sorting Genetic Algorithm-III(NSGA-III)[71, 72]; • Unified Non-dominated Sorting Genetic Algorithm-III(UNSGA-III) [73]; • Multi-objective particle swarm optimiser using ring topology (MO-Ring-PSO) [74]; • Competitive mechanism based multi-objective particle swarm optimiser (CMOPSO) [75]. To ensure fairness,the population/swarm size is set to 100,and the number of iterations is set literature 200 for all the six comparison algorithms and P-BMOPSO.In NSGA-II, the crossover probability is set to be 0.9, and the distribution coefficients of crossover and mutation are taken asnc=nm=20 respectively.In MOEA/D, the boundary crossover method is used.In both NSGA-III and UNSGA-III, the crossover and mutation parameters are set to 20.All other parameters for these algorithms are set to reference values given in their original literature.Table 6 shows the HV values obtained by P-BMOPSO and the six comparison algorithms.Furthermore,thet-test is used to analyse the significant differences between a comparison algorithm and P-BMOPSO. From Table 6,it can be seen that:(a)for all the eight initial changes,the proposed P-BMOPSO obtains better average HV values than the six comparison algorithms;(b)Compared with NSGA-II, MOEA/D, and UNSGA-III, P-BMOPSO shows a very significant advantage on all the eight cases,because theirttest results are all “++”; Compared with the remaining three comparison algorithms, that is, NSGA-III, P-BMOPSO, and MO-Ring-PSO, P-BMOPSO also shows a very significant advantage on 7 out of the 8 cases, as shown in theirt-test results; (c) For the case that the initial change part is DC-DC module, P-BMOPSO, NSGA-III, and MO-Ring-PSO obtain similar HV values; For the case that the initial change part is Backlight Driver IC, both P-BMOPSO and CMOPSO obtain the best HV values.In summary,the P-BMOPSO outperforms the six comparison algorithms in solving the product design change problem. To further validate the effectiveness of the proposed multiobjective change selection model, this section compares PBMOPSO with a classical propagation path planning algorithm.The comparison algorithm is from the literature [52],denoted as LRCPP.The algorithm can obtain an optimal and continuous change propagation path after an initial node is changed.In the experiment,Part 87(i.e.the linear regulator IC)is chosen as the initial change node.The red nodes in Figure 4 show the optimal propagation path obtained by LRCPP.The specific path information is as follows: Part 87(linear voltage regulator IC) →Part 61(SMD power inductor 1) →Part 52(FPC pin holder) →Part 82(DC-DC1)→Part 46(plug-in bipolar triode)→Part 79(SMD NTC thermistor)→Part 66(SMD RF ceramic inductor 2)→Part 62(SMD power inductor 2). Furthermore, using Equation (11) to calculate the three objective values of the change path,we can have a SPI degree of 0.54, a change time of 473 h, and a change cost of 190,400CNY. Taking the part 87 as the initial node, Figure 5 shows the set of Pareto optimal solutions obtained by the proposed PBMOPSO.Note that the red star in Figure 5 is the solution obtained by LRCPP.It can be seen that multiple solutions obtained by P-BMOPSO dominate the solution of LRCPP.Without loss of generality, we randomly select an optimal solution (i.e.an optimal change plan) from these solutions obtained by P-BMOPSO.Figure 6 shows the visualisation result of the selected change plan.In the figure, those green nodes represent product parts that are not affected by the change,blue nodes indicate parts that are affected by the change but not changed, and red nodes are parts that are selected to change.The specific change plan is as follows: Part 1(Electronic Wires/Speaker Cable),Part 12(package LED1),Part 13(LENS),Part 14(package LED2),Part 30(IR receiver),Part 80(amplifier TI),Part 82(DC-DC 1),Part 87(linear regulator IC),Part 88(WIFI chip RTL8188),and Part 97(PWM control IC). F I G U R E 5 Pareto optimal solutions obtained by P-BMOPSO The change plan has a SPI of 0.24,a change time of 205 h,and a cost of 142,400CNY.Comparing the change path to the plans obtained by the above two methods,we can see that:(a)LRCPP can only find one change propagation path at a time,while the proposed P-BMOPSO can obtain multiple change plans at the same time for decision-makers to choose; (b)Considering the SPI degree, the indicator values of multiple change plans obtained by P-BMOPSO are significantly better than that of LRCPP.It is mainly because LRCPP only changes those nodes on the selected optimal path,ignoring key nodes in other change paths, significantly affecting the service performance.In contrast,the change plan obtained by the proposed P-BMOPSO can cover critical nodes on multiple propagation paths simultaneously,as shown in Figure 6;(3)Considering the three indicators,including the SPI degree,the change time and cost simultaneously, the multiple change plans obtained by P-BMOPSO also all outperform the only solution of LRCPP. The Wilcoxon Rank Test [76] is also conducted to prove the significance of differences between algorithms.From Table 7, we can see that allp-values are much less than 0.05,indicating that the results of the proposed algorithm are significantly different from these comparison algorithms.Furthermore, Table 8 shows the rank result of the Friedman Rank Test [77].It can be seen that the proposed algorithm is ranked first among all. F I G U R E 6 P-BMOPSO algorithm results in an optimal change solution This section introduces a final solution selection based on the fuzzy decision [78] to further analyse the performance of PBMOPSO.Part 1 (i.e.Electronic Wires & Speaker Cable) is chosen as the initial change node in the experiment.Table 9 shows the 20 solutions found by the P-BMOPSO.From Table 6,we can find that different solutions have different SPI,change time and cost.The SPI is 0.46 at the maximum and 0.28 at the minimum; change time is 563 h at the maximum and 315 h at the minimum,while change cost is 908,600 CNY at the maximum and 230,700 CNY at the minimum.Solutions with higher change time and cost usually have a smaller impact on service performance, and those with a larger impact on service performance require less change cost and time. When the preferences of decision-makers (i.e.the weights on different indicators) can be accurately known, we can choose the most suitable one from multiple solutions by the weighting method.For the case that the decision-maker's preference is unknown,this paper introduces a common fuzzy decision method, that is, the final solution selection method based on the fuzzy Decision[78].According to the method in[78], if a decision-maker prefers low SPI and has the preferences for the three objectives (0.7, 0.2, 0.1), the second solution is chosen.If a decision-maker prefers low cost and has the preference values of (0.2, 0.2, 0.6), the 18-th solution will be recommended.Here, if the decision-maker is slightly dissatisfied with the service performance,he can also choose the 15-th or 20-th solution, that is, spending relatively more time and cost for better service performance.This shows that the proposed multi-objective model can meet the preferences of different decision-makers and help decision-makers adjust their options dynamically. Moreover, the obtained results can also provide some managerial and practical implications.Firstly, there is a vast difference between these obtained change plans regarding theSPI,change time and cost.Compared with traditional methods,the proposed algorithm can simultaneously provide multiple groups of good change plans with significant differences for decision-makers.Secondly, although we cannot get a solution that makes all three indicators optimal simultaneously,reducing the coupling between product parts and increasing the design margin of critical parts during the product design phase can improve the product's ability to cope with the change fundamentally. T A B L E 7 The result of the Wilcoxon Rank Test T A B L E 8 The rank result of the Friedman Rank Test T A B L E 9 Multiple solutions found by the P-BMOPSO algorithm Aimed at the shortcoming of existing product change design methods that ignore service performance, this paper first established the complex multi-layer network model of product with the service performance and defined the impact degree of service performance.Subsequently, the triple-objective selection model of the change plan was established for the first time considering the three indicators: SPI degree, change cost, and change time.The improved binary multi-objective PSO algorithm (P-BMOPSO) was developed and used to solve the model successfully. Experimental results on the design change problem of a specific type of Skyworth TV showed that: (1) The proposed key strategies, including the position update strategy, the adaptive mutation strategy and the repair strategy of infeasible solutions, obviously improve the capability of P-BMOPSO to deal with the CPD problems; (2) Compared with existing multi-objective evolutionary algorithms, that is, NSGA-II,MOEA/D, NSGA-III, UNSGA-III, MO-Ring-PSO, and CMOPSO, P-BMOPSO can find a set of high-quality optimal solutions with good convergence and distribution; (3)Compared to classical propagation path planning algorithms(i.e.LRCPP), the proposed P-BMOPSO can search the solution space more effectively to obtain multiple optimal change plans instead of a single change path, and its result is significantly better than that of LRCPP;(4)The proposed algorithm can also output an optimal compromise solution by using the fuzzy membership function, when it is difficult for the decision-maker to provide their preference.Overall,the change selection model built in this paper provides a new way of solving the product change design problem,and the proposed P-BMOPSO is highly competitive to deal with CPD problems. ACKNOWLEDGEMENT This work was supported by The National Key Research and Development Program of China (No.2020YFB1708200). CONFLICT OF INTEREST The author declares that there is no conflict of interest that could be perceived as prejudicing the impartiality of the research reported. DATA AVAILABILITY STATEMENT The data that support the findings of this study are available from the corresponding author upon reasonable request. ORCID Yong Zhanghttps://orcid.org/0000-0003-0026-81814.1 | Traditional binary PSO
4.2 | Improved V‐type mapping function

4.3 | Adaptive mutation strategy

4.4 | The repair strategy of infeasible solutions
4.5 | Algorithm steps


4.6 | Complexity analysis
4.7 | Convergence analysis
5 | EXPERIMENTAL ANALYSES
5.1 | Test problem and experimental environment
5.2 | Analyses of key strategies

5.3 | Comparison with six multi‐objective evolutionary optimisation algorithms

5.4 | Comparison with the classical propagation path planning algorithm

5.5 | Solution selection and further analysis


6 | CONCLUSIONS
杂志排行

CAAI Transactions on Intelligence Technology的其它文章
- Fault diagnosis of rolling bearings with noise signal based on modified kernel principal component analysis and DC-ResNet
- Short‐time wind speed prediction based on Legendre multi‐wavelet neural network
- Iteration dependent interval based open‐closed‐loop iterative learning control for time varying systems with vector relative degree
- Thermoelectric energy harvesting for internet of things devices using machine learning: A review
- An embedded vertical‐federated feature selection algorithm based on particle swarm optimisation
- An activated variable parameter gradient-based neural network for time-variant constrained quadratic programming and its applications