Fault diagnosis of rolling bearings with noise signal based on modified kernel principal component analysis and DC-ResNet
2023-12-01YunjiZhaoMenglinZhouXiaozhuoXuNannanZhang
Yunji Zhao | Menglin Zhou| Xiaozhuo Xu | Nannan Zhang
1School of Electrical Engineering and Automation,Henan Polytechnic University,Jiaozuo,China
2Henan Key Laboratory of Intelligent Detection and Control of Coal Mine Equipment,Henan Polytechnic University,Jiaozuo, China
Abstract In view of the influence of aliasing noise on the effectiveness and accuracy of bearing fault diagnosis,a bearing fault diagnosis algorithm based on the spatial decoupling method of modified kernel principal component analysis (MKPCA) and the residual network with deformable convolution (DC-ResNet) is innovatively proposed.Firstly, the Gaussian noise with different signal-to-noise ratios (SNRs) is added to the data to simulate the different degrees of noise in the actual data acquisition process.The MKPCA is used to project the fault signal with different SNRs in the kernel space to reduce the data dimension and eliminate some noise effects.Finally, the DC-ResNet model is used to further filter the noise effects and fully extract the fault features through the training of the preprocessed data.The proposed algorithm is tested on the Case Western Reserve University(CWRU)and Xi'an Jiaotong University and Changxing Sumyoung Technology Co., Ltd.(XJTU-SY) bearing data sets with different SNR noise.The fault diagnosis accuracy can reach 100%within 30 min,which has better performance than most of the existing methods.The experimental results show that the algorithm has an excellent effect on accuracy and computation complexity under different noise levels.
K E Y W O R D S artificial intelligence, classification, deep learning, fault feature extraction
1 | INTRODUCTION
‘Made in China 2025’ proposed the comprehensive implementation of an innovation-driven development strategy, and took intelligent manufacturing as the main direction,focussing on key areas, such as intelligent terminals and high-end equipment.Rotating machinery as an important device in the industrial production process is of great significance to the development of intelligent manufacturing.
As the core component of rotating machinery, rolling bearing plays an important role in the safe operation of rotating equipment.Rolling bearing is prone to damage and failure due to its structure and characteristics.According to statistics,30%of mechanical equipment failures caused by vibration are caused by bearing failure [1].According to the fault data to grasp the working condition of rolling bearings,timely fault analysis and diagnosis will avoid the industrial production process caused by the failure of rolling bearings, improve the safety of the production environment and reduce economic losses.Therefore,it is necessary to correctly analyse the collected vibration data that may contain noise and other irrelevant factors.The existing bearing fault diagnosis technology is almost based on datadriven methods.According to the difference of diagnosis technology,the bearing fault diagnosis algorithm can be divided into bearing fault diagnosis technology based on pattern recognition[2–5]and deep learning methods[6,7].
Bearing fault diagnosis technology based on pattern recognition includes support vector machine(SVM)[8,9],K-nearest neighbour[10]algorithm,and backpropagation(BP)[11]algorithm.Research on bearing fault diagnosis based on pattern recognition commonly used signal processing technology to deal with the fault data collected by the sensor and feature extraction,and then use pattern recognition method for fault diagnosis and classification.Among them, the commonly used signal processing methods contain Wavelet Transform (WT) [12],Fourier Transform (FT) [13], Empirical Mode Decomposition[14],and Variational Modal Decomposition[15].The above fault diagnosis method based on pattern recognition has strong robustness and realises the fault diagnosis and classification of bearings to a certain extent.However, when the number of samples is large or unbalanced, the training effect of the model is poor, and there is a large space for progress in multi-class bearing fault classification tasks.
With the rapid development of computer science and artificial intelligence, a deep neural network has been widely studied and applied in the field of industrial process anomaly monitoring due to its strong self-learning and adaptive characteristics.The data-driven deep learning neural network is widely used in the field of bearing fault diagnosis.The deep learning algorithm in the field of bearing fault diagnosis is mainly composed of four basic network frameworks: stack self-coding network (SAE) [16], deep belief network [17],Convolutional neural network (CNN) [18], and recurrent neural network[19].It has developed to the recent Deformable Convolution Network(DCN)[20],Residual Network(ResNet)[21], Long Short-Term Memory Network [22], Capsule Network [23], Transfer Network [24] and their variants.
The application of deep learning in the field of bearing fault diagnosis is mainly divided into three methods: fault feature extraction based on deep learning,fault classification based on deep learning,and end-to-end fault feature extraction and fault diagnosis based on deep learning[25].For example,for the first method,[26]designed a bearing fault diagnosis method based on deep convolution neural network feature extraction and SVM fault classification for the multi-fault vibration signal of rotating machinery, which was assisted by two additional time-domain features extracted by human experts, and the diagnostic accuracy was up to 98.71%.For the second method, Qi et al.[27]proposed a fault diagnosis model based on a stacked sparse autoencoder.Withoutrequiring too much prior knowledge,deep learning is used to automatically extract more abstract and representative features.Combined with statistical analysis technology,industrial process monitoring is realised.The researchon the third method is the most extensive among the three research ideas.Zhou et al.[28] used continuous WT to convert onedimensional vibration signal into two-dimensional timefrequency image, and then used the network combined with CNN and a non-linear autoregressive neural network to extract and diagnose the fault feature.Bai et al.[29] proposed a data enhancement technology based on multi-channel CNN and multi-scale shear fusion from the requirement of training data.Firstly,the data were transformed into time-frequency images by short-time FT.Secondly,the end-to-end bearing fault diagnosis with low complexity, high robustness, and high accuracy was realised by using the designed network.
The existing methods based on deep learning can effectively extract fault features and complete fault classification tasks.However, in view of the strong non-linear coupling of the fault adjacent features of the bearing with noise in space and the low spatial discrimination,the existing methods mostly rely on the depth network for spatial decoupling.The stronger the coupling of data features is,the deeper the depth and width of the depth network are required.A deeper and wider model means a better non-linear expression ability, which can learn more complex transformations and thus fit more complex feature inputs.However, deeper and wider models require more training samples.Under actual conditions, the richness and diversity of fault samples are limited,which can easily lead to overfitting of depth models and reduce the generalisation ability of networks.
Therefore, in this paper, aiming at the fault data itself, a data preprocessing method of modified kernel principal component analysis (MKPCA) is introduced to decouple the spatial distribution, improve the spatial discrimination of fault categories,and realise the spatial decoupling of features.At the same time, a residual network with deformable convolution(DC-ResNet)with the ability to deal with noise interference is proposed to achieve high-precision and high-efficiency bearing fault diagnosis.Based on the decoupling ability of data and network model, this hybrid model of MKPCA and DCResNet is proposed.Firstly, Gaussian noise with different signal-to-noise ratios (SNRs) is added to the data to simulate different degrees of noise in the actual acquisition process.The improved KPCA MKPCA is used to map the kernel space of the fault signal containing different SNRs to reduce the data dimension and eliminate some noise effects.Finally,the DC-ResNet network is used to further filter the noise effects and fully extract the fault characteristics through the training of the preprocessed data.The algorithm is tested on the Case Western Reserve University (CWRU) and Xi'an Jiaotong University and Changxing Sumyoung Technology Co., Ltd.(XJTU-SY) bearing data sets with different SNR noise,and the fault diagnosis accuracy can reach 100%in 40 iterations.The experimental results show that the algorithm has an excellent effect on bearing fault diagnosis with noise.
The innovations and contributions of this paper are summarised as follows.
• A novel modified KPCA (MKPCA) data preprocessing method is developed to decouple the spatial distribution,improve the spatial discrimination of fault categories, and realise the spatial decoupling of features.
• A new fault diagnosis method based on modified KPCA(MKPCA) and DC-ResNet deep learning algorithm is proposed to achieve 100% diagnostic accuracy for rolling bearings with noise signal.
• Comprehensive experiments are designed and carried out to fully verify the effectiveness of MKPCA and DC-ResNet model by comparison with CNN model and ResNet model under the noise with different SNRs.
2 | RELATED WORK
2.1 | Signal-to-noise ratios
In the industrial processes, the collected bearing fault data by several sensors is normally in the form of vibration signals.Due to the mechanical characteristics of the rolling bearing,irrelevant information is inevitably contained in signals.This irrelevant information is called noise.In the process of fault diagnosis,the amount of noise contained in collected data will affect the accuracy of diagnosis to different degrees.The SNRs are proposed to quantify the level of noise contained in the signals.It is the ratio of signal power to the noise power,which is expressed by Equation (1).
The higher the SNR,the less noise is mixed into the signal.When SNR is 0,the proportion of fault signal and noise signal is the same.Figure 1 shows the graphs of original signal,noise and their superimposed signal on CWRU data.
wherePsdenotes the power of signals andPnis the power of noise.
To realise a better real simulation of noise, Gaussian noise is used as the noise source to add to the public bearing data sets.In real environments, noise is often not caused by a single source, but by a complex of noise from many different sources.Assuming that real noise is regarded as the sum of many random variables with different probability distributions and each random variable is independent.In that way, the normalised sum tends to a Gaussian distribution with the increase of the number of noise sources according to the Central Limit Theorem.Based on this assumption, the use of synthetic Gaussian noise is a simple and accurate approximation to deal with this complexity without knowing what the noise distribution is.The method of adding different SNR noises is elaborated as Algorithm 1.
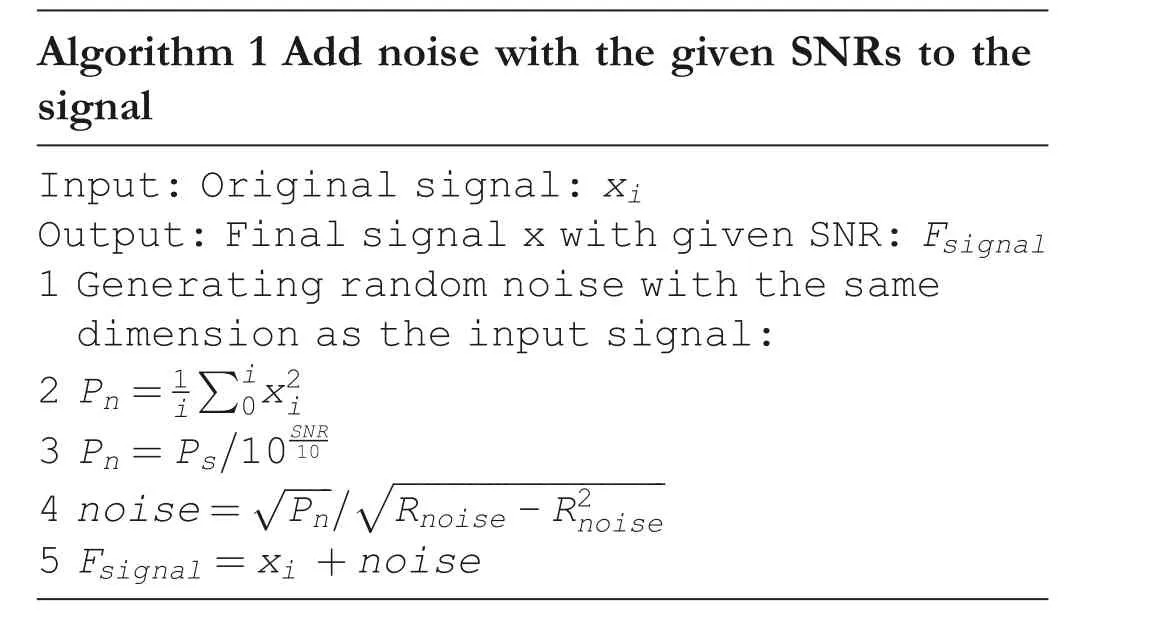
Algorithm 1 Add noise with the given SNRs to the signal Input: Original signal: xi Output:Final signal x with given SNR:Fsignal 1 Generating random noise with the same dimension as the input signal:2 Pn= 1iΣi0x2i 3 Pn=Ps/10SNR 10 4 noise= ——--Pn√ / ————————————————Rnoise-R2noise■5 Fsignal=xi +noise
2.2 | Modified kernel principal component analysis
In the research and application of fault diagnosis based on deep learning, it is necessary to collect and analyse a large number of data that reflect the fault characteristics.These data often contain multiple variables,and there may be a correlation between these variables.A large amount of data will undoubtedly provide a lot of information to facilitate the training of more accurate neural network models, but at the same time, it will increase the complexity and calculation of the network, thereby affecting the diagnostic efficiency.However,blind reduction of data or variables may lead to the loss of important information and make the network produce wrong conclusions.
Principal component analysis is based on the above problems.Through spatial mapping, while reducing the number of indicators to be analysed, it minimises the loss of information contained in the original data, and then makes acomprehensive analysis of the collected data.Principal component analysis is applied to linear separable cases.When the original data are non-linear,KPCA is needed.The data set is mapped from n-dimensional to high-dimensionalN>nwith linear separable, and then it is reduced from Ndimensional to a low-dimensional.

F I G U R E 1 The signal diagram of original, noise and its superposition on CWRU data.(a) fault type 1; (b) fault type 2; (c) fault type 3; (d) fault type 4;(e) fault type 5.
In this paper, the KPCA is improved, and a spatial mapping data preprocessing method based on modified KPCA(MKPCA) is proposed.Gaussian radial basis function is used to convert the inner product operation of the feature space after non-linear transformation into the kernel function calculation of the original space, to realise the non-linear transformation space, feature space, and category space is realised.The standard MKPCA mapping matrix of five fault categories is calculated first.Then kernel space mapping of fault signals with different SNRs is performed to reduce the data dimension and eliminate some noise effects.
Firstly, the square of Euclidean distance between data is calculated by Equation (2):
Secondly,the kernel matrix K is calculated by Equations(3)and (4).
F I G U R E 2 Residual block
Finally, the eigenvalues of the kernel matrixKare calculated, and the eigenvectors corresponding to the eigenvalues are calculated to form the mapping matrixP.
2.3 | ResNet
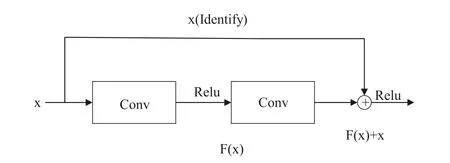
The core of the deep residual network is to introduce a deep residual learning framework into the network.Compared with the characteristic that each stack layer of a CNN such as VGG-16 is directly suitable for a desired underlying mapping,ResNet explicitly makes these layers suitable for a residual mapping[30].The residual network is composed of a series of residual blocks, as shown in Figure 2.
A residual block can be represented by Equation (5):
wherexlandxl+1are the input and output,F(xl,Wl) is the residual part, and refers to the gap between the predicted and observed values.The layer of the network can usually be seen asy=H(x), and a residual block of the residual network can be expressed asH(x)=F(x) +x,that is,in the unit mapping,y=H(x)is the observed value,but theH(x)predicted value,soF(x)corresponds to the residual, so it is called the residual network.
In the convolution network,the number of feature maps ofxlandxl+1is different, and then 1×1 convolution is needed for dimension elevation or dimension reduction, as shown in Figure 3.
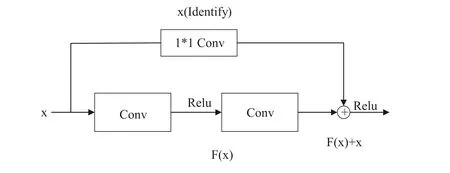
F I G U R E 3 Residual block with dimensions up or down
The residual blocks in the residual network have two forms, as shown in Figure 4 respectively.Among them,Figure 4a is applied to ResNet at 18 and 32 layers, namely ResNet-18/32, Figure 4b is applied to ResNet at 50, 101, and 152 layers, namely ResNet-50/101/152.
3 | FAULT DIAGNOSIS OF ROLLING BEARINGS WITH NOISE SIGNAL BASED ON DC-ResNET
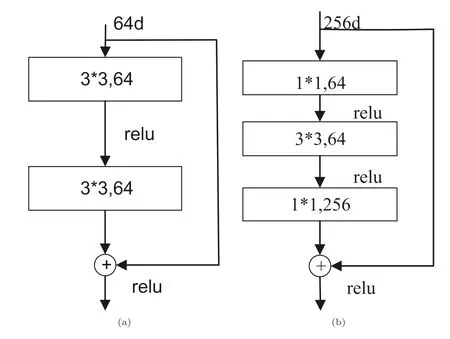
F I G U R E 4 Two forms of convolution in the residual block
Convolutional neural networks have made breakthrough achievements in image classification, behaviour recognition,and other fields due to their strong feature extraction ability.The stacked layers in the network can integrate shallow,middle, and deep features, and achieve an end-to-end classification and recognition effect.Due to the above characteristics and intelligent classification characteristics, in recent years, many studies have introduced it into the field of intelligent fault diagnosis and it plays an important role in the field of bearing fault diagnosis.In the application process,some image classification and behaviour recognition processes need to use the deep features contained in the data, so it is necessary to deepen the number of network layers to extract deep features.In the actual training process, to a certain extent, with the increase in the number of network layers, the training loss will increase and the classification accuracy will decrease.This is because the increase in the number of network layers will lead to gradient disappearance and gradient explosion.Although the addition of BatchNorm,ReLu, Dropout regularisation, and other technical means can alleviate the problem of reduced training accuracy caused by overfitting to some extent, the effect remains to be improved,and the gradient disappearance and gradient explosion are not caused by overfitting.The purpose of ResNet can effectively solve the above problems, and its successful application in bearing fault diagnosis ensures the accuracy and efficiency of diagnosis [31, 32].Figure 5 gives the overall flow of the algorithm, and Table 1 gives the specific parameters of DCResNet used in this paper.
The residual network used in this work is to add the residual unit shown in Figure 4b to the classical VGG deep learning model to form ResNet-101.Furthermore, the deformable convolution is introduced into ResNet, replacing the ordinary convolution at the first layer of the network with the deformable convolution [33] to form the proposed DCResNet.The deformable convolution can fully extract the fault information contained in the data at the first layer of the network with its adaptive convolution kernel [34].It provides convenience for the subsequent residual module to extract fault information and noise information.The deformable convolution operation is shown in Equation (6).
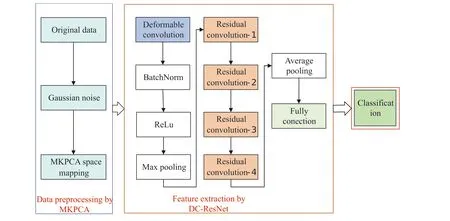
F I G U R E 5 Overall flowchart of modified kernel principal component analysis (MKPCA) + DC-ResNet.
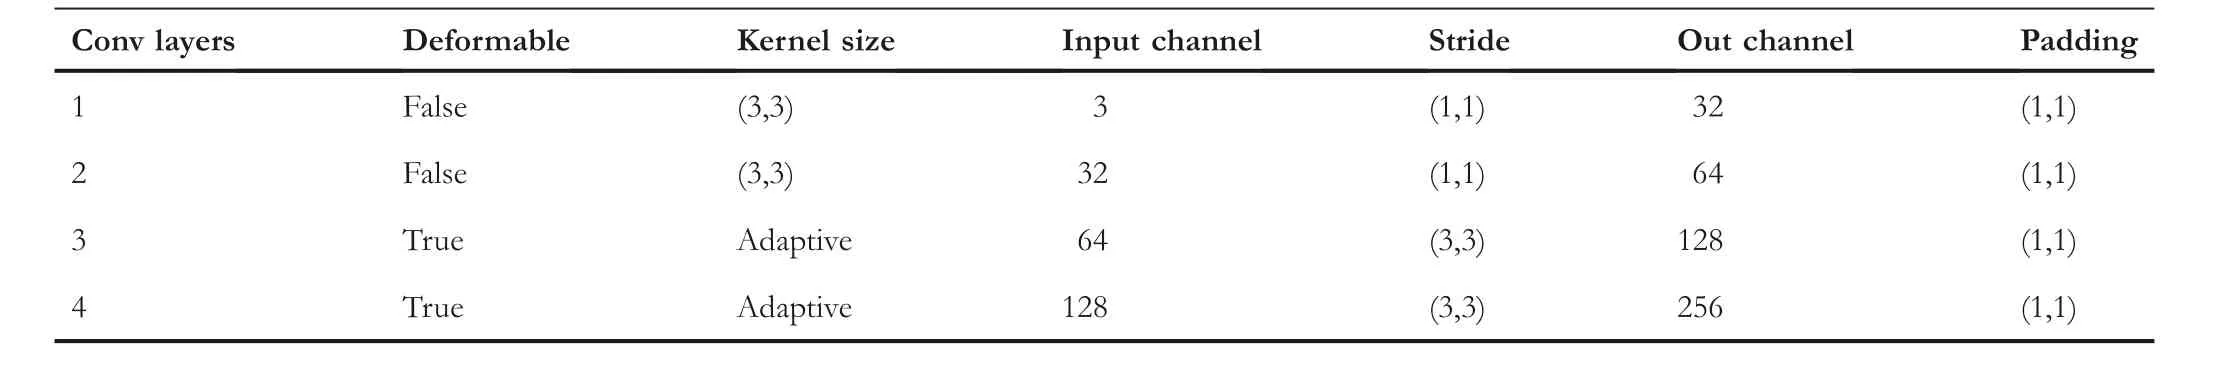
T A B L E 1 Parameters of DC-ResNet model

F I G U R E 6 Network framework of modified kernel principal component analysis (MKPCA) + DC-ResNet.
where ∆tnis the offset learnt by the extra convolution layer.
The algorithm is mainly composed of spatial mapping preprocessing of noisy data and residual network fusion deformable convolution deep learning network model.Firstly,Gaussian noise with different SNRs is added to the original data collected by the sensor to simulate the different degrees of noise interference in the process of actual data acquisition.Modified kernel principal component analysis spatial mapping is used to reduce the data dimension and eliminate part of the noise data.The data after spatial mapping is converted into a two-dimensional graphical residual network fusion deformable convolution input deep learning network,and the bearing fault diagnosis model is trained.Figure 6 shows the network diagram of model training.The data preprocessing method of MKPCA can decouple the spatial distribution, improve the spatial discrimination of fault categories,and realise the spatial decoupling of features.The DC-ResNet has the ability to deal with noise interference to achieve high-precision and highefficiency bearing fault diagnosis.The hybrid model of MKPCA and DC-ResNet proposed in this paper has an excellent effect on bearing fault diagnosis with noise.
4 | THE DESCRIPTION OF TWO CASE STUDIES
In the actual industrial production process, due to external factors such as overload of mechanical equipment, excessive vibration frequency, or internal factors such as fatigue of bearing materials and long service life, various degrees and different types of bearing faults will be caused.According to the bearing components and structural characteristics of rolling bearings, rolling bearing faults are often divided into wear,fracture,corrosion, and deformation of different parts.In this study,deep learning technology is used to diagnose and classify the wear, fracture, and deformation of the outer ring, inner ring, and rolling body in different degrees.
Due to the importance and wide applicability of rolling bearings, they are often used with different mechanical equipment in various industrial backgrounds and working environments.Therefore, rolling bearings under different working environments have different working mechanisms and failure modes.In this paper,the working environment and fault types of two common bearing data sets are described in detail.
4.1 | The case study of CWRU
CWRU is a bearing dataset provided by Case Western Reserve University.The data acquisition experiment platform is shown in Figure 7[35],which includes the data of fan end,drive end,and ball end.The three channel fault data are respectively collected by three sensors.The CWRU dataset used in this paper contains 5 types of faults that occur to the roller, inner ring,outer ring 3 points,outer ring 6 points and outer ring 12 points.The main fault types are shown in Table 2.In Table 2,12k represents the fault sampling frequency of 12 kHz, 0.007,0.014, 0.021 refer to diameter respectively.
F I G U R E 7 CWRU testing rig
The CWRU dataset used in this study includes 9900 training datasets and 375 test datasets.The sizes of the training and testing datasets are [9900, 2048, 2] and [375, 2048, 2]respectively.Each dataset has 2 dimensions, and each dimension contains 2048 data points.To a certain extent, the more data,the better the stability and robustness of the deep learning network.Therefore, in order to make the dataset contain a sufficient number of samples, the data is repeatedly selected with a certain step size to prepare the training dataset and test dataset.
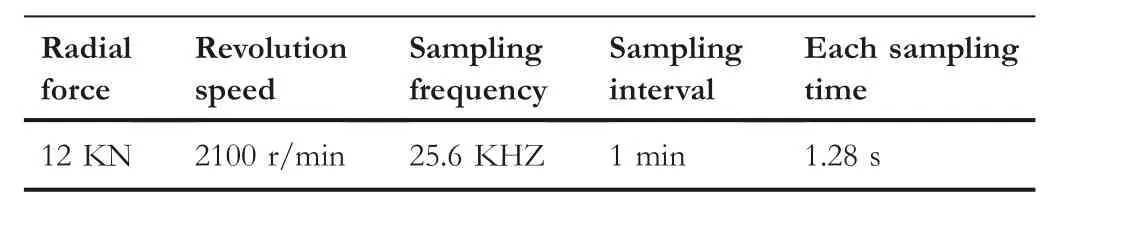
T A B L E 3 Working environment of XJTU-SY bearing data
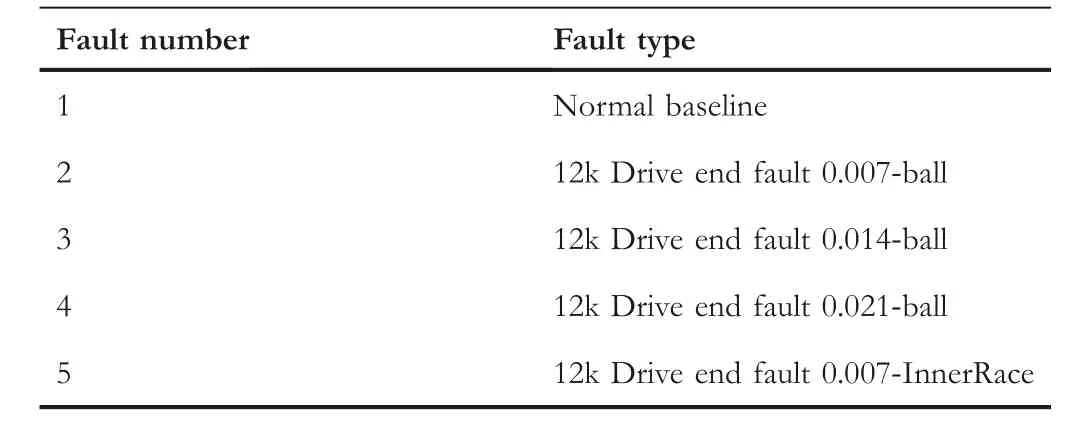
T A B L E 2 Five fault types of CWRU datasets
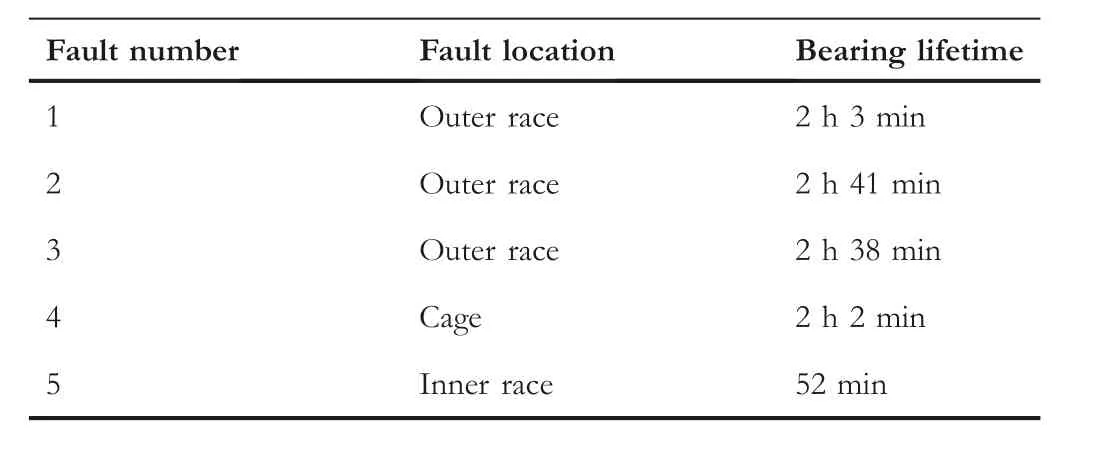
T A B L E 4 Fault types of XJTU-SY bearing data set at 2100 rpm (3 5 Hz and 12 kN)

F I G U R E 8 XJTU-SY testing rig
4.2 | The case study of XJTU-SY
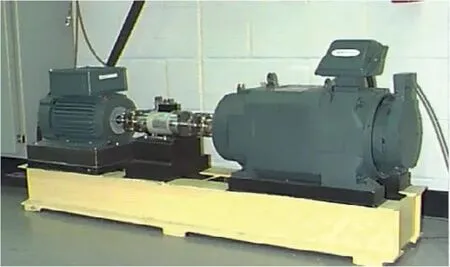
XJTU-SY bearing dataset provided by the Institute of Design Science and Basic Parts, Xi'an Jiaotong University [36].The test bench is shown in Figure 8.There are 3 vibration frequencies, 2100 rpm (35 Hz) and 12 kN, 2250 rpm (37.5 Hz)and 11 kN, 2400 rpm (40 Hz) and 10 kN respectively.Each frequency contains five fault types.Therefore, the data set contains 15 kinds of complete operation rolling bearings fault data.These data are obtained by several accelerated degra-dation experiments.In this study, only five fault categories are included in the 35 Hz vibration frequency.The XJTU-SY bearing data set has two channels: vertical vibration and horizontal vibration.The bearing working data of two channels are collected by two sensors in a specific working environment, as shown in Table 3 and the fault type as shown in Table 4.
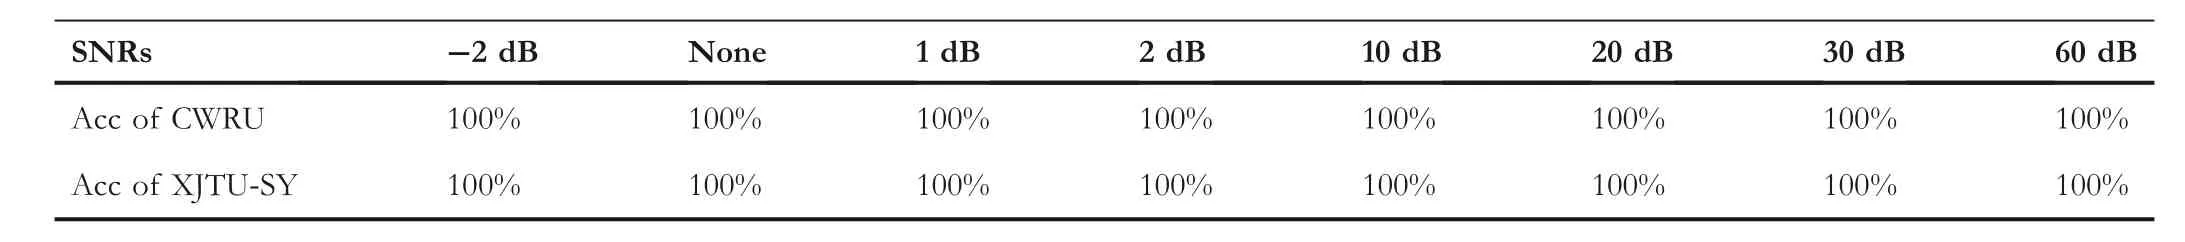
T A B L E 5 Maximum test accuracy of the model under different signal-to-noise ratios (SNRs) within 30 iterations
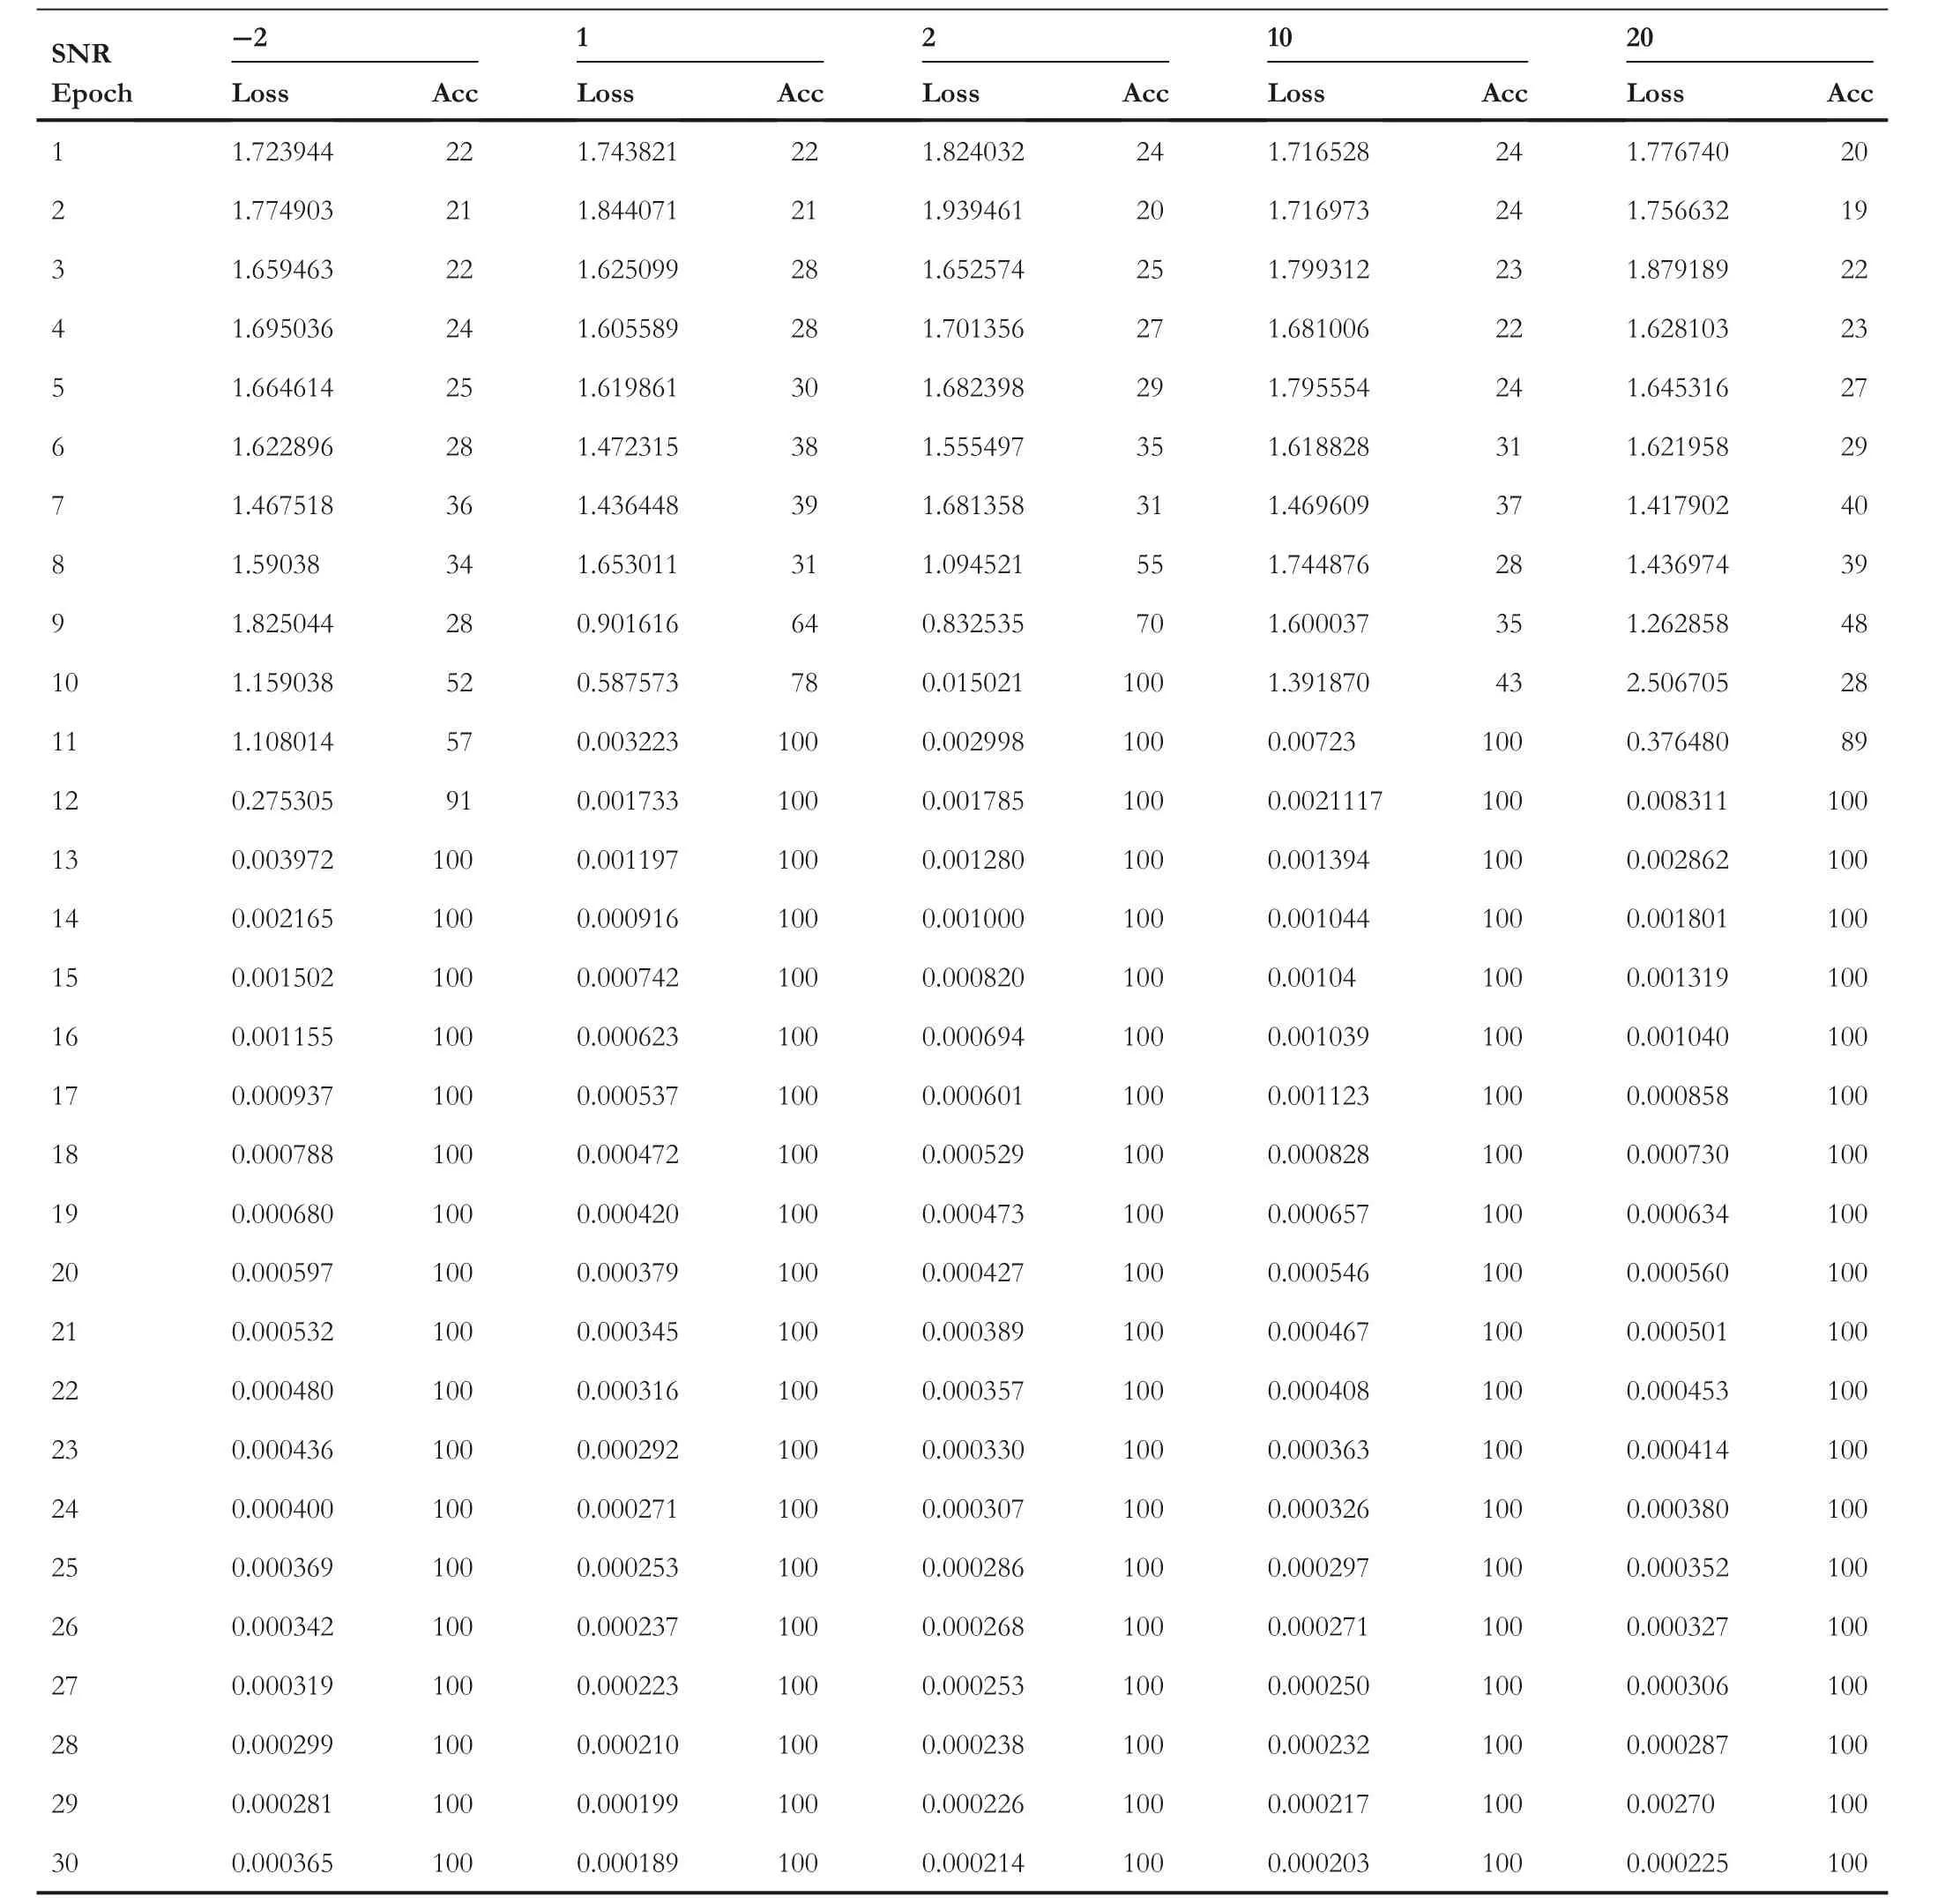
T A B L E 6 Test loss and accuracy on CWRU datasets with different signal-to-noise ratios (SNRs) in 30 iterations
All kinds of fault type data in XJTU-SY rolling bearing dataset are composed of two-dimensional horizontal vibration signals and vertical vibration signals.Only horizontal vibration signals are used in this paper.
5 | EXPERIMENTAL RESULTS AND DISCUSSION
Intel (R) Core (TM) I7-9700 CPU @K3.60 GHz processor with memory of 32.0 GB was used in the experiment, and NVIDIA GeForce GTX 1080 GPU was used in the experiment under the 64-bit Window system.Python was used as the programming language for MKPCA spatial mapping data preprocessing and network structure construction under the PyCharm integrated development environment.In the training and testing process of DC-ResNet fault diagnosis model,Batch-size and learning rate are 128 and 0.001, respectively,and the training link is iterative 30 times.
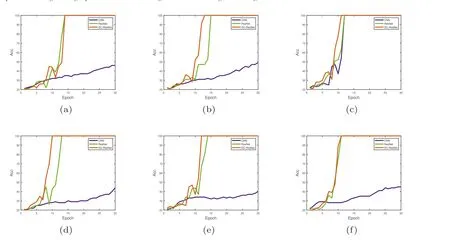
F I G U R E 9 Comparison for different signal-to-noise ratios (SNR) of Convolutional neural network (CNN), ResNet and DC-ResNet on CWRU.

F I G U R E 1 0 Comparison for different signal-to-noise ratios (SNR) of Convolutional neural network (CNN), ResNet and DC-ResNet on XJTU-SY.
In order to collect fault data and contain noise as widely as possible in engineering operations, noise with signal-to-noise ratio of -2, 1, 2, 10, 20, 30, 60 is added to the original fault data in this experiment.When the signal-to-noise ratio is negative, that is, the noise and other irrelevant factors in the signal are higher than the useful fault data.The lower the signal-to-noise ratio, the more the noise data contained.The maximum value of the signal-to-noise ratio is 60.When the signal-to-noise ratio is 0,the proportion of the fault signal and the noise signal is the same.This algorithm is verified on the public bearing datasets of CWRU and XJTU-SY.The maximum training accuracy and test accuracy of the model are 100%within 30 iterations,as shown in Table 5.The results of CWRU and XJTU-SY datasets under different SNRs are described in the following respectively.
Tables 6 and 7 show the test loss and accuracy on CWRU and SJTU-SY datasets under different SNRs within 30 iterations.
Since the lower the signal-to-noise ratio is,the more noise the fault data contain, Tables 6 and 7 only show the test loss and accuracy of the fault diagnosis model when the signal-tonoise ratio is -2, 1, 2, 10, and 20.When the signal-to-noise ratio is 30 and 60, the model reaches 100% diagnostic accuracy earlier than 15 epochs.
In order to fully verify the advantages of the DC-ResNet deep learning fault diagnosis model proposed in this paper,the fault data under different SNR are tested on the ordinary CNN (CNN) and residual network (ResNet), and the diagnostic accuracy is compared.Figures 9 and 10 show the comparison curves of the diagnostic accuracy on CNN,ResNet and DC-ResNet between the fault data without noise signal and the SNR of-2,1,2,10,and 20 on the CWRU and XJTU-SY bearing data sets respectively.
In Figures 9 and 10,red,blue,and green lines represent the diagnostic accuracy of DC-ResNet, CNN, and ResNet networks respectively.It can be seen from Figure 9 that the red line is close to the green line, and the blue line is relatively distributed in the lower half of the image, that is, the CWRU bearing data with noise have high diagnostic accuracy and consistent diagnostic effect on DC-ResNet and ResNet networks.The effect on CNN network is poor.It can be seen from Figure 10 that there are certain differences among the three lines, and the red lines are above the other two lines under different SNRs, that is, the XJTU-SY bearing data with noise have the best diagnostic effect on DC-ResNet.Overall,the DC-ResNet proposed in this paper has an excellent effect on bearing fault diagnosis with noise.
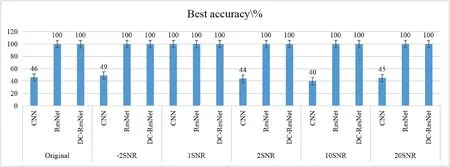
F I G U R E 1 1 The diagnostic accuracy histograms of different noises on CWRU dataset on Convolutional neural network(CNN),ResNet and DC-ResNet.
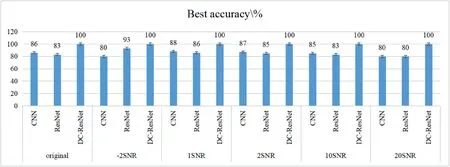
F I G U R E 1 2 The diagnostic accuracy histograms of different noises onXJTU-SY dataset on Convolutional neural network (CNN), ResNet and DCResNet.
Figures 11 and 12 show the diagnostic accuracy of CWRU and XJTU-SY data under different noise levels in three deep learning networks in the form of a histogram, which more intuitively shows the superiority of DC-ResNet in the stabilityand diagnostic accuracy of CWRU and XJTU-SY bearing data with noise.
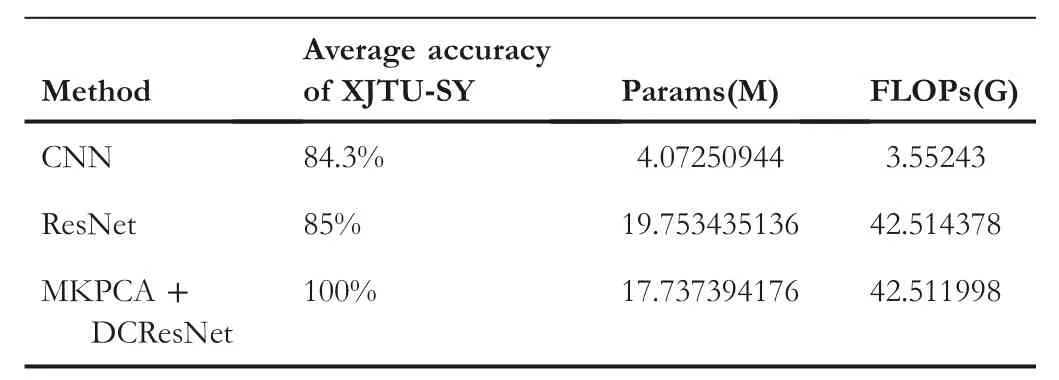
T A B L E 8 Accuracy and computational complexity comparison of the proposed method and other methods
The confusion matrix is the correspondence between the predicted label and the real label.The diagnostic accuracy of the noise-containing fault data on the DC-ResNet network model under different SNRs after MKPCA high-dimensional spatial mapping is 100%, that is, the predicted label is completely corresponding to the real label.In order to avoid overstatement,only the confusion matrix of the diagnosis results of XJTU-SY bearing data on the 3 deep learning network models is typical when the SNR is-2, 1, 10, and 30.The utility of the DC-ResNet model is expressed from the correspondence between the predicted label and the real label.Figures 13–15 give confusion matrix diagrams of three deep learning network models when SNR is-2, 1, 10, and 30 respectively.

F I G U R E 1 3 Fault diagnosis confusion matrix diagram of XJTU-SY data on Convolutional neural network (CNN) model under different SNRs.

F I G U R E 1 4 Fault diagnosis confusion matrix diagram of XJTU-SY data on ResNet model under different SNRs.
The number in the confusion matrix graph represents the correspondence between the predicted label and the real label,that is, the diagnostic accuracy of each fault category, 1 being the highest diagnostic accuracy.For 500 data with a real label of two in a fault category,if the predicted label is all 2,the number‘1’ appears in the rectangular block of the third row and the third column, and the number is all 0 in the other rectangular blocks of the third row.If the predicted labels are all 3,then the number ‘1’ appears in the rectangular block of the fourth column in the third row, and the number is 0 in other rectangular blocks in the third row, which is the same as the theorem.The colour depth of rectangular blocks in the graph also represents the diagnostic effect.As the colour column on the right side of each subgraph shows,the deeper the colour is,the greater the number is, that is, the more the corresponding number is.It can be seen from Figures 13–15 that for the noise-containing fault data with different SNR, the diagnostic effect of CNN network is worse than that of ResNet and DCResNet networks, and that of ResNet network is worse than that of DC-ResNet.
In order to fully verify the usability of the proposed DCResNet model, this paper compares the computational complexity of the model with CNN and ResNet.Parameters(Params) and floating-point operations (FLOPs) are measurable indexes to show the computational complexity of a deep learning model.Table 8 presents the accuracy, Params and FLOPs of three deep learning models.It can be seen from Table 8 that the DC-ResNet model has the highest accuracy when the parameters are moderate.
To sum up, through the experiments under different data sets and different SNR, and the comparison with CNN and ResNet network diagnostic accuracy,it is fully verified that the proposed algorithm in this chapter has high diagnostic accuracy and stable diagnostic effect for bearing fault data with noise.
6 | CONCLUSION
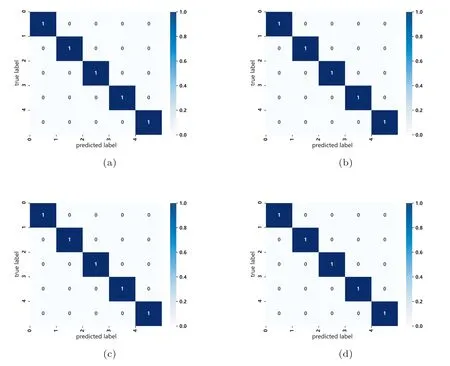
F I G U R E 1 5 Fault diagnosis confusion matrix diagram of XJTU-SY data on DC-ResNet model under different SNRs.
The bearing fault diagnosis algorithm based on improved KPCA high-dimensional space mapping and fusion of deformable convolution residual network is designed in this chapter.Aiming at the bearing fault data containing noise factors collected by the sensor, MKPCA high-dimensional space mapping is applied to reduce the data dimension and eliminate some noise interference at the same time.The mapped data are converted into two-dimensional images to construct the training set and test set.The DC-ResNet deep learning network is used to fully extract the fault characteristics, noise information and other factors contained in the image of the training set to realise the classification and diagnosis of bearing faults.By adding noise with different SNR to CWRU and XJTU-SY common bearing data sets,the diagnosis experiment is carried out, which fully reflects the applicability of the algorithm designed in this paper to the fault diagnosis of bearing with noise, and shows the superiority of the algorithm designed in this chapter in the diagnosis accuracy.At the same time, the comparative experiments with CNN and ResNet networks show that the residual network designed in this chapter with deformable convolution is superior to the ordinary convolution neural network and the ordinary residual network in the fault diagnosis of noise bearing.
ACKNOWLEDGEMENT
We thank the anonymous reviewers for their valuable suggestions and comments on this work.We also wish to thank the authors of DCN for providing the source code.
This research was funded by the Foundation of the National Natural Science Foundation of China grant number 61973105, 61573130 and 52177039; the Fundamental Research Funds for the Universities of Henan Province (NO.NSFRF200504); The Key Technologies R&D Program of Henan Province of China(NO.212102210145,212102210197 and NO.222102220016).
CONFLICT OF INTEREST
No potential conflicts of interest are reported by the authors.
DATA AVAILABILITY STATEMENT
The data that support the findings of this study are available from the corresponding author upon reasonable request.
ORCID
Menglin Zhouhttps://orcid.org/0000-0003-4395-5256
杂志排行

CAAI Transactions on Intelligence Technology的其它文章
- Leveraging hierarchical semantic‐emotional memory in emotional conversation generation
- Short‐time wind speed prediction based on Legendre multi‐wavelet neural network
- Iteration dependent interval based open‐closed‐loop iterative learning control for time varying systems with vector relative degree
- Thermoelectric energy harvesting for internet of things devices using machine learning: A review
- An embedded vertical‐federated feature selection algorithm based on particle swarm optimisation
- An activated variable parameter gradient-based neural network for time-variant constrained quadratic programming and its applications