History dynamics of unified empire in China(770 BC to 476 BC)
2023-12-01PengLuMengdiLiJiawenLuZhuoZhang
Peng Lu| Mengdi Li| Jiawen Lu | Zhuo Zhang
1Department of Sociology,Central South University,Changsha,China
2School of Automation,Central South University,Changsha,China
3Social System Center,Beijing Institute for General Artificial Intelligence, Beijing,China
4Depart of Economics,Graduate School of Arts &Sciences,Columbia University,New York,New York,USA
Abstract The laws and regulations in human history can be revealed by computational models.From 221 before Christ (BC) to 1912 Anno Domini (AD), the unification pattern has dominated the main part of Chinese history for 2132 years.Before the emergence of the first unified empire,the Qin Empire in 221 BC, there existed the Eastern Zhou dynasty(770 BC to 221 BC).This long dynasty has two stages, and here we focus on the first stage.This Spring–Autumn stage was from 770 BC(with 148 states)to 476 BC(with 32 states).The whole country (China) is modelled as a multi-agent system, which contains multiple local states.They behave autonomously under certain action rules (wars and conflicts), which forms the main reason for the annexations and disappearance of most states.Key factors (power, loyalty, bellicosity and alliance) have been considered in our model settings,and simulation outcomes will be monitored and collected.Eventually,an optimal solution is obtained, which well unveils the internal mechanism and statistical features of real big history.Furthermore, counterfactuals are used to explore the nonlinear effects of the key factors, which deepens the authors’ understanding of civilisation evolutions in human history.
K E Y W O R D S civilization dynamics, empire dynamics, the great unity
1 | INTRODUCTION
For human society,civilisation is a historic-cultural entity,with various peoples (ethnic groups) sharing common values [1].According to the ‘axial age’ theory [2], both Chinese and Western civilisations may have some initial similarities.Then,agricultural China entered the unification era, in terms of the political system and official ideology(Confucianism)[3]in East Asia.However, in the west, the unification pattern has not been achieved since the very beginning.The unified Roman Empire (in 395 Anno Domini [AD]) broke into two small empires, which were struggling for their interests.The weak cohesion led to political instability, which was worsened by corruption [4].In 476 AD, the Western Roman Empire was destroyed by the barbarians and split into 10 countries (East Gothic Kingdom, French Kingdom, and others).Hence,eastern (China) and western civilisations became two distinct ones [5].For several successive empires (dynasties) in the history of China, unification (the great unification) has been the dominant pattern since the Qin Empire(221 before Christ[BC]).After the chaotic (competing) period, a newly unified empire will win the power,and the emperor(royal family)will govern all under heaven[6].The first empire(Qin)opened the unification tradition of China [7].Before it, we have the Eastern Zhou dynasty (from 148 states to 1 state), which was filled with wars[8].As the origin,the Eastern Zhou dynasty is critical to understanding the unification forming.This complex process has two stages (see Table 1), and here we focus on exploring the first one, the Spring–Autumn stage (from 148 states to 32 states).
The war within divided states is the main force of the unification process.Related researches include:(a)The role of ancient wars.The wars can be frequently witnessed in history,such as in Ancient Egypt[9],the Near East[10],and India[11].Empire expansions were largely done by military conquests[12].As a tool to defend national interests and sovereignty[13],ancient wars also shaped social structure and social progress[14].For example,the two world wars and the cold war formed a new social structure of modern China [15, 16].Wars also impact the political environment.Hence, the war has beenalways the main factor in the unification[17];(b)Strategies of ancient wars.Ancient Chinese thinkers (Sun Tzu) proposed principles and strategies of wars, which has influenced ancient wars [18] and after that, modern counter-terrorism [19], and even business [20].Most rules of wars have been supported and verified by western-world wars [21]; (c) Quantitative research of ancient wars.Wars can be modelled in mathematical differential equations [22].However, they are blamed for their discrepancy in practice.Besides,wars can be evaluated by empirical data.For instance, qualitative data has been used to explore wars and deaths in global history [23].For the history of Europe, factors of wars (territory, commerce, and navigation)can be also analysed[24],and reasons for wars also be quantitatively checked [25].Based on daily GIS code caselevel data, alliance structures can be also identified [26].Quantitative studies have advantages and seem to be more convincing; (d) Emerging interdisciplinary research.Natural science methods have been used to explore wars in history.The frequency versus magnitude obeys the power law [27],which can be further explained by self-organised criticality[28].This also applies to war durations in ancient China, and it follows stretched exponential patterns [29].

T A B L E 1 Two periods before the unified empire of Qin dynasty
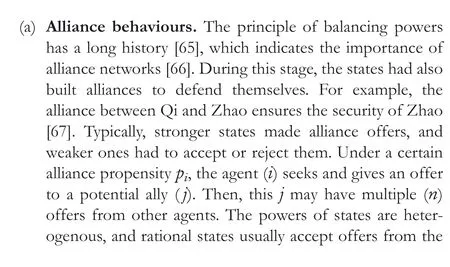
Besides wars, cooperative behaviours (alliance) are also critical to the forming of civilisations [17].Under common commitments, all the members involved should protect each other during the wars and conflicts [30]: (a) The role of alliance.Seeking security is the basic function of the alliance[31].One state can discourage potential adversaries to launch wars, and they may give up if the aggregated strength of the multi-national force is known [32].A successful alliance helps to enhance the defence capability of its members [33].Alliances can maintain equilibriums and balance powers, which contributes to peace and stability [34]; (b) Factors of the alliance.The presence of common foes urges related states to form allied networks.Aggregate military capabilities play a central role, and the alliance probability has an inverted Ushaped relationship with the military capabilities of potential alliances [31].Constitutive norms and effective alliance performances shape the choice of an alliance.There are no incentives to quit the alliance if the benefits are greater [35].There are also other factors, such as foreign policies, regime types, democracy, distance, national borders, and the level of threats faced [31]; (c) Alliances and wars.Sometimes, alliances may increase the likelihood of wars but also may reduce wars [30].For the alliance-war relationship, data indicates that wars can be substantially reduced [34].Game theory may examine how alliances affect the behaviours of states, but it is weak to reveal the mechanism, under specific social structures and environments [36].
As static and macro-level analyses, the explanatory power of existing work is limited.The formation process of a unified civilisation should be considered a complex and dynamic system [37], as the process should be deemed as systemic emergence [38, 39].Kant (1781) believes that human history, as a part of nature, must be as regular as nature [40].Natural rules in physics have been used in social studies,such as population analysis [41], space activities [42], social movements [43], and social behaviours[44].Under the framework of the multi-agent system (MAS), we can bridge social sciences and natural sciences to explore common laws across multiple systems.Therefore, we use agent-based modelling (ABM) to reveal these evolutionary dynamics, based on perspectives of multiagent interactions [45].For the system of agents, it can be deemed as the adaptive system [5].This unification process in history is complex, and here we focus on the first stage (770 BC to 476 BC),the Spring and Autumn period.As the turning point in history [46], this period is the foundation to form a unified civilisation [8].Based on the historical data, we set behavioural rules of 148 states,to present how they declined to 32 ones.This work deepens our understanding of a unified civilisation.
2 | METHODS AND MATERIALS
2.1 | Why agent‐based modelling (ABM)?
We apply ABM,which suits complex systems[47].It has been widely used in military strategies[48],international interactions[49], and civilisation evolutions [50].As an efficiency-oriented civilisation, instrumentalism dominates the Chinese culture(wars,politics,economy,and ideology),which has been formed since then.The social process [51, 52] of this period breeds a unified civilisation and culture for China.Therefore, ABM is better at revealing this dynamic mechanism.Under the framework of MAS, we can bridge social sciences and natural sciences to explore common laws across multiple systems.We believe that our work has extended the application scope of both complex systems and history dynamics,which can help us to understand the unity mechanism in this Spring–Autumn period.
2.2 | The facts of real history
Guided by complex system theory,we deem the whole country(Eastern Zhou) as a complex system, with one weak central government (Zhou) and scattered but powerful states.We model real history as follows:(a)The duration of history.In the Western Zhou dynasty, basic concepts of civilisation have been formed [53].At the beginning (1046 BC), the royal(Zhou) family adopted the state system where states are responsible to protect the central government[54].In the year of 770 BC, the Western Zhou perished and the Eastern Zhou commenced[55].For Eastern Zhou,the first period is Spring–Autumn (770 BC to 476 BC), which lasted for 295 years; (b)The size of states.When the Eastern Zhou was initially formed in 770 BC,we have 148 states,such as 10 strong states and 138 weak ones[56].They were autonomous military states,competing for territories and expanding power for themselves[56].But in the end,the number was 32(11 strong and 21 weak states); and (c) The areas of states.The territory is a key element of states [57].Historical materials suggest that state territories changed greatly, which can be found if we compare the two subfigures of Figure 1.We import the map and set the colours of states.We import the map of the late Spring–Autumn period to show this change.T At the end of this period, the size of states has decreased and the map has also changed significantly, from the initial year of 770 BC to the final year of 476 BC.
2.3 | Agent settings
During this Spring–Autumn stage, the war was the key factor influencing the civilisation forming in ancient Chinese [57].For ancient history, it is hard to accurately know the data on natural resources, population, geographical situation, and natural borders for the states.According to the Occam's razor principle, we should choose simple and effective factors(war, power) and omit other useless factors (geographical location, or distance).We deem the whole country (Eastern Zhou) as a multi-agent system, with one weak central government (Zhou) and scattered but powerful states (agents).The core task is to back-calculate this process within the same years.The settings are: (a) The duration of interactions.From 770 BC to 476 BC, this Spring–Autumn period experienced 295 years.For the running steps of our simulations, it should be 295 ticks; (b) The number of agents.According to history, the initial size of agents isN=148,and the final size is 32.For our simulation,the same outcome should be achieved;(c)The power of states.Power is a symbol of a state's comprehensive force, including population,economy,geographical situation,and so on.According to capabilities and resources, we have strong and weak states[58].For the initial size, we setNstrong= 10 strong andNweak= 138 weak states.We set the initial powers ranging from 0 to 100,and the threshold as strong as 90.At the end of simulations, the final size should be 32 states, with 11 strong and 21 weak states as well.During this process,the powers will change.We set the power increase by 10 at each tick, because of the natural development of population and economy.As long as a state starts a war, a state's power will decrease whether it is the victory,defeat,or draw.At the same time,the power of states will not increase at every tick when they start a war.So,during the war,the power only decreases but does not increase, and when the power is less than 0, the state will die.According to the growth limit theory, due to environmental and resource constraints in agricultural societies [59], its growth should have a maximum (we set it as 100).
2.4 | Agent attributions
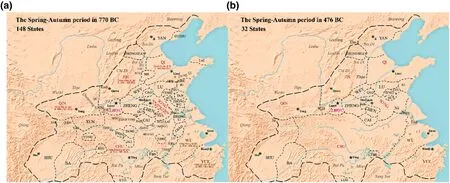
F I G U R E 1 The area and states of the Spring–Autumn period.Figure 1a shows the early Spring–Autumn in 770 before Christ (BC), including the strong states and weak states.And Figure 1b is the map of the end of the Spring–Autumn in 476 BC, which represents the change of states
We set three agent (state) attributions: (a) Bellicosity.All states have certain aggressive propensities, to enlarge military strength and pursue more wealth[60].To resist military attacks from others,states are also forced to enhance military powers.In this history, there are therefore more than 1000 wars [60].We set the bellicosity propensity asbi∈(0,1), and the initial value is 0.2.According to a general hypothesis such as war diffusion [61], all states under war are forced to recalculate their risks,opportunities,and foreign policies.Meanwhile,they have to increase their bellicosity to protect their territories from annexations.At each tick, we set it to increase by a random value, between 0 and 0.2.The Bellicosity represents the power of a state (the propensity of waging wars).The relationship between them is complex.In some cases, the power is increased by a higher propensity of launching wars(win).However,in other cases,the power may be undermined by a higher propensity for wars (lose); (b) The cost of wars.War cost is associated with opponents[62].The cost should be paid by the states involved,regardless of victory or failure.For the same statei,we set the victory cost aswand lose cost asl,respectively; (c) The alliance propensity.Threatened by the same adversary, states will form alliances.For instance, there was little war between Qin and Chu states as they allied to resist the common enemy (Jin state).For each agent, we set the alliance propensity aspi, and the initial value is 0.35; (d)Opportunism.In certain cases,states will change relations to maximise their interest[63].Some may become an opportunist and betray their previous alliances.Here, we use the size of opportunists to reflect portability.In this model,the initial size of opportunists is 148, which means that all states will betray their alliances.We also explore the full range of opportunists,from 0 to 148.
2.5 | Behaviour rules of states
The behaviour of wars is the key to understanding the forming of a unified civilisation [57].History records show that wars during this period were usually launched by states[64].The alliance structure is also dynamic,and the betrayal of the alliance can be seen many times.The bellicosity measures the warfare propensity of the states.Therefore, we used this key parameter.Other factors (such as geographical location)were not particularly important in alliance considerations during this period.For example, Qin began its alliance with the powerful state of Jin, which is close to Qin.During the history of China, states usually attack the neighbours and,meanwhile, ally themselves with faraway states.Therefore, we set four key behavioural rules for the states in history.The core task is to precisely back-calculate this dynamical process(from 770BC to 476 BC).

(b) Launching the wars.Wars are common ways for chaotic states to occupy and expand their controlling territories[7, 68].In the history of China, the frequent and ephemeral wars between different states or groups have bred the culture of efficiency-oriented instrumentalism, which exists all the time in the society of unified China.Therefore,the wars should be modelled as the main mechanism.Specific action rules for launching wars can be shown in Equation (2).First, the agentiwith the power ofPwri,seeks one target (state)jwithPwrj.The precondition of wars launched by agentiis that its power should be larger(Pwri≥Pwrj).When this has been satisfied, the agent (i)then decides whether to attack the target agent (j).The war behaviour is shaped by the bellicosityFi.The binary variable is a resulting function of ultimate choice.When starting the war, the state may evaluate the military power of both sides,the power of allies,and so on.The outcome is either to declare war or not to declare war.Therefore,we set a threshold valueγ∈[0,1]for this.In Equation(2),the war launched byitowardsjis largely determined by the threshold.


(d) Betray the alliances.According to history, there are no solid or permanent alliance relationships.If the power of the ally is too weak, the network will not be reliable or stable anymore.When the power of the alliance declines,opportunist states will choose to betray the alliance and seek more powerful partners, which existed in both histories of China and the West [71].A betrayal also happened during the Vukovar war in 1991 AD [72].For 148 agents, we therefore model the betrayal mechanism.When an allyjis becoming weaker,the agentiwill betray the alliance that combinesiandj.We set the threshold power of the ally as 80 percent (80%) of its own powerPwri.Hence, if the power of the partner (Pwrj) is lower than 80 percent of the self-power (Pwri), the stateiwill quit or betray the existing alliance in Equation (4).

2.6 | Optimal combination of parameter values
By traversing parameter values,we obtained multiple outcomes of simulations.Using theArgMin(Δ) in Equation (6), we search for the optimal combination of parameter values, with the largest accuracy.The core is to explain the historical process in scientific (rigorous) ways, which is different from theoretical discussions (traditional history research).In our model, the existence of even one optimal solution will greatly support our research under the paradigm of ABM.The existence of an optimal solution indicates that history is not irregular but governed by certain action rules.For all states,we model their interactions (alliance, wars, and betrayals) within the system under four behavioural rules {Rule1,Rule2,Rule3,Rule4}.Therefore,the state-level behaviours and annual power(outcomes) can be calculated in simulations.We analyse the duration of states under different value ranges.Initially, we have 138 weak states and 10 strong states;we set the increased bellicositybiin each year as 0.2 for all the 148 states; the cost of wars is from the set {3, 6, 9} under three cases in Equation(6);and other initial values can be found in our model.To explore all possible situations,we traverse the value ranges.The increased war propensity (Bellicosity) takes values from{0.2,0.3,0.4…,1.0}.The cost of winning is from the set{1,2,3, 4, 5, 6, 7, 8}; the failure cost is from {9, 10, 11, 12, 13, 14,15},and the cost of balanced wars is six for all;for the alliance propensity, it is from {0.1, 0.2, 0.3, 0.4, 0.5}.Based on simulations, we should obtain the optimal solution, which matches the dynamic trend of states and durations.Real history forms our target function,freal(⋅)={Yi}, which includes a life-cycle duration of states.We repeat each simulation 200 times to obtain a robust function.In Equation(6),we calculate the difference △between them.In Equation (6), we use four indicators of the durationy1(should be close to 295),the final size of the total statesy2(should be close to 32), the final size of strong statesy3(should be close to 21), and the final size of weak statesy4(should be close to 10)
3 | OPTIMAL SOLUTION OUTCOMES
There are standards that optimal solutions should satisfy.The first is validity,which implies that real history outcomes should be precisely matched.Here, the sizes of both ends and total ticks of simulations should be 295 ticks (years).Furthermore,the span distribution of simulated states should match real history.The second is robustness, and repeated simulations should be stable.For our model, the repeated simulation outcomes of the optimal solution have matched real history,with the highest accuracy.
3.1 | Matched sizes and durations of states
Our optimal solution (N= 200 simulations) has matched real history:(a)The sizes of states.We compare both real history and simulations in terms of the yearly(dynamic)size of states.For real history, the initial size is 148, and the final size is 32.We plot the real history trend in Figure 2a, which has been precisely matched by our optimal solution outcomes.We plot both 200 curves and the average (robust) curve for the yearly size of states.It seems that the average trend is similar to real history.Thus, our optimal solution has precisely matched the real sizes of states in history;and(b)the duration.This stage lasted for 295 years.For our optimal solution, simulated durations should be 295 as well.To avoid heterogeneity,complexity,and randomness for single simulations,we explore the distribution and mean values.In Figure 2b,we present the distribution of simulated durations (N= 200).Probability Density Function(PDF)is used here to compare distributions.For Q-Q normal plot at the subfigure, the normality can be well supported (most data points stand right at the straight line).Although the duration ranges from 240 to 360 ticks, the mean is 295.04 ticks, which matches the real history of 295 years.The normal distributions can be verified, which supports both the validity and robustness of our research.
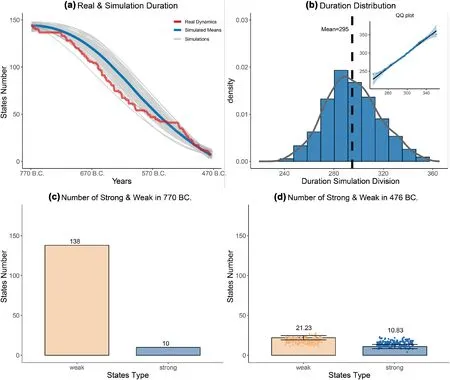
F I G U R E 2 The validity and robustness of the optimal solution (N = 200).We compare optimal simulations with real history.Panel A shows two similar trends.The X-axis refers to the time (year), and Y-axis shows the dynamic size of states.Panel B shows the distribution (PDF) of simulated durations, with a mean of 295.04(SD = 21.56).Panel C shows simulated sizes of weak(N = 138)and strong states (N= 10).Panel D shows the final simulated sizes of weak,which is 21.23 (SD = 2.67), and strong states, which is 10.83 (SD = 2.63)
3.2 | Matched annexation process
The declined size of existing states is caused by wars and annexations in history.Besides checking end-to-end matches,we further check fitted dynamic processes.The initial and final sizes of strong and weak states can be matched in Figure 2c;there were 10 strong states (Jin, Chu, Qi, Qin, Lu, Song,Zheng, Wei, Wu and Yue) [56] and 138 weak states.In Figure 3c,we have matched this,as we set initial conditions as 10 strong and 138 weak states in 770 BC.As time goes by,the size of states will decline because of wars and annexations.At the end of this period,the total size declined to 32 in Figure 2d.Among them, there are still 11 strong states (Qin, Zhao, Jin,Yue, Qi, Yan, Ba, Shu, Lu, Song and Zheng), which dominate the other 21 weak ones.We have matched this history in 476 BC in Figure 3d, because we also have precisely simulated 11 strong states and 22 weak states, at the end.

F I G U R E 3 Back-calculations of this process.Panels A1,B1,C1,and D1 refer to dynamic distributions of bellicosity for states.Panels A2,B2,C2,and D2 show the dynamics of alliance networks.Similarly,Panels A3,B3,C3,and D3 represent the sizes of allied and non-allied states over time.Panels of A4,B4,C4,and D4 illustrate the dynamic size of loyal and betrayal states over time.Panel E depicts the size dynamics for strong and weak states
3.3 | Restored trend of annexations
We also back-calculate real history and illustrate this dynamic process:
(a) Dynamics of bellicosity.As the initial power is between 0 and 100, we set the initial bellicosity asFi=Pwrti/100.Hence,all the bellicosity is within 0 and 1.The dynamical trend of the bellicosity within 295 years is in Figure 3a1-d1.The bellicosity represents the probability of waging wars.When it is close to 1,the state is certainly to wage wars.At the beginning of Figure 3a1, the initial bellicosity is set to follow a normal distribution(mean=0.2).Most values of 148 states are within 0.2 and 0.4,as the initial willingness to wage wars is much lower.Then,we see some polarisation in Figure 3b1.The bellicosity for some remains lower than 1.0,while for others,it is higher than 1.0.Furthermore,we have fewer and fewer low-bellicosity states,such as in the year of 570 BC in Figure 3c1,because peace was impossible for this multi-state system.Finally,at the end year of 476 BC,there are merely high-bellicosity states that exist,and all of them tend to wage wars and expand their territories.
(b) The propensity of alliances.In the beginning, states form alliances with credible partners.However, the alliance becomes less and less credible [73].In our model,states may form or betray alliances, which also coincides with real history.Therefore, the alliance network is dynamic.We visualise the alliance network in four typical years such as 770 BC (start), 670 BC, 570 BC and 476 BC [74].Then, we visualise this dynamic process in Figure 3a2-d2 and calculate the size of states involved in alliances in Figure 3a3-d3.In the first year of 770 BC,the size of alliance groups is zero in Figure 3a2, as the initial state with 148 states in Figure 3a3.Then, as this process (wars and annexations) goes on, more states will form alliances to defend themselves and attack enemies collectively.For instance, in 670 BC, we have 34 alliance links between two agents (states) in Figure 3b2, and we have 127 states left, after wars during 770 BC and 670 BC.For the state with and without an alliance, the mean is 68.26 (SD = 14.43) and 58.79 (SD = 10.37).As the size of states decreased, there were fewer and fewer chances for them to be allied.In the end, several independent states survived successfully.Furthermore (in 570 BC), we have 11 links in Figure 3c2 and 71 states left in Figure 3c3, after wars between 670 BC and 570 BC.For the state with and without an alliance, mean values are 21.53 (SD = 8.66) and 50.05 (SD = 7.41).Finally (in 476 BC), we have 32 left in Figure 4d3, and merely two alliance links in Figure 3d2.For with and without, mean values are 8.57 (SD = 3.99) and 23.84(SD = 4.26).
(c) The dynamics of loyal and betrayal states.For the states,the alliance will be terminated if aggregated power is too weak, and they will betray the current alliance and choose another,which is stronger.We define the threshold for betrayal as 80%of one's power in Equation(4).States that betray the alliance are called betrayers and those that do not betray are loyalists.Hence,we portray the dynamics of betrayal and loyal states in Figure 3a4-d4.For the initial year of 770 BC, all states are loyal in Figure 3a4.Then, as the process of wars and annexations goes on, we have more and more loyal states, because they change ally networks to defend themselves.For instance, in Figure 3b4, the average sizes of betrayers and loyalists, in 670 BC,are 74.71(SD=11.25)and 52.36(SD=7.52).As time goes on, the existing size of survivors will decline,and more states will be betrayers, to enhance individual safety levels.For instance, the average size of betrayers is 66.22 (SD = 7.88), but for loyalists, the size is 5.25(SD=4.04),and the betray percentage is 93%.Finally,we have nearly 31.79 betrayers(SD=1.59)in Figure 3d4,and the percentage is 100% as well.
(d) The polarisation dynamics of strong states.For the unification process,there will be fewer and fewer states left.Eventually,strong states will dominate the system.Thus,the dynamics of strong states largely shape the dynamics of civilisation unification.Figure 3e shows the whole process of weak and strong states.For this period,our optimal solution can reveal(back-calculate)the whole process:(1)The starting stage(770 BC to 750 BC).According to history,the initial percentage of strong states is 7.76%, and most states were weak.Then,they were developing,in terms of population,social wealth,and military power.The aims of earlier wars were not killing others but punishing.From 770 BC to 750 BC,the size of strong states grows while that of weak states declines, because of self-development.In 760 BC,the size of strong states begins to exceed weak ones,and the critical value is around 70.Then,we have the maximal size(n=124),with the peak percentage(88%)in 750 BC.As the size of strong states grows,the potential of wars grows as well;(2)The polarising stage (750 BC to 596 BC).Resources and wealth are needed,especially for strong states.In the system,the total volume of resources was limited,and strong ones have to launch wars to seize more resources.Hence, as we have more and more strong ones, wars will inevitably take place,which reduces the size of strong states.Meanwhile,the size of weak states increases slightly in this stage, from 750 BC to 596BC.The size of strong states equals weak ones again in 596 BC, and the percentage is 50%.For weaker states, they join the alliance networks to defend themselves and avoid early deaths.As strong ones die,some space will be released to weaker ones,during 750 BC and 596 BC;and(3)The polarised stage(596 BC to 476 BC).The system becomes deeply polarised, and we have fewer and fewer states.At this stage, wars become fiercer.The main aim of wars changed from punishing to killing.Hence,there is less and less space for weak states to exist,and their size declines between 596 BC and 476 BC.The dominating time for strong states arrives.In this stage,wars launched by strong states are not merely towards weak ones,but themselves as well.Thus,the size of strong ones also declines from 596 BC to 476 BC.For the whole process(770 BC to 476 BC),the most weak and strong states have been eliminated,and the total size has declined to 32.Finally,we have 21 weak and 11 strong states.Therefore, this Spring–Autumn period has formed a polarised pattern,which is critical for unified civilisation in China.
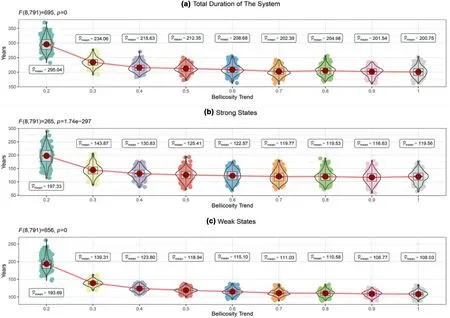
F I G U R E 4 The effect of bellicosity on survival duration.Panels A,B and C indicate the duration of the whole period,the duration of strong agents,and the duration of weak agents, respectively, in simulation.The x-axis refers to different bellicosity and the y-axis is different duration.And, the ︿μmean indicates the average outcome of 200 simulations
4 | COUNTERFACTUAL EXPERIMENTS
Agent-based models can explore the full-range effects of related factors.It supports counterfactual inferences (accurately controlled experiments), which were impossible for real history [70].For each combination of parameters, we repeat it 200 times to obtain robust outcomes and evaluate the effects of three factors.
4.1 | The effect of bellicosity
We explore the effect of the time consuming for both states and the whole multi-agent system in Figure 4.It indicates that:(a)The growing bellicosity dramatically reduces the duration and accelerates the civilisation unification process.For the system,the duration of this process is deemed as the time used from 148 to 32 states.For each simulation,we calculate the time(years) used.For the general trend in Figure 4, increasing bellicosity will shorten the duration of the unification process.As the bellicosity is 0.2,the duration is 295.04 years.When it is 0.3, the duration declines from 295.04 to 234.06.When the bellicosity is 0.4, it decreases further from 234.06 to 215.63 years.We use the Analysis of variance(ANOVA)test to compare differences,and,for the system,the difference is significant(p<0.05).As it is larger than 0.4,the duration remains stable,and it slowly declines from 212.35 to 200.75 years,as the bellicosity grows from 0.5 to 1; and (b) The patterns are similar for both strong and weak states.For strong states,when the bellicosity is 0.2, the duration is 197.33 years, which declines to 143.87 years as it is 0.3.Furthermore,it declines to 130.83 years,as it is 0.4.After that(beyond 0.5),the duration for strong states will be stabilised at around 120 years in Figure 4B.For the ANOVA test, the probability is close to zero, which means a significant difference.The same pattern exists for weak states in Figure 4c.The duration is 193.69 as it is 0.2 and 139.31 as it is 0.3.The duration declines further to be 123.80 as the bellicosity is 0.4.Beyond 0.5, the duration will be stabilised at around 110 years.For the ANOVA test, the difference is also significant.Thus,similar trends can be seen in all states.
4.2 | The effects of alliance propensity
The alliance probability shapes war behaviours,which therefore influences the balance of powers.In some cases,weak states can ally to counter strong powers.As 50%is enough to connect all states, we examine the value from 0 to 0.5.It indicates that a higher alliance probability will reduce the bellicosity of states.If the alliance propensity is beyond 0.5, most wars will be prevented.Therefore,the alliance propensity is closely related to the duration of all states.Figure 6 visualises the effect of alliance propensity on the duration of states,and linear regression is used to measure this.It seems that an increased probability will prolong the duration of all states,and the non-linear effects can be seen in Figure 5a.As the alliance probability grows from 0 to 0.5,the duration first grows slowly and then increases sharply.The shifting point is around 0.25,which separates the two stages.As the alliance propensity is within 0 and 0.25,the average duration grows slowly from 217 to 236 years.As this propensity is within 0.25 and 0.5, the average duration grows sharply, from 236 to 568 years.We also compare two patterns of both strong and weak states.For strong states in Figure 5b,as it increases from 0 to 0.25, the average duration grows slowly from 130 to 151 years.Then,the average duration grows sharply from 151 to 423 years, as it increases from 0.25 to 0.5.For weak states in Figure 5c, the average duration grows slowly from 128 to 145 years, as it increases from 0 to 0.25.The duration grows sharply from 145 to 42 years.When it reaches 0.5,the average duration is beyond 800 years,which means that there will be few wars and annexations between states.
4.3 | The cost effects of military victory and defeat
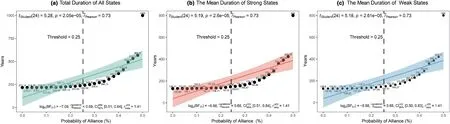
F I G U R E 5 The effects of the alliance probability.Panels A,B and C indicate the average duration of all agents,strong agents,and weak agents,respectively.For each panel, the x-axis represents the probability of alliance while the y-axis refers to the survival time

F I G U R E 6 Joint effects of the war cost(victory and defeat).We plot the combined effect of military victory cost(horizontal)and defeat cost(vertical).The increases in both defeat and victory costs will always reduce the durations of strong,weak,and all agents.However,the duration of strong agents has always been higher than that of the weak agents
The future of states largely depends on military outcomes,which reshapes the power distribution [75].We explore how war cost influences the duration in Figure 6.Under different war costs, the duration patterns take on similarities and differences: (a) The cost effect is negative for all states.The duration will be reduced,as either the defeat cost(w)or failure cost (l) grows.In Figure 6a, the duration of all states declines from 434.89 to 210.24 years,as victory cost(w)increases from 1 to 8.Meanwhile, the duration decreases from 434.89 to 227.66 years, as defeat cost (l) grows from 9 to 15.Similarly,the duration of strong ones in Figure 6b and weak ones in Figure 6c has also decreased, as the victory (w) and defeat (l)costs grow;(b) There are local differences.Generally speaking,negative effects of war costs can be seen in all states,including weak and strong states.Hence, war is bad for all states.Also, we have some local differences.For total states,the marginal effect of victory cost(w)is not obvious asw>6,and the marginal effect of defeat cost (l) is substantial for the whole range of[9,15].For strong states,the marginal effect of victory cost(w)will be little asw>7,and the marginal effect of defeat cost (l) will be substantial for the whole range.For weak states,the marginal effect of the victory cost(w)becomes weaker asw> 6, and the marginal effect of defeat cost is substantial within the whole range.
5 | CONCLUSIONS AND DISCUSSIONS
We deem the Eastern Zhou dynasty (China) as a complex system, with multiple intelligent elements (autonomous states)and emergent behaviours(wars and alliances).For the Spring–Autumn period,we initially have 148 states in 770 BC,and the outcome is the unification pattern, with 32 states left in 476 BC.From the perspective of global history, although Eastern and Western civilisations originally may have some similarities,the social evolution process has divided them up.After this critical stage,the unification process has dominated the history of China, which forms the unification tradition of Chinese society and eastern Asian culture.Here,we use ABM to model multiple agents(autonomous states),which behave and interact under several behavioural rules.Eventually, we obtain the optimal solution that has precisely matched the real history of this period, which provides new insights into historical dynamics.Both validity and robustness of the optimal solution can be supported and verified.The mean of simulation ticks is 295.04 years(N=200),which is the same as that in real history(295 years).The previous research[76,77]and the existence of an optimal solution indicate that human history can be modelled and calculated and therefore illustrate the key mechanisms for the formation of civilisations.Given the precise matching degrees of our optimal solution, we can backcalculate the history of this Spring–Autumn period.Besides,we can explore and visualise the dynamic process of strong and weak states, the bellicosity, alliance network, and loyalists and betrayers in history.In this work,our optimal solution obtained has decoded the underlying mechanism of history dynamics,which helps to understand the forming mechanism of a unification civilisation in China.
Besides back-calculations, we can obtain and evaluate parallelled outcomes and infer all possibilities of human history.Based on these counterfactual inferences,we can estimate the mechanism of civilisation unification.First, the bellicosity reduces the survival durations of both weak and strong states.Under the same bellicosity levels, strong states have longer durations than weak ones, especially when the bellicosity is higher.Second, the alliance probability enhances survival durations for both weak and strong states.When it is higher than 0.4, we have 80% of all states connected (allied), and the survival duration of states will increase dramatically.Third,the average survival duration seems to be negatively related to the cost of wars.As the cost of military victory (w) grows from one to 8, or the cost of defeat (l) grows from 9 to 15, the survival duration of all states will decline.However, whenw> 6 andl> 13, the declining trend slows down and seems less obvious.The duration declines as the size of opportunists grow,from 0 to 148 states.Last,we obtain the survival rates of both loyal and opportunistic states.As we have more and more opportunists in the system,the survival chance of opportunists increases, but it decreases for the loyalists.In addition, our work also has potential significance for the evolution of the world system.Given certain behavioural rules, we can model the evolutionary dynamics of all countries worldwide.Especially, we can model the life cycles of current global superpowers (USA, EU and China), as well as the dynamic interactions between them in the world.
ACKNOWLEDGEMENTS
This work is supported by the National Social Science Foundation of China (Grant No.17ZDA117).
CONFLICT OF INTEREST
The author declares they have no conflict of interest.
DATA AVAILABILITY STATEMENT
The data that support the findings of this study are available from the corresponding author upon reasonable request.
ORCID
Peng Luhttps://orcid.org/0000-0003-1195-1816
Mengdi Lihttps://orcid.org/0000-0002-7288-9182
Zhuo Zhanghttps://orcid.org/0000-0001-7044-3446
杂志排行

CAAI Transactions on Intelligence Technology的其它文章
- Fault diagnosis of rolling bearings with noise signal based on modified kernel principal component analysis and DC-ResNet
- Short‐time wind speed prediction based on Legendre multi‐wavelet neural network
- Iteration dependent interval based open‐closed‐loop iterative learning control for time varying systems with vector relative degree
- Thermoelectric energy harvesting for internet of things devices using machine learning: A review
- An embedded vertical‐federated feature selection algorithm based on particle swarm optimisation
- An activated variable parameter gradient-based neural network for time-variant constrained quadratic programming and its applications