Multisource localization based on angle distribution of time–frequency points using an FOA microphone
2023-12-01LiangTaoMaoshenJiaLuLiJingWangYangXiang
Liang Tao| Maoshen Jia| Lu Li | Jing Wang| Yang Xiang
1Faculty of Information Technology,Beijing University of Technology,Beijing,China
2Department of Electronic Engineering,Beijing Institute of Technology,Beijing,China
3CREATE,Aalborg University,Aalborg, Denmark
Abstract Multisource localization occupies an important position in the field of acoustic signal processing and is widely applied in scenarios,suchas human-machine interaction and spatial acoustic parameter acquisition.The direction-of-arrival (DOA) of a sound source is convenient to render spatial sound in the audio metaverse.A multisource localization method in a reverberation environment is proposed based on the angle distribution of time–frequency(TF)points using a first-order ambisonics(FOA)microphone.The method is implemented in three steps.1)By exploring the angle distribution of TF points,a singlesource zone (SSZ) detection method is proposed by using a standard deviation-based measure, which reveals the degree of convergence of TF point angles in a zone.2) To reduce the effect of outliers on localization, an outlier removal method is designed to remove the TF points whose angles are far from the real DOAs,where the median angle of each detected zone is adopted to construct the outlier set.3)DOA estimates of multiple sources are obtained by postprocessing of the angle histogram.Experimental results in both the simulated and real scenarios verify the effectiveness of the proposed method in a reverberation environment, which also show that the proposed method outperforms reference methods.
K E Y W O R D S signal processing, speech processing
1 | INTRODUCTION
Multisource localization as a hot topic in the acoustic signal processing field has always been explored,which mainly utilises the spatial relationship between a microphone array and sound sources to obtain the direction-of-arrival (DOA) of sound sources[1].DOA estimation of multiple sources demonstrates in its practical value in applications, such as camera steering,robot navigation, major noise source localization, and speech enhancement [2–4].In addition, DOA information is convenient in the accurate rendering of the spatial effects of the sound sources and is important for audio reproduction in the audio metaverse[5,6].However,various disturbances in real scenarios bring challenges to DOA estimation.[7].As recording conditions become more complex (e.g., higher reverberation times,more sound sources,and smaller angle separation),there is a large research space for multisource localization to obtain precise DOA estimates.
Early methods estimated the time difference of arrival(TDOA) [8, 9], which is calculated by generalised crosscorrelation (GCC).The core idea of TDOA-based method is computing the relative time delay between different microphones to determine the DOA estimate of the source.To be more specific, by comparing the absolute time difference between the source and each microphone,several hyperbolas with the microphones as the focus and the distance difference as the major axis are made,and their intersection point is the position of the source.TDOA-based methods can demonstrate excellent localization performance for single-source localization,but their performance is inferior in the case of multiple sources[10,11].Aiming at this issue, some extensions of the TDOA-based method make multisource localization possible, for example,the GCC method with phase transform[12].Nevertheless,the accuracy of TDOA estimation decreases with the increase of reverberation time, which cannot support TDOA-based method that achieves a brilliant localization performance under high reverberation[1].
In the research process of DOA estimation, the method based on multiple signal classification (MUSIC) [13] has attracted much attention as a multisource localization method.It constructs a spatial spectrum function based on the orthogonality of the signal and noise subspace, and spectral peak search is used to acquire the DOA estimates of sources[14].However, the localization performance of the MUSIC method can be affected by high reverberation times and/or high noise levels.Further, to improve the robustness of the MUSIC method under reverberation condition, an extended method is proposed under the assumption that the room coupling coefficients are known in advance [15].
Beamforming-based method is another type of DOA method, and the well-known steered response power (SRP)method is one of them [16].The SRP-based method needs to search for the maximum output power of a beamformer,and the direction of the corresponding power is identified as the estimated DOA[17].However,the SRP-based method neglects the characteristics of the noise field,which leads to its performance and is not the most superior.Therefore,a method based on the minimum variance distortionless response(MVDR)by considering noise statistics when constructing the cost function is proposed[18]based on the premise that the noise statistics are accurate enough.
The sparsity of speech has been introduced in multisource localization.These sparse component analysis (SCA)-based methods use approximate W-disjoint orthogonality(WDO)[19]of speech in mixtures to transform multisource localization to single-source localization[20].The approximate WDO reveals the sparsity of speech in the recorded signal of multiple sources scenario, that is, the time–frequency (TF) components of different source are disjoint in the TF domain[21,22],that is,the spectra of different speech source are hardly non-overlapped[23, 24].Following the WDO, we know that there are many TF points where only one source is dominant,and these points are called single-source points (SSPs) [25].In an SSP, the dominant source is much more energetic than other sources or interference components,and its DOA information is close to that of the real source.Considering that SSPs are significant to DOA estimation,several multisource localization methods have been proposed based on SSP detection.For a spherical array,an unsupervised multisource localization method was proposed using relative harmonic coefficients,which can detect SSPs from recorded signals [26].In addition, an SSP detection method is designed based on the direct-path dominance test [27].Following a single-source validity confidence metric, an SSPbased DOA estimation method was designed by applying Kmeans clustering and density-based spatial clustering of applications with noise[28].However,while these methods can obtain high accuracy of DOA estimates, they rely on a large number of microphones.
Among microphone arrays with simple structures,the firstorder ambisonics(FOA)microphone[29]has been widely used because it can well preserve the spatial relationship between the sound source and microphone.Therefore, a low reverberation single-source(LRSS)point detection method[30]was proposed using an FOA microphone.For a TF point,if the TF coefficients of four channel signals have the same ratio of real and imaginary parts (i.e., all channels with equal phases), it is detected as an LRSS point.The LRSS-based method can achieve a good localization performance.Some SSPs cannot be identified because this method neglects the distribution of SSPs; hence, several extended SSP-detected methods were proposed using the continuity between adjacent TF points to solve the source loss problem during DOA estimation[31,32].Nevertheless, these methods are suboptimal with the increase of reverberation time because many SSPs cannot be detected.In order to obtain more SSPs under medium and high reverberation, there are some studies for single sound source component detection at the zone level [33].A TF zone where most TF points come from the same source is defined as a single-source zone (SSZ).The primary task of SSZ-based DOA estimation is SSZ detection, and the DOA estimates of sources are acquired using the information in the detected TF zones.SSZ detection methods based on TF ratios of mixed signals [34] and local confidence measures of attenuated and time-delay mixtures [35, 36] have been proposed recently.Furthermore,SSZ detection methods have also been proposed based on TF correlation using centred or non-centred TF transforms[37]and adopted for blind source separation(BSS).Considering that the correlation-based SSZ detection method has superior detection performance [33], it is applied in DOA estimation, and a series of correlation-based SSZ detection methods have been applied effectively in different arrays, for example, circular microphone [33], linear [38], and FOA microphone arrays [39–41].There are many TF points whose angle information is far away from the real DOAs in the detected SSZs; these TF points are defined as outliers.The existence of a large number of outliers will degrade the performance of DOA estimation.Aiming at this issue,a point and source offset residual weight method was proposed to mitigate the effect of outliers on localization performance [42].
Although the correlation-based SSZ detection method can achieve effective multisource localization, it is a challenge to obtain precise DOA estimates under medium and high reverberation because, with the increase of reverberation time, the energy of the reflection component in the recorded signal increases.When the energy of the reflection component is close to that of the source component, its influence on the correlation of each channel increases,the number of SSZs detected by the correlation-based method decreases and the false detection rate increases.
After analysis of the angle distribution of TF points in SSZ,it may occur that a TF zone where angles of most TF points are gathered around a certain angle may be an SSZ with high probability.Hence, we propose an SSZ detection method and an outlier removal method for DOA estimation in a reverberation environment based on the angle distribution of TF points.A measure based on the standard deviation is proposed for SSZ detection, which reveals the degree of angle convergence of TF points in a zone.To reduce the effect of outliers on localization, an outlier removal method is designed, using the median angle of a detected zone to remove TF points whose angles are far from the real DOAs.The DOA estimates of multiple sources are then obtained by postprocessing.The proposed method is similar to the correlation-based SSZ detection to estimate the DOAs of multiple sources from the level of zone detection.However,this paper proposed an SSZ detection method based on the angle distribution of TF points.Several experiment results showed that the proposed localization method performs excellently both in simulated and real scenarios.
The remainder of this paper is organised as follows.Section 2 explores the angle distribution of TF points,proposes an angle convergence measure of the TF zone,and experimentally validates it.Section 3 introduces the proposed DOA estimation method.In Section 4,experimental results under simulated and real scenarios are presented to evaluate the performance of the method.Some conclusions are drawn in Section 5.
2 | EXPLORING THE ANGLE DISTRIBUTION OF TF POINTS
2.1 | Received signal model
Assume there areIsources in a reverberation environment.The model of the received signal of thelth channel is expressed as
wheresi(t) is theith source;hi,l(t) is the impulse response between theith source signal and thelth channel of the microphone array;n(t)is the noise and reflection component;∗represents the convolution operation; andtandlrepresent the time and channel indices,respectively,wherel=0,1,…,LandLis the number of channels in the array.
Considering the sparsity of speech signals in the TF domain, the short-time Fourier transform (STFT) is adopted to transform the speech signal from the time domain to the TF domain.The signal of thelth channel in the TF domain is[43].
whereSi(n,k) andHi,l(n,k) are TF coefficients of theith source and the impulse response, respectively;N(n,k) is the noise and reflection component;nandkare frame and frequency indices,respectively;andN0is the ratio of the impulse response length to the frame length.
To simplify this recoded signal model, the influence of modelling error and noise is ignored, and the model can be approximated as
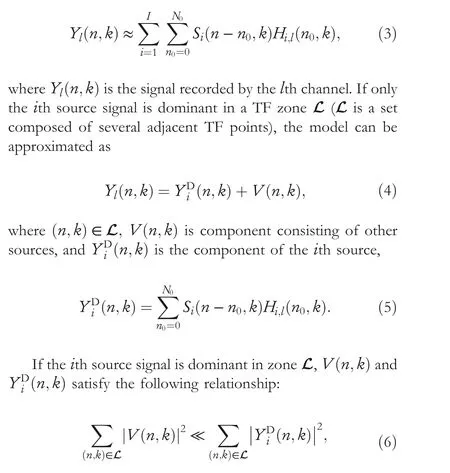
that is, the energy of theith source is far larger than that of other sources.
2.2 | Deficiency of correlation‐based SSZ detection method
Because the recorded signals of a microphone array demonstrate strong correlation in some TF zones where only one source dominates, the existing method mainly detects SSZs through the correlation of the recorded signals on the different channels of microphone array [33].However, the proportion of reflection components coming from single-source or multisources in each TF point increases with the reverberation time.Under medium and high reverberation,the interference of the reflection component reduces the correlation between channels in TF zones dominated by a single source,and these zones are identified as non-SSZs.In addition,when the proportion of the reflection component is greater than that of the direct component of the source,a TF zone with a strong correlation of reflection components will be mistakenly identified as an SSZ.In summary, the correlation-based detection method is suboptimal because of the low accuracy of the detected SSZs under medium and high reverberation.
2.3 | Definition and analysis of single‐source zone
Based on the sparsity of speech signals in the TF domain,it can be found that there are many TF zones where only one source is dominant when multiple sources are active simultaneously;these TF zones are defined as SSZs.Following this definition,the characteristics of SSZ are analysed from two aspects:sound source energy and the angle of the TF point in the recorded signal.
First, from the perspective of sound source energy, when only one source is dominant in an SSZ, whose energy is far greater than that of other sources.We assumeIsources andMTF zones,where each zone consists of the same number of adjacent TF points.The energy of theith source in themth zone (i.e., Lm) is defined as
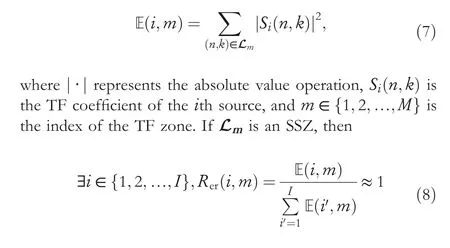
whereRer(i,m) is the ratio of the energy ofith source signalSi(n,k) to that of all sources in themth zone.
Second, the angles of most TF points are close to the real angle of the source in SSZs.In this paper, the angle of TF point is defined, which refers to the DOA of the TF point component in the recorded signal.When only a single source is active at TF point(n,k),the angle of(n,k)is the DOA of the source.However, when the recorded signal at TF point (n,k)is composed of multiple sources and/or reflection components, these components synthesise a virtual source, and the angle of(n,k)is the DOA of the virtual source.The angles of TF points can be calculated from the recorded signal of some microphone arrays, such as FOA and high-order ambisonics microphone array.The angle of TF point (n,k) is denoted asφ(n,k), and the detailed calculation ofφ(n,k) is shown in Section 3.2.A set of TF points in themth zone whose angles are close to theith real source angle is constructed as
whereRar(i,m)is the ratio of the number of TF points whose angles are close to theith real source angle to the length of themth zone.card(·) represents the calculation of the number of elements in a set, and K is the length of a TF zone.
2.4 | Proposed angle convergence measure of time‐frequency zone
Based on the analysis of SSZs, we assume that in the signal recorded by the microphone,if the angles of most TF points in a zone are gathered around a certain angle,this zone is an SSZ with high probability.According to statistical theory, it is feasible to use standard deviation to describe the convergence degree of data.The more convergent the data,the smaller the standard deviation.Therefore, a measure based on standard deviation is proposed to reveal the degree of angle convergence of TF points in a zone.A vector consisting of angles of TF points in Lmis defined as

The measureσLmapproaches 0, which means that most angles are concentrated onφLm, that is, the convergence characteristic of the angles of TF points in Lmis obvious.Conversely,the largerσLmis,the more dispersed are the angles of TF points in Lm.
To verify our assumption, we designed a series of experiments with different source angle separations and reverberation times in two-source and three-source simulation scenarios.The recording environment was simulated by Roomsim [44],
where an FOA microphone was chosen because it has a simple structure and reflects the spatial information of the sources.The microphone was placed in the centre of a room that was 6 m long, 4 m wide and 3 m high.Considering that the elevation and azimuth have the same calculation process, for convenience of calculation, the elevation was not considered and was set to 0°,that is,the sources and the microphone were set to the same height,and the sources were set 1 m from the microphone.The source signal is an 8-s segment of a speech signal from the Nippon Telegraph and Telephone (NTT)Corporation database [45], which samples at 16 kHz.The length of each TF zone was set to 50, that is, K=50.
In the experiment,a zone was labelled as an SSZ of theith source only if the following two conditions were satisfied simultaneously: 1) the energy of theith source signal was far greater than that of other sources,and 2)the angles of most TF points were close to the real angles of theith source (angle calculation is described in Section 3.2).To be specific,based on(8)and(10),the index set of the SSZ in theith source is defined
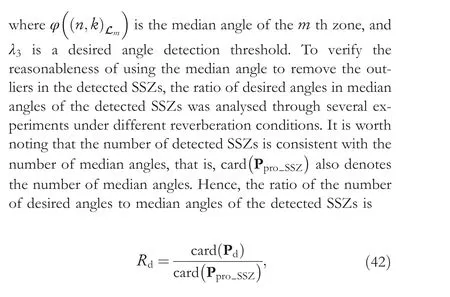
whereε2is an energy discrimination threshold whose value tends to 0+.A smallerε2means that more energy is concentrated on a certain source.ε3is an angle discrimination threshold whose value tends to 0+.A smallerε3means that there are more TF points whose angles are close to the real angle of theith source in Lm.Thus, an index set of the SSZs of all sources is obtained as
If the angle convergence measure of zone Lmis smaller than a threshold, this zone is detected as a zone where the angles of TF points are convergent.The index set of these detected zones is
whereε4is a convergence discrimination threshold.The smallerε4is,the more convergent are the angle of TF points in the zone.
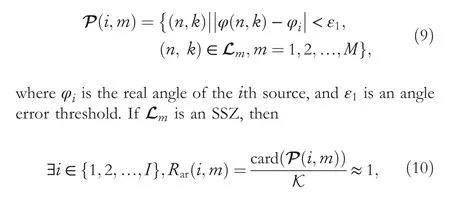
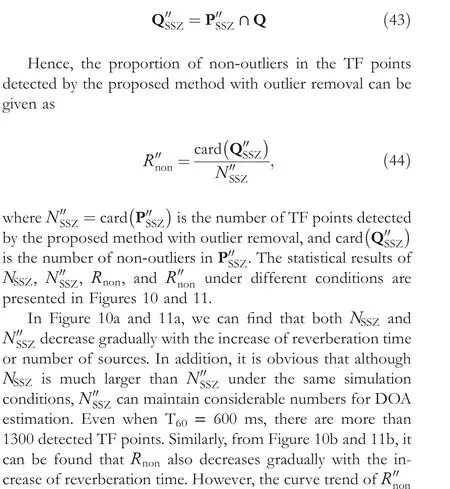
To demonstrate our assumption,we take a recorded signal with three sources(azimuth angles of 70°,160°,and 250°)and a reverberation time of 600 ms as an example.The angle distribution histograms of TF points belonging to the zones whose indices are in set J are shown in Figure 1, where Figure 1a–c correspond to TF zones from sources located at 70°, 160°, and 250°, respectively, and Figure 1d shows the histogram of the angles of TF points in 1 TF zone whose index does not belong to set J.
where J and Z are the index set of detected zones and SSZs,respectively.And J ∩Z is the index set of SSZs in the detected zones.The ratio of the number of SSZs to that of the detected TF zones is
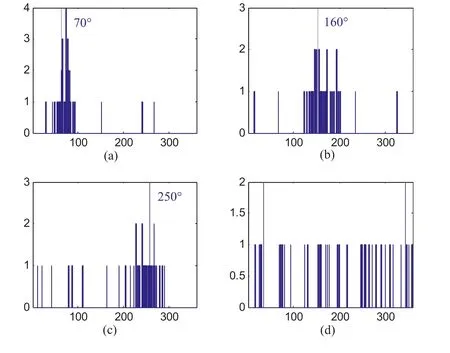
F I G U R E 1 Histograms of angles of time-frequency (TF) points in partial zones for the three-source scenario with an angle separation of 90° and T60 = 600 ms
We compared theNrandRrdin several conditions where the source separations were 60°, 90°, and 120° with both two and three sources.The reverberation times were set to 0 ms,150 ms,300 ms,450 ms,and 600 ms.The average numbers of detected TF zones in two-source and three-source scenarios with different angle separations and reverberation times are shown in Figure 2.
It can be found from Figure 2 that the number of TF zones detected by the proposed measure decreases with the increase of reverberation time.However, the number of detected TF zones is still considerable at T60= 600 ms.In addition, the more sources, the fewer detected zones at the same angle separation, mainly because the interference between sources becomes stronger with the number of sources.The average ratios of the number of SSZs to that of detected TF zones in the two-source and three-source scenarios with different angle separations and reverberation times are shown in Figures 3 and 4, respectively.
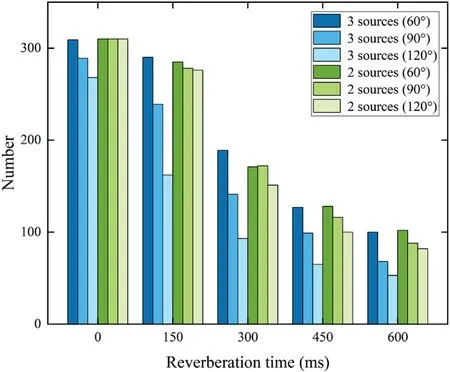
F I G U R E 2 Average number of detected TF zones in the two-source and three-source scenarios with different reverberation times
As shown in Figures 3 and 4, the larger the angle separation,the larger the proportion of SSZs in the detected zones at the same reverberation time.ComparingRrdin the two-source scenarios,there is a slight difference in the ratio of SSZs in the detected zones with different angle separations and the same reverberation time.However, the difference will be larger in the three-source scenario.We can also find when the number of sources is the same,with the increase of reverberation time,the ratio of SSZs in the detected zones gradually decreases.This is because the increase of reverberation time and/or decrease of source separations may lead to the increase of interference components, which affectsRrd.To be more specific, under various conditions, the ratio of SSZs in the detected zones is still considerable, achieving approximately 90%at T60=0 ms.Even in the three-source scenario with 60°separation and T60= 600 ms, the proportion can reach more than 40%.Furthermore, the proportion of SSZs can surpass 50% in most cases.To sum up, the proposed assumption can be verified,that is,a TF zone with TF point angle convergence may be an SSZ with a large probability.At the same time, the proposed measure can achieve superior detection performance for SSZs.

F I G U R E 3 Average results of Rrd in the two-source scenario with different angle separations and reverberation times
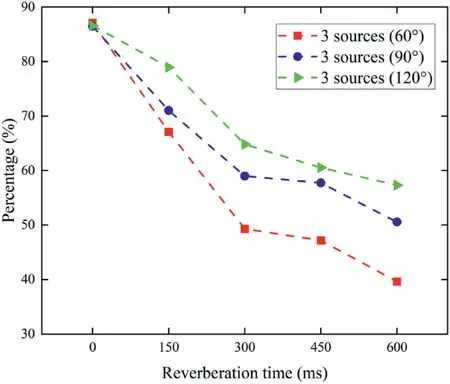
F I G U R E 4 Average results of Rrd in the three-source scenario with different angle separations and reverberation times
3 | PROPOSED DIRECTION‐OF‐ARRIVAL ESTIMATION METHOD
Based on above, a multisource localization method in a reverberation environment is proposed,which has three steps:1) SSZ detection based on an angle convergence measure; 2)outlier removal based on the angle distribution of TF points in the detected SSZs; and 3) DOA estimation based on kernel density estimation (KDE) and peak search.The flowchart of the proposed method is shown in Figure 5.
3.1 | A/B format signal
An FOA microphone is chosen because it can reflect the spatial information of the source signal and has a simple structure.The FOA microphone is a tetrahedral array with four identical cardioid microphones, which are located on the four nonadjacent vertices of the cube.The signal recorded directly by the FOA microphone is called an A-format signal, which at TF point (n,k) can be expressed asYflu(n,k),Yfrd(n,k),Ybld(n,k),Ybru(n,k),corresponding to the four channels of an FOA microphone.To obtain the spatial information of TF point(n,k), it is necessary to transform an A-format signal to a Bformat signal[29],
whereYflu(n,k),Yfrd(n,k),Ybld(n,k),Ybru(n,k) are the recorded signals of front left up, front right down, back left down, and back right up, respectively.YW(n,k) is omnidirectional andYX(n,k),YY(n,k) andYZ(n,k) are Cartesian bidirectional signals.The spatial relationship between a sourceSand B-format signal at TF point (n,k) is
whereS(n,k) is the TF coefficient of sourceS,φ∈[0°, 360°]andη∈[-90°,90°]are the azimuth and elevation,respectively,of the source to the centre of the FOA microphone.It is worth noting that under a single-source scenario without reverberation,Sis a true source;nevertheless,when multiple sources are active simultaneously and/or T60≠0 ms,Smay be a virtual source, consisting of multiple sources and/or reflection components.
3.2 | Calculation of time‐frequency point angle
According to (21), the spatial orientation information of TF point (n,k) (i.e., an angle of a TF point) can be deduced through the relationship between different channels of a Bformat signal.Specifically, it is necessary to calculate the active intensity of a B-format signal that can reflect the flux of energy in the sound field.The active intensity at TF point(n,k) is defined as
where R{·} and (·)∗represent the real-part operation and conjugation, respectively, and the azimuth of TF point can be calculated as

F I G U R E 5 Block diagram of the proposed method
Since the calculation of elevation is not considered in this paper,wemakenodistinctionbetweentheazimuthandangleofa TF point unless necessary.The DOAs of multisource can be estimated by counting the angles of certain number of TF points.
3.3 | Single‐source zone detection
3.4 | Outlier removal
In the detected zones,there are many TF points whose angles are far from the real source angle, which are called outliers.Without considering the influence of noise, these consist mainly of reflection and/or multisource components, which will disturb localization performance.From Figure 1a–c,in the detected SSZs, it can be found that many TF points have angles gathered around the real source angles (i.e., 70°, 160°,and 250°),but there are several angles of TF points that are far from these real source angles.Aiming at this issue, an outlier removal method is proposed based on the angle distribution of TF points in SSZs.
As we all know, the ideal outlier removal method is to remove TF points whose angles are far from the real source angle.The source angles are not known in advance, and the median angles in the detected SSZs are likely to be close to the real source angles(as shown in Section 4).Therefore,the outlier removal method is proposed, which uses the median angle of each zone to construct an outlier set.For a detected TF zone L,the angle set of this zone is defined as
3.5 | Kernel density estimation and peak search
where C and v are the number of elements inP′′SSZand a smoothing parameter, respectively, and T(·) is a kernel function.Since the DOA estimates of the sources may appear in the local maxima of the KDE envelope curve ︿F(φ),φcorresponding to the peaks of the curve can be detected by the peak search algorithm [47], and these are identified as the DOA estimates of the sources.
4 | SIMULATIONS AND EXPERIMENTS
We conducted experiments under simulated and real scenarios to evaluate the performance of the proposed method.Simulation experiments were conducted in an environment simulated by Roomsim[44],whose parameters(i.e.,room sizes and locations of FOA microphone) are discussed in Section 2.Speech signals of six male and six female speakers from the NTT database were chosen as sound sources in both simulated and real scenarios.
Six group experiments were designed:
• analysing the influence of different SSZ detection thresholds to ensure a reasonable value;
• evaluating the SSZ detection results under different conditions;
• verifying the reasonability of removing outliers with median angles in each detected SSZ;
• evaluating the performance of outlier removal;
• comparing the localization performance of the proposed method with several reference methods in both simulated and real scenarios
Parameters and threshold settings are shown in Table 1.
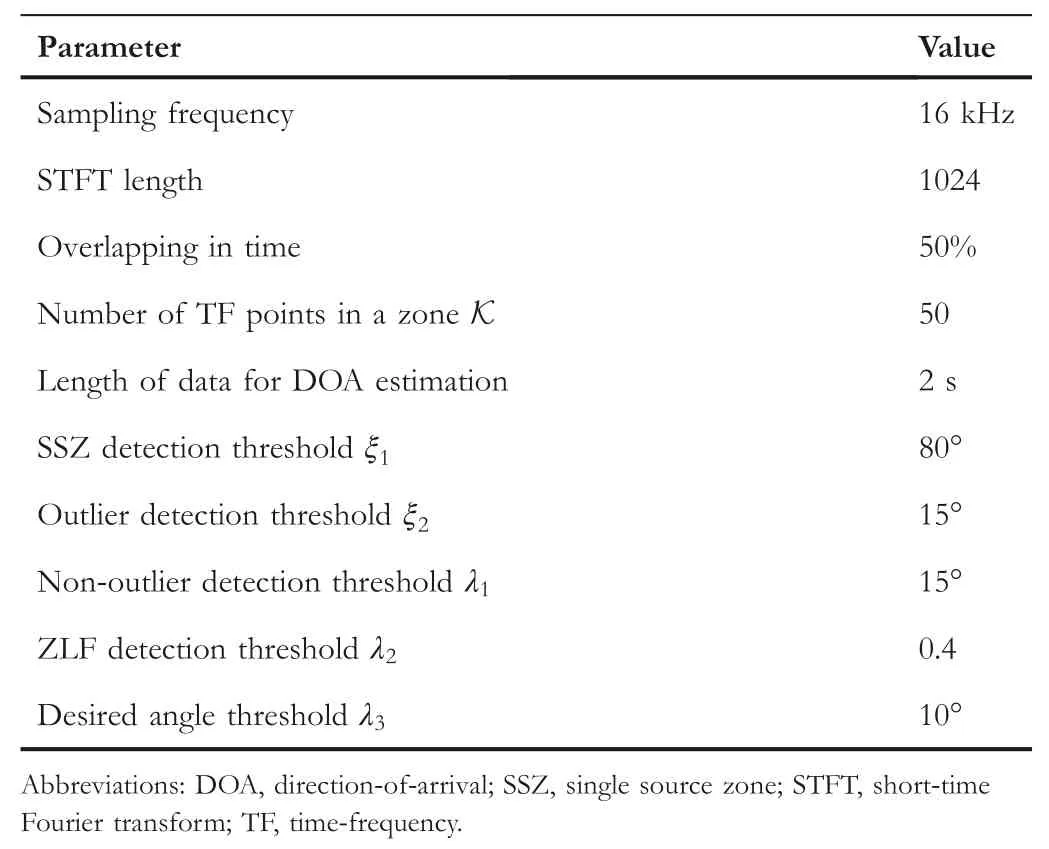
T A B L E 1 Experimental parameters
4.1 | Evaluation of single‐source zone detection threshold
In the detected TF zones, a TF point whose angle is within a small range around the real source angle is defined as a nonoutlier.The larger the number of non-outliers in a TF zone,the more favourable it is for localization.Assuming there areMTF zones, the non-outlier set of Lmis constructed as
whereNSSZ=card(PSSZ) is the number of TF points in the detected SSZs, and card(QSSZ) is the number of non-outliers inPSSZ.
To select the SSZ detection threshold, we analysed the influence of different thresholds on the proportion of nonoutliers in the detected SSZs in a three-source scenario with source separation of 90° and T60= 150 ms, 300 ms, 450 ms,and 600 ms.The results ofNSSZandRnonfor different SSZ detection thresholds(ε5) are shown in Figure 6a and b,respectively.
From Figure 6, we can find thatNSSZincreases andRnondecreases with the increase ofε5, and at any threshold, they decrease as reverberation time increases.As shown in Figure 6b,Rnonreaches the maximum value whenε5=60, because a smallerε5means that the angles of TF points in the detected zone are more convergent.However, under this threshold condition,NSSZis so small that some sources will be lost during DOA estimation.Therefore, it is unreasonable to achieve excellent localization performance by reducing the SSZ detection threshold.Although more TF points can be detected with a largerε5,Rnonis so small in this case that there are a large number of unavoidable outliers in the detected zones.To sum up, whenε5=80, bothNSSZandRnoncan reach reasonable values favourable to DOA estimation.Hence,we setε5to 80 in this work.
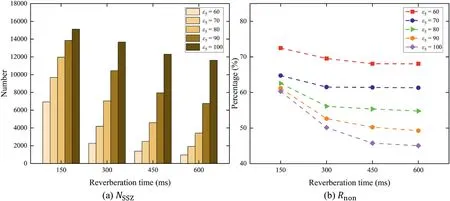
F I G U R E 6 Statistical results of NSSZ and Rnon for different thresholds (ε5 ) and reverberation times in the three-source scenario
4.2 | SSZ detection results
To verify the effectiveness of the proposed SSZ detection method inmore detail,thecorrelation-based method was chosen as the reference method and compared with the proposed method under different simulation conditions.First,we counted the number of SSZs detected by the proposed method and the correlation-based method.Then,the proportion of the number of the zones favourable to localization (ZFLs) in the detected SSZs of the two methods is calculated.If the number of nonoutliers in the TF zone exceeds a certain value, this zone is defined as a ZFL.Therefore, the index set of ZFLs is constructed as
whereλ2is a ZFL detection threshold.
In Section 3, the index set of the SSZs detected by the proposed SSZ detection method (PproSSZ) was obtained according to (24).The index set of SSZs detected by the correlation-based method [41] is constructed and denoted asPcorSSZ.Then, the numbers of the SSZs detected by two methods are
where card(·)denotes the calculation of the number of elements in a set.According to(25)and(37),the index sets of ZFLs in the SSZs detected by the two methods can be acquired as
The ratios of the numbers of ZFLs inPproSSZandPcorSSZare
To evaluate the performance of the proposed SSZ detection method and the correlation-based method, we counted the number of detected SSZs and the ratio of ZFLs to the detected SSZs with the two methods under different conditions,including different numbers of sources, angle separations between sources,and reverberation times.The angle separations were set to 60° and 90°, and the reverberation times to 150 ms, 300 ms,450 ms, and 600 ms in the two-source and three-source scenarios.The values ofNproSSZ,NcorSSZ,Rpro, andRcorunder different conditions are presented in Figures 7 and 8.
As shown in Figs.7a and 8a, the number of SSZs detected by the proposed method is slightly greater than by the reference method under most conditions, and the increase of reverberation time results in a decrease in the number of SSZs detected by both methods.Similarly, from Figs.7b and 8b, we can find thatRproandRcorare close at T60=150 ms.However,when T60= 300 ms, 450 ms, and 600 ms,Rprois obviously larger thanRcorwith the same angle separations and number of sources.This means that the ratio of ZFLs to the detected SSZs of the proposed method is greater than that of the reference method.For these two methods, a smaller source angle separation can also cause a decrease in the ratio of ZFLs to the detected SSZs.With the same angle separation and reverberation time, the more the sources, the smaller the ratio of ZFLs.We also analysed the influence of reverberation time onRproandRcor.Under the condition of low reverberation time(T60=150 ms),bothRproandRcorreach a ratio of more than 70%.However,RproandRcordecrease with the increase of reverberation time, andRprodecreases more slowly thanRcor.Rprocan reach more than 40% even at T60= 600 ms.
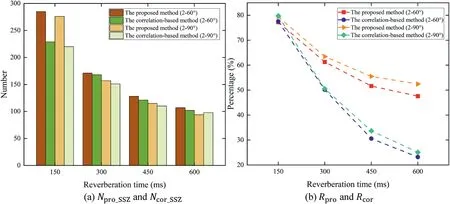
F I G U R E 7 Statistical results of Npro SSZ, Ncor SSZ, Rpro, and Rcor with different reverberation times and angle separations in the two-source scenario
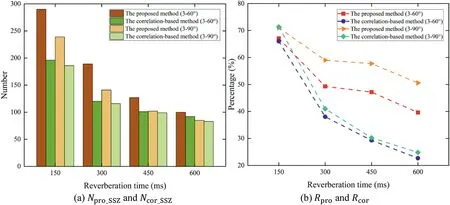
F I G U R E 8 Statistical results of Npro SSZ, Ncor SSZ, Rpro, and Rcor with different reverberation times and angle separations in the three-source scenario
4.3 | Reasonableness of median angle
We define the median angle within a detected SSZ as the desired angle when it is close to the real source angle.A set of desired angles is constructed as
where card(Pd)is the number of desired angles.The statistical results ofRdunder different reverberation times with source separation of 90°in the three-source scenario are presented in Figure 9.
As can be seen from Figure 9,the change of reverberation time does not greatly affectRd.In addition,Rdis greater than 75% at any reverberation time.Hence, the median angles in most detected zones are the desired angles,which imply that it is feasible to remove the outliers using median angles.
4.4 | Outlier removal results
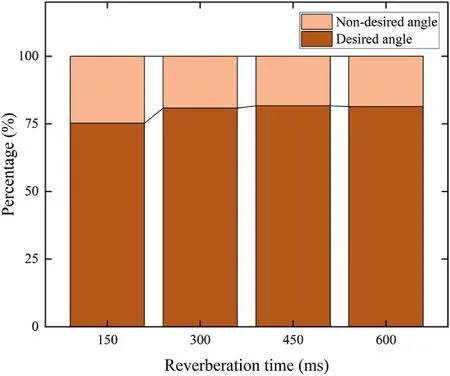
F I G U R E 9 Statistical results of Rd under different reverberation times
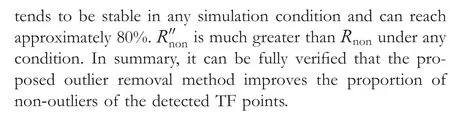
To evaluate the performance of outlier removal, comparative experiments were performed on the proposed method with and without outlier removal under different simulation conditions.As we know, non-outliers are the most useful TF points for localization.Based on a reasonable number of detected TF points,the higher the proportion of non-outliers in the detected TF points, the more effective the proposed method.Consequently, we counted the proportion of non-outliers in the TF points detected by the proposed method with and without outlier removal under different angle separations and reverberation times in the two-source and three-source scenarios.From (31) and (34), the set of non-outliers in the TF points detected by the proposed method with outlier removal is

F I G U R E 1 0 Statistical results of NSSZ, N′′SSZ, Rnon, and R′′non with different reverberation times and angle separations in the two-source scenario
4.5 | Direction‐of‐arrival estimation results in simulated scenarios
To verify the effectiveness of the proposed DOA estimation method,the localization performance of the proposed method and other reference methods was analysed in simulated scenarios.Mean absolute estimated error (MAEE) was chosen as to measure the difference between the true and estimated DOA in this paper.It is worth noting that the reliability of MAEE improves with the number of experiments.In this experiment,only the data that both the proposed method and the reference methods can obtain the DOA estimates were selected to calculate MAEE.MAEE is defined as
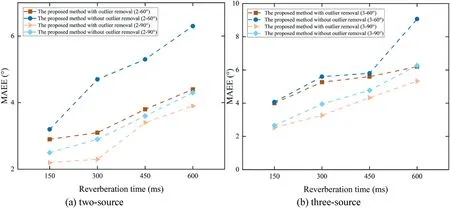
F I G U R E 1 2 MAEE results of the proposed method with and without outlier removal under different conditions
whereNeis the number of experiments,Iis the number of sources,φijand ~φijare the true and estimated DOAs,respectively, of the i th source in the j th experiment.The estimated DOAs ~φijcannot correspond to the real DOAsφij.Therefore, we calculated the absolute error between the estimated DOA and the real DOA in turn in the j th experiment and selected the DOA corresponding to the minimum error value as real DOA.A smaller MAEE implies better localization performance.In the simulation experiments,the reverberation time was set to 150 ms, 300 ms, 450 ms, and 600 ms, and the angle separation between adjacent sources was set to 60° and 90°.Based on the above conditions, these experiments were performed in the two-source and three-source scenarios.
We analysed the localization performance of the proposed method with and without outlier removal.The MAEE results with different reverberation times, angle separations, and number of sources are shown in Figure 12.
In Figure 12, there is no significant difference in localization performance with and without outlier removal at T60=150 ms.Nevertheless,the performance of the proposed method with outlier removal is better than without outlier removal with T60= 300 ms, 450 ms, and 600 ms.Therefore,the proposed outlier removal method is effective to obtain more accurate DOA estimates.
The proposed method with outlier removal (proposed method) was compared with some reference methods,including multisource localization methods using correlationbased SSZ detection (Correlation-based method) [41], LRSS point detection (LRSS-based method) [30], and offset residual weight(ORW-based method)[42].MAEE results as shown in Figures 13–15.
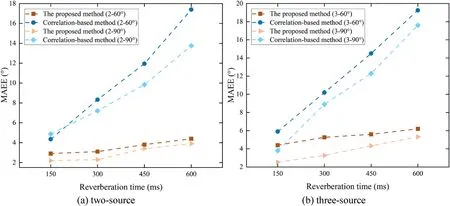
F I G U R E 1 3 MAEE results of the proposed and Correlation-based methods under different conditions
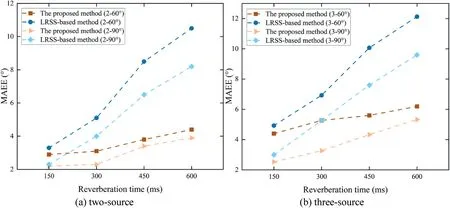
F I G U R E 1 4 The MAEE results of the proposed and low reverberation single-source-based methods under different conditions

F I G U R E 1 5 The MAEE results of the proposed and offset residual weight-based methods under different conditions
From Figures 13–15, we can find that the MAEE of the proposed method is less than that of the reference methods under all test conditions,that is,the proposed method achieves an excellent localization performance compared with reference methods.To be more specific,it can be found that the MAEEs of the proposed and reference methods are small under low reverberation conditions (T60= 150 ms).The MAEEs of the reference methods increase greatly with the increase of reverberation time, while the MAEE of the proposed method increases slowly.The number of sources and angle separations also affect the localization performance of these methods.From these dot plots,it can be seen that the localization performance of these methods in the two-source scenario is better than in the three-source scenario, and the localization performance under an angle separation of 60° is inferior to that under an angle separation of 90°.For example, with T60= 600 ms, source separation of 60°, and three sources, the MAEE is approximately 6°, which shows that the proposed method can still achieve acceptable localization performance in a suboptimal environment.Therefore, the above analysis is sufficient to demonstrate the effectiveness of the proposed method.
4.6 | Direction‐of‐arrival estimation results in real scenarios
For the experimental setup in a real scenario,two loudspeakers playing simultaneous speech signals were placed in a room that was 8 m long, 6 m wide, and 3.5 m high with speech signals from the NTT database with a 16-kHz sampling frequency.The reverberation time and the level of the background noise in the room were approximately 550 ms and 30 dB, respectively.An NT-SF1 R∅DE soundfield microphone was placed in the centre of the room, 1.6 m high and 1.6 m from the loudspeakers.The MAEE results of the four methods were compared when the source angle separations were 60°and 90°.
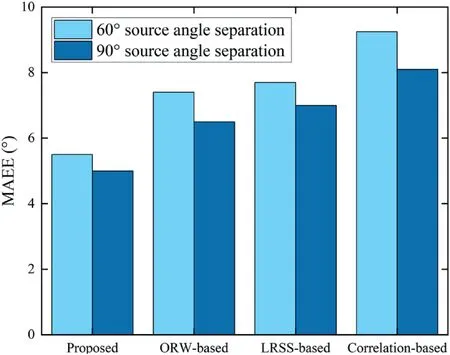
F I G U R E 1 6 MAEE results of the proposed and reference methods with different angle separations
From Figure 16, we can find that the MAEE of the proposed method is slightly less than that of the reference methods under the condition of angle separation of 60° and 90°.In addition, the reduction of source angle separation will lead to a decrease in localization performance.To sum up,the proposed method achieves excellent localization performance in real scenarios.
5 | CONCLUSIONS
After analysing the angle distribution of TF points, we found that most TF point angles in SSZs are gathered around the real angles of sources.Based on this,an SSZ detection method was proposed using a standard deviation measure that reveals the degree of angle convergence of TF points in a zone.Subsequently, an outlier removal method was designed using the median angle of each detected zone to remove TF points that are not favourable to localization.Finally, DOA estimates of multiple sources were obtained by KDE and peak search.Experiment results showed that the ratio of ZFLs to the detected SSZs of the proposed method was higher than that of the correlation-based method.Experiments in simulated and real scenarios demonstrated that the proposed multisource localization method can achieve superior performance compared with reference methods.
ACKNOWLEDGEMENT
This work was supported by the National Natural Science Foundation of China under Grant(No.61971015)and Beijing Natural Science Foundation (No.L223033).
CONFLICT OF INTEREST
No conflict of interest.
DATA AVAILABILITY STATEMENT
Data available on request from the authors.
ORCID
Liang Taohttps://orcid.org/0000-0002-0947-9893
Maoshen Jiahttps://orcid.org/0000-0002-3452-3913
Jing Wanghttps://orcid.org/0000-0002-3653-9951
杂志排行

CAAI Transactions on Intelligence Technology的其它文章
- Fault diagnosis of rolling bearings with noise signal based on modified kernel principal component analysis and DC-ResNet
- Short‐time wind speed prediction based on Legendre multi‐wavelet neural network
- Iteration dependent interval based open‐closed‐loop iterative learning control for time varying systems with vector relative degree
- Thermoelectric energy harvesting for internet of things devices using machine learning: A review
- An embedded vertical‐federated feature selection algorithm based on particle swarm optimisation
- An activated variable parameter gradient-based neural network for time-variant constrained quadratic programming and its applications