Effect of CeO2 on Activity of Catalysts CuO/ZnO/Al2O3/CeO2 for Synthesis of Methanol
2023-10-23ZhouSonghuaLiWenboWuZongjinChenZhongyangHuangChenZhangChuanweiWangBoPanHongyanLinQian
Zhou Songhua; Li Wenbo; Wu Zongjin; Chen Zhongyang; Huang Chen;Zhang Chuanwei; Wang Bo; Pan Hongyan; Lin Qian
(1. Guizhou Tianfu Chemical Industry Co., Ltd, Fuquan, 550501, China; 2. Department of Chemical Engineering,School of Chemistry and Chemical Engineering, Guizhou University, Guiyang 550025, China; 3. Guizhou Key Laboratory for Green Chemical and Clean Energy Technology, Guiyang 550025, China)
Abstract: The size of the nanoparticles and the number of oxygen vacancies have a significant effect on the catalytic activity of copper-based catalysts used for the synthesis of methanol from syngas. In this study, the authors prepared a series of catalysts CuO/ZnO/Al2O3/CeO2 (CZAC) with CuO particles of different sizes and varying number of oxygen vacancies on the surface by changing the added volume of CeO2 by using the co-precipitation method. The properties of the catalysts were characterized and their activity was evaluated by using high-pressure fixed-bed reaction equipment. The results showed that the addition of CeO2 to CuO/ZnO/Al2O3 not only influenced the size of the CuO particles and metal-metal interactions, but also had an effect on the concentrations of oxygen vacancies and strongly basic sites. The presence of CuO particles of small sizes and a large numbers of oxygen vacancies on the surface of the catalyst were beneficial to its activity for the synthesis of methanol. The catalyst CZAC, when modified by 5% of CeO2, recorded CuO particles of the smallest size (8.9 nm), strong intermetallic interactions, and the highest concentrations of oxygen vacancies and strongly basic sites.It also exhibited the highest catalytic activity, with a space-time yield of methanol of 0.315 g/(h·g) that was higher than that of the enterprise RK-5 catalyst [0.215 g/(h·g)].
Key words: catalyst; amount of CeO2 added; size of CuO particles; oxygen vacancies; methanol synthesis
1 Introduction
Methanol is an important chemical product that is widely used in various applications, including the manufacture of medicines, pesticides, and synthetic plastics[1]. The preparation of highly active and stable catalysts is the key to the synthesis of methanol. Copper-based catalysts exhibit good catalytic activity owing to the high dispersion of their active components and their large specific surface area. This class of catalysts has been most widely researched and used for the synthesis of methanol owing to its low cost of preparation[2]. The CuO/ZnO/Al2O3catalyst is primarily used for the industrial production of methanol from syngas. However, because of the low rate of CO2conversion and methanol selectivity of this process, the copper nanoparticles undergo agglomeration as a result of the Ostwald maturation effect, and this reduces the activity of the catalyst[3].
The activity of copper-based catalysts can be enhanced by modifying them through additives. Wang et al.[4]used ZrO2as a promoter to prepare the Cu-ZnO-ZrO2catalyst for the hydrogenation of CO2. The results showed that formation of the ZnO-ZrO2interface after ZrO2doping was conducive to the adsorption and conversion of CO2.Chen et al.[5]prepared CuZnO/SiO2catalysts with SiO2as the carrier. The presence of the carrier increased the dispersion and stability of the active component, but the metal-support interaction in the SiO2-supported catalyst was not very strong such that its catalytic activity was inadequate. It is thus important to develop a catalyst that can produce large amounts of methanol and convert CO2.
The theory of active centers holds that the smaller particles size of the active component is, the greater is the number of active sites, and the higher is the catalytic activity. In the case of copper-based catalysts, a smaller size of particles of the active Cu component leads to stronger interactions between Cu and the promoter or carrier, where this leads to a larger number of active sites that are available for the synthesis of methanol and ensures higher catalytic activity[6]. Moreover, analyses of the syngases CO, CO2, and H2have shown that CO2is an acidic gas. According to the acid-base reaction, a larger number of basic sites on the surface of the catalyst is more favorable for the adsorption and reaction of CO2. Strongly basic sites on the surface of the catalyst represent surface oxygen vacancies[7]. Indeed, an increase in the number of oxygen vacancies can enhance the adsorption of CO and CO2, and the conversion of these species to formate intermediates[8]that in turn promotes the synthesis of methanol. Therefore, the degree of interaction between Cu and the catalyst auxiliary or carrier as well as the number of surface oxygen vacancies need to be increased to enhance the degree of hydrogenation of CO and CO2as part of the reactivity that leads to the synthesis of methanol.
CeO2, a basic oxide, can be added to the catalyst to increase the number of basic sites on its surface. CeO2itself can also be the site of a redox reaction (Ce4+⇌ Ce3+)that is easy to reverse[9-13], and can lead to the generation of additional oxygen vacancies. It has thus been widely used for the preparation of heterogeneous catalysts in recent years. The results of a study by Gao et al.[14]showed that addition of CeO2to copper-based catalysts helped increase their basicity[15]. The methanol yield of a system comprising a Cu/ZnO/CeO2catalyst prepared by Si et al.[16]exceeded that of a system comprising a Cu/ZnO/Al2O3catalyst prepared by using the same method at the same reaction temperature. The excellent performance of the Cu/ZnO/CeO2catalyst was attributed to the unique oxidation-reduction reaction of CeO2that could be used to adjust the catalyst. The Cu0/Cu+ratio on the surface prevented the Cu0species from being oxidized to Cu2+,thereby enhancing catalytic activity.
In light of the above, the authors of this study use CeO2as a catalytic promoter to prepare a series of CuO/ZnO/Al2O3/CeO2(CZAC) catalysts with different mass fractions of CeO2based on the co-precipitation method,and test its performance in terms of the synthesis of methanol in a high-pressure fixed bed. We analyze the effects of adding different volumes of CeO2to the Cu/ZnO/Al2O3catalyst on its structure and catalytic activity.
2 Experimental
2.1 Catalyst preparation
Using the co-precipitation method, the CZAC catalysts with different contents of Al2O3and CeO2were prepared.For this purpose, suitable masses of Cu(NO3)2·3H2O,Zn(NO3)2·6H2O, Al(NO3)3·9H2O, and Ce(NO3)3·6H2O were dissolved in deionized water to prepare a 1 mol/L mixed metal solution. At the same time, the relevant amount of (NH4)2CO3was dissolved in deionized water to form a 1 mol/L solution that was subsequently used as a precipitation agent. The (NH4)2CO3(precipitant)solution was added dropwise to the mixed metal solution by using a peristaltic pump while vigorously stirring it at a temperature of 70 °C. The pH of the final solution was seven, and its temperature of 70 °C was maintained for 2 h under stirring and aging. The suspension thus obtained was filtered, and the isolated residue was washed with deionized water three times, dried at 80 °C for 10 h, and calcined in atmospheric air at a temperature of 350 °C for 5 h to obtain the relevant CZAC catalyst. The prepared catalyst is called CZAC-xaccording to the volume of CeO2, where “x” represents the percent mass fraction of CeO2(x= 0, 2.5, 5, 7.5, 10) used during the preparation of the catalyst.
2.2 Catalyst characterization
The phase composition of the catalysts was analyzed by XRD (A PANalytical’s X’Pert PRO). A Cu Kα source was used to this end, with a range of scanning of 2θ =15°-70°. The XPS-based characterization of the catalyst was performed by using the Thermo Scientific ESCALAB 250XI photoelectron spectrometer with an Al Kα source of radiation. The test energy was 1486.8 eV, and C1s 284.8 eV was used to correct the position of the peak.H2-TPR-based and CO2-TPD-based characterizations of the catalysts were carried out by using an AutoChem II 2920 chemisorption analyzer. Their specific surface areas and pore structures were investigated by using the ASAP 2020 physical adsorption instrument, manufactured by Micromeritics in the USA. The TG characterization of the catalysts was performed in atmospheric air at a rate of heating of 5 °C/min by using the TG 209 F1 Libra thermogravimetric analyzer, manufactured by NETZSCH.
2.3 Reaction test
The activity of the catalysts was evaluated by using a highpressure fixed bed and gas chromatograph. Specifically,0.3–0.6 g of a 20–40-mesh catalyst was placed in a stainless steel reaction tube, with an inner diameter of 8 mm, that was fixed by using quartz wool. The reaction tube was then placed in the zone of constant temperature of an electric furnace, and the reaction temperature of the catalyst bed was measured by a thermocouple with an accuracy of ±0.1 °C. Before the reaction, the catalyst was reduced in situ for 3 h at a certain temperature as H2gas flowed through it at a temperature of 260 °C, pressure of 0.5 MPa, and rate of flow of 50 mL/min. The flowing gas was then switched from pure H2gas to a mixture containing H2, N2, CO, and CO2at a ratio of 64.2:16.5:14.8:4.5. The catalytic synthesis of methanol was then carried out at a temperature of 250 °C, a pressure of the gas mixture of 3 MPa, and a volumetric spatial velocity (GSHV) of 6000 mL/(g·h).
The gas at the inlet and outlet (gas after separation) of the catalyst bed was sampled and analyzed by using a GC7820 gas chromatograph that was equipped with a flame ionization detector (FID) and a thermal conductivity detector (TCD). The FID was used to detect CH3OH and CH4while the TCD was used to determine the contents of N2, CO, and CO2. This approach was used to calculate the rate of conversion of CO (XCO), methanol selectivity (SCH3OH), and the space-time yield of methanol(STYgMeOH/h/gcat). Specifically,XCO(andXCO2)were determined by the following formula:
where [CO]inand [CO]outrepresent CO contents of the gas at the inlet and the outlet of the catalyst bed,respectively, as analyzed by the TCD of the GC7820 gas chromatograph.
The external standard method was used to detect the components of methanol in the gas phase. The volume of methanol produced was calculated applying the area normalization method to the obtained chromatogram. The values of andSTYwere calculated as follows:
whereA isthe area of the peak,frepresents factors of calibration,xisthe volume fraction of CO or CO2in the mixture, andMCH3OHis the molecular weight of methanol.
3 Results and Discussion
3.1 Catalyst characterization
3.1.1 TG analysis
We characterized the non-calcined catalyst by using TG to study its decomposition-related behavior during the calcination process and determine the appropriate calcination temperature. The results are shown in Figure 1. The precursor of the CZAC-xcatalysts are all onestep weightlessness (the acronym “CZAC-x” refers to members of the synthesized family of Cu/ZnO/Al2O3/CeO2-type catalysts, where x represents the percent mass fraction of CeO2during the preparation of the catalyst).The curve of TG can be divided into three parts. The first showed a loss of weight between 80 °C and 100 °C that can be attributed to the removal of water molecules that were physically adsorbed onto the catalyst. The second part showed a loss of weight between 150 °C and 210 °C due to the removal of hydroxyl groups originally present in the catalyst precursor, and the loss of CO2molecules released as a result of thermal decomposition. The third part was characterized by the loss of weight occurring between 210 °C and 450 °C, which can be attributed to the decomposition of the hydroxycarbonate species present in the catalyst precursor that led to the formation of the corresponding oxides[17-18]. The differential curve of TG in Figure 1b shows that the rate of the maximum loss of weight of the CZAC-xcatalyst precursor was obtained at a temperature of about 350 °C. Therefore,the calcination temperature during the preparation of the catalyst CZAC-xwas set to 350 °C.
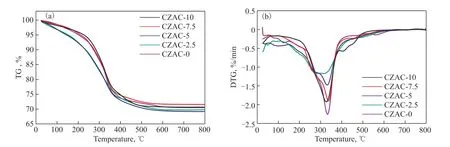
Figure 1 Results of thermogravimetric analyses of variants of the catalyst CZAC-x
3.1.2 XRD analysis
Figure 2 shows the XRD spectra of the catalysts CZAC-x.The peak of diffraction of CuO at 2θvalues of 35.6°,38.7°, and 48.7° (JCPDS48-1548) were observed for five variants of CZAC-x. The peaks of diffraction of ZnO, on the contrary, appeared at 2θ values of 31.8°, 56.6°, and 68.0° (JCPDS 36–1451). The data thus indicate that Cu and Zn existed in the form of CuO and ZnO, respectively,in the series of CZAC-xcatalysts. Importantly, no peak of diffraction due to Al2O3and CeO2was detected in this series of catalysts, indicating that the Al-based and Cebased species were either highly dispersed in them, or existed as amorphous forms of Al2O3and CeO2.

Figure 2 X-ray diffractometry spectra of variants of thecatalyst CZAC-x
Compared with the catalyst CZAC-0 that was prepared without being doped by CeO2, the intensities of the peaks of diffraction of CuO and ZnO were significantly lower for the catalysts CZAC-2.5, CZAC-5, CZAC-7.5, and CZAC-10. Based on the XRD data, we used the Scherrer formula to calculate the grain size of the (111) crystalline plane of CuO, and the results are listed in Table 1. The grain size of the (111) crystalline plane of CuO in the CZAC-0 catalyst was 11.2 nm, while those of CZAC-2.5, CZAC-5, CZAC-7.5, and CZAC-10 were all smaller than 11 nm. CZAC-5 exhibited the lowest crystallinity as its (111) crystalline plane of CuO had the smallest grains(8.9 nm). The evidence thus suggests that adding CeO2to the Cu/ZnO/Al2O3(CZA) catalyst helped increase the dispersion of the active components and reduce their particle size.
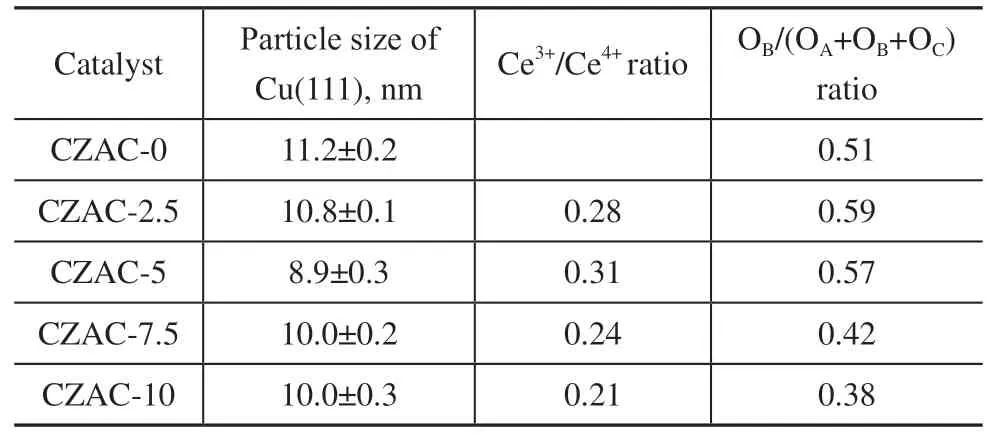
Table 1 Surface elemental compositions of members of the family of CZAC-x catalysts
3.1.3 H2-TPR analysis
Figure 3 shows the H2-TPR profiles of the catalysts CZAC-x. It indicates that CZAC-xcatalysts exhibited only one reduction peak up to a temperature of 500°C. Because ZnO and CeO2cannot be reduced at temperatures below 500 °C, the observed reduction peaks were all related to the reduction of CuO present in the catalyst. The temperature of the reduction peak (Tp)of CuO, which was observed at the highest temperatures for various samples of the catalyst, confirmed that theTpof CuO in various catalysts varied with the CeO2content in them.
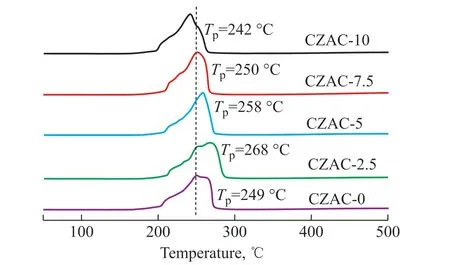
Figure 3 Profiles of the H2 temperature-programmed reduction of variants of the catalyst CZAC-x
Unlike in case of the original catalyst CZAC-0, which was characterized by a peak of reduction of CuO at 249°C, the addition of CeO2to CZA up to a mass fraction of 7.5% (i.e., to obtain the catalysts CZAC-2.5, CZAC-5, and CZAC-7.5) was found to be associated with a slight but progressive increase in the temperature of the reduction peak. However, when CeO2was added to CZA up to a mass fraction of 10% (i.e., to obtain CZAC-10),the temperature of the reduction peak decreased slightly with respect to that of the catalyst CZAC-0. An increase in the temperature of the reduction peak indicates an enhanced interaction between the metal oxide and the support or the metal oxide. This general trend justifies the observation that the temperatures of the reduction peak of the catalysts CZAC-2.5, CZAC-5, and CZAC-7.5 were higher than that of CZAC-0. Indeed, the interaction between CuO and ZnO in catalysts CZAC-2.5, CZAC-5, and CZAC-7.5 was enhanced with respect to that in CZAC-0. This effect was observed because the addition of CeO2increased the dispersion of CuO on the surface of the catalyst (see the XRD data discussed in Section 3.1.2).A stronger CuO-ZnO interaction can lead to the formation of a larger number of CuO-ZnO interfaces, which are active sites for the synthesis of methanol[6]. However,the peak due to CuO reduction in case of the catalyst CZAC-10 was observed at a lower temperature than its counterpart for CZAC-0, indicating that the interaction between CuO and ZnO had weakened in CZAC-10 in comparison with that in CZAC-0 such that CuO was more easily reduced.
3.1.4 XPS analysis
Figure 4 shows the XPS spectra of the catalysts CZAC-0, CZAC-2.5, CZAC-5, CZAC-7.5, and CZAC-10. The Cu 2p, Zn 2p, Ce 3d, and O 1s spectra of the catalysts are shown in Figures 4(a–d). The Cu2p spectra in Figure 4(a) show that two peaks due to Cu 2p3/2and Cu 2p1/2were observed on the catalysts at 933 eV and 953 eV,respectively. Moreover, the Cu 2p satellite peaks were observed between these peaks, and had been formed due to the presence of Cu2+ions in CuO. This indicates that copper existed in the form of Cu2+in the family of CZAC-xcatalysts. Two peaks, due to Zn 2p3/2and Zn 2p1/2, are observed at 1022 eV and 1045 eV, respectively, in the Zn 2p spectra of the five catalysts [Figure 4(b)], and belonged to the peaks of the energy spectrum of ZnO. This evidence indicates that zinc existed in the form of Zn2+in members of the family of CZAC-xcatalysts. The results of XPS were thus consistent with those of XRD analysis in that both indicate that copper and zinc existed in the form of CuO and ZnO, respectively, in the catalysts CZAC-x.The peak marked by “V” in the Ce 3d spectra of the five CZAC-x-type catalysts [Figure 4(c)] corresponds to Ce 3d5/2, and that marked by “U” corresponds to Ce 3d3/2. V,V’’, V’’’, U, U’’, and U’’’ represent the peaks of Ce4+, and V’ and U’ represents those of Ce3+[16,19]. This indicates that Ce in CZAC-2.5, CZAC-5, CZAC-7.5, and CZAC-10 existed in the form of both Ce4+and Ce3+ions. The Ce3+/Ce4+ratio on the surface of the catalyst was calculated by fitting the results, and the outcomes are listed in Table 1. They show that as the amount of CeO2added to CZA increased, the Ce3+/Ce4+ratio initially increased and then decreased, and had the largest value for the CZAC-5 catalyst when 5% of CeO2was added to CZA.
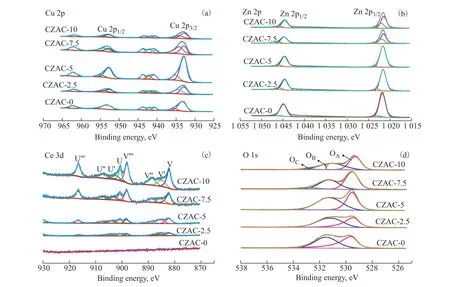
Figure 4 X-ray photoelectron spectra of the catalysts CZAC-x
The O 1s spectra of the five CZAC-x-type catalysts[Figure 4(d)] were fitted into three peaks that were labeled OA, OB, and OC. OAoccurred due to the presence of the O2-species in the crystal lattice, OBoccurred due to the presence of movable oxygen ions, such as O2-and O-,that usually represent oxygen vacancies in the catalyst[13],and OCwas obtained due to the adsorption of oxygen in the hydroxyl groups on the surface of the catalyst[17,20].The OB/(OA+ OB+ OC) ratio on the surface of the catalyst was calculated based on the results of fitting, and the outcomes are listed in Table 1. They show that the concentration of oxygen vacancies on the surface OBwas higher in the catalysts CZAC-2.5 and CZAC-5 than in CZAC-0. However, as the volume of CeO2added to CZA continued to increase past the 5% mass fraction,the concentration of oxygen vacancies on the surface OBin the CZAC-xcatalysts started to decrease. Overall, the addition of a small amount of CeO2was beneficial for the structural features of CZAC-xbecause it increased OBon the surface of the catalyst. This is because that the formation of Ce3+was accompanied by the generation of oxygen vacancies in the catalyst due to the reduction of Ce4+[21]. Therefore, OBincreased with the content of Ce3+for CZAC-2.5 and CZAC-5. However, although the CeO2contents of CZAC-7.5 and CZAC-10 were higher than that of CZAC-5, their values of OBwere lower than that of CZAC-0. This might have been related to the addition of an excessive amount of CeO2to the catalyst that weakened the interaction between the metal and the support (as is evident from the H2-TPR data discussed in Section 3.1.3). The electronic environment around Ce was thus less influenced by the other metals, resulting in a small amount of Ce4+being converted into Ce3+and, as a consequence, fewer oxygen vacancies being generated.Given that the number of oxygen vacancies of a catalyst is closely related to its activity, adding too much CeO2may reduce the activity of the catalyst.
An examination the data listed in Table 1 shows that the catalysts CZAC-2.5 and CZAC-5, which were characterized by higher Ce3+/Ce4+ratios, had higher OB/(OA+ OB+ OC) ratios. Conversely, the catalysts CZAC-7.5 and CZAC-10, which were characterized by lower Ce3+/Ce4+ratios, had lower OB/(OA+ OB+ OC) ratios.Zheng et al.[19,22]have pointed out that the concentration of oxygen vacancies is directly proportional to the rate of catalytic formation of methanol. Therefore, increasing the concentration of oxygen vacancies on the surface of the catalyst can enhance the activity of catalysts.
3.1.5 CO2/CO-TPD analysis
Figure 5a shows the CO2-TPD profiles of the CZAC-xcatalysts. The curves of CO2desorption of the catalysts can be divided into three peaks, appearing around 120°C, 270 °C, and 400 °C, due to CO2desorption from sites characterized by weak (α peak), medium (β peak), and strong basicity (γ peak), respectively, on the surface of the catalyst. The peak desorption near 120 °C was formed due to the desorption of CO2that had been physically adsorbed on the catalyst. The peak desorption near 270°C occurred due to the desorption of CO2that had been chemically adsorbed at sites of metal-oxygen pairs (e.g.,Cu–O and Zn–O) on the surface of the catalyst. The peak desorption near 400 °C was due to the desorption of CO2that had been adsorbed on oxygen atoms with low coordination, i.e., oxygen vacancies on the surface of the catalyst[6].
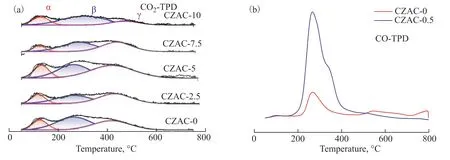
Figure 5 Profiles of temperature-programmed desorption of CO2/CO by members of the family of the catalyst CZAC-x
Compared with the catalyst CZAC-0, the positions of the peaks of desorption corresponding to the strongly basic sites (γ peaks) of the catalysts CZAC-2.5, CZAC-5,CZAC-7.5, and CZAC-10 shifted to a higher temperature.This indicates that CeO2doping enhanced alkalinity on the surface of the catalysts. The areas of the peaks obtained due to the desorption of CO2from the strongly basic sites (γ peak) of the catalysts CZAC-2.5, CZAC-5, CZAC-7.5, and CZAC-10 initially increased with the amount of CeO2added, but eventually exhibited the opposite trend (Table 2). This peak for CZAC-5 had the largest area, which indicates that the surface of CZAC-5 contained a higher concentration of strongly basic sites than those of the other catalysts in the CZAC-xseries. A large number of strongly basic sites on the surface of the catalyst are conducive to the adsorption and activation of CO2, where these latter processes are conducive to the conversion of CO2into methanol.
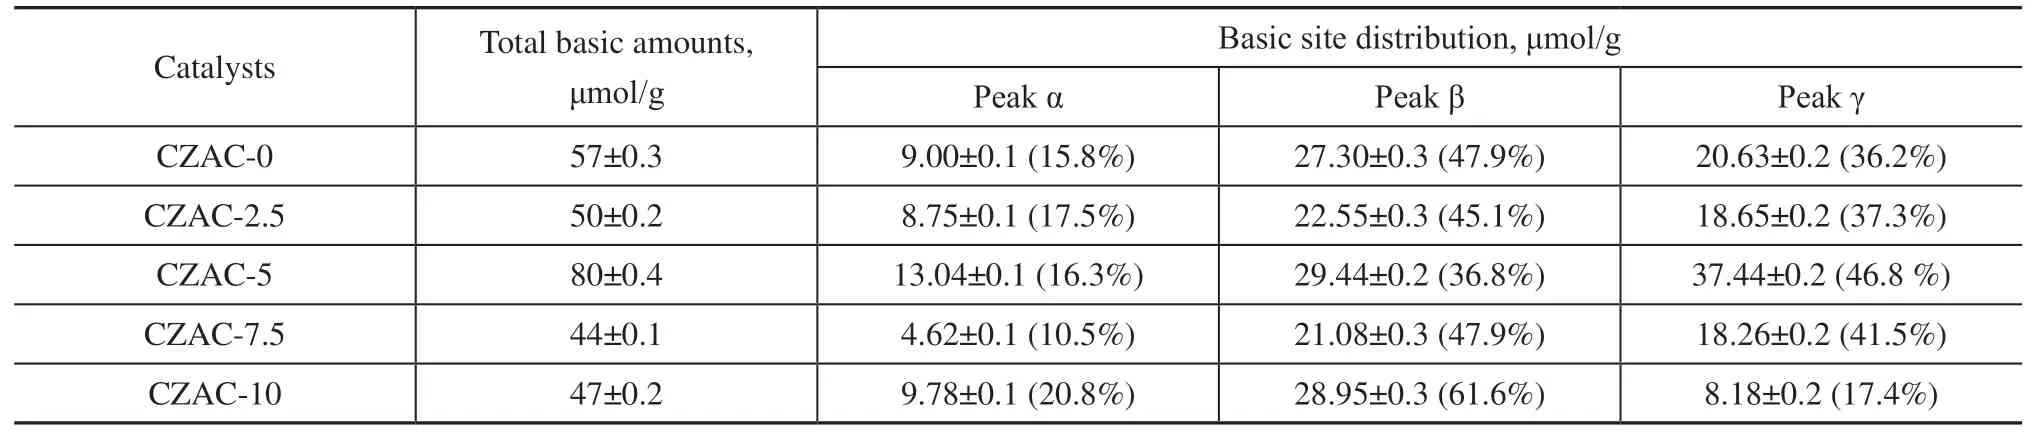
Table 2 The total basic amounts of the CZAC-x catalysts and the distributions of the basic site on them
Figure 5b shows profiles of the CO-TPD of the catalysts CZAC-0 and CZAC-0.5. It is clear from it that area of the peak of desorption of CO for CZAC-0.5 was much larger than that of CZAC-0, indicating the addition of CeO2to CAZC also enhanced the adsorption of CO owing to larger numbers of strongly basic sites and oxygen vacancies.
3.1.6 Pore structure analysis
Figures 6a and b show isotherms of the adsorption/desorption of N2by the catalysts CZAC-xand the relevant distributions of the pore size. The data in Figure 6a show that the curves of adsorption and desorption of N2of all CZAC-xcatalysts were III + IV adsorption isotherms, and exhibited the typical characteristics of the adsorption of mesoporous materials.This shows that mesopores were prevalent in these catalysts,with some macropores also being present. The diagram of the distribution of the pore size in Figure 6b shows that the sizes of pores of the prepared catalysts were mainly distributed in the range of 3–120 nm. This indicates that members of the CZAC-xfamily of catalysts were mesoporous materials, and this morphological trait is conducive to the adsorption and mass transfer of reactant molecules.
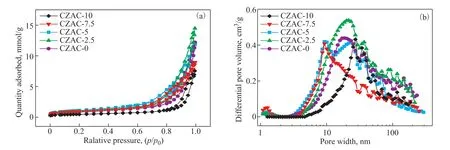
Figure 6 Adsorption/desorption isotherms of N2 by the members of the family of CZAC-x catalysts and (a) pore size distributions of the catalysts (b)
Table 3 shows the specific surface areas and parameters of the pore structure of the CZAC-xcatalysts. The BET surface area and volume of mesopores of the catalysts first increased and then decreased with an increase in the volume of CeO2added. CZAC-5 had the largest BET surface area. The contents of CuO and CeO2detected in the catalysts by using XRF are listed in Table 3.

Table 3 Metal oxide content and physical properties of the CZAC-x catalysts
3.2 Catalytic performance
Figure 7 shows the catalytic activity of the catalystsCZAC-xin the synthesis of methanol from syngas. The performance of the commercial catalyst RK-5 is also listed for the sake of comparison. It is clear that the total rates of carbon conversion (X(CO+CO2)) [Figure 7(a)] and CO conversion [Figure 7(b)], methanol selectivity [Figure 7(c)], and the STY of methanol [Figure 7(d)] of these catalysts gradually increased during the first 6 h of the reaction, and then stabilized because the catalyst was in the mature stage of its lifetime before 6 h.
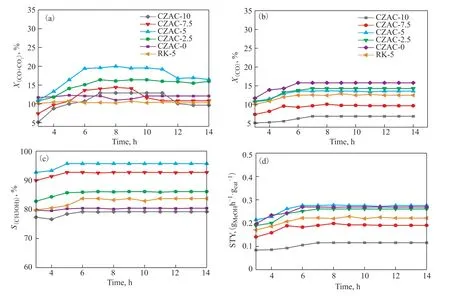
Figure 7 Performance of the catalysts CZAC-x. (a) CO conversion. (b) Methanol selectivity. (c) Space-time yield of methanol
The total rates of carbon conversionX(CO+CO2)) [Figure 7(a)] of the catalysts CZAC-2.5 and CZAC-5 were significantly higher than that of the catalyst CZAC-0. CZAC-5 had the largest value ofX(CO+CO2). On the contrary, CZAC-7.5 and CZAC-10 exhibited the opposite trend. The values ofX(CO+CO2)of these catalysts were almost consistent with the trends of their strongly basic sites (Table 2) and number of oxygen vacancies (Table 1). CZAC-5 had the largestX(CO+CO2)because it had larger numbers of strongly basic sites and oxygen vacancies.This means that larger numbers of strongly basic sites and oxygen vacancies in the catalysts were beneficial for the adsorption and reaction of CO2. In addition, the rate of conversion of CO by the catalysts CZAC-xdecreased with an increase in the amount of CeO2added to them[Figure 7(a)] owing to the stronger competition from the adsorption of CO2on their strongly basic sites.
The methanol selectivity and STY of the catalysts CZAC-2.5 and CZAC-5 were higher than that of CZAC-0, as shown in Figures 7(c) and (d), while the STY of CZAC-7.5 and CZAC-10 decreased when the amount of CeO2added to them was greater than 5% of the mass fraction.This means that when the amount of CeO2added to CZA corresponded to 5% of the mass fraction (to obtain CZAC-5), the methanol selectivity and STY of this catalyst were the highest. This is because when the amount of CeO2added was ≤5% in terms of the mass fraction, its presence enhanced the dispersion of CuO on the surface of the catalyst such that the intensity of the interaction between CuO and ZnO increased. A stronger CuOZnO interaction in turn led to the formation of a larger number of CuO-ZnO interfaces, which are active sites for the synthesis of methanol. As a result, the methanol selectivity of the catalysts CZAC-2.5 and CZAC-5 increased during the reaction[6]. When an excessive amount of CeO2was added to the CZA catalyst, the CuOZnO interaction was weakened such that that the number of active sites available for the synthesis of methanol decreased, as did the methanol selectivity of the catalyst CZAC-10. Furthermore, the introduction of a small amount of CeO2to CZAC increased the ratios of Ce3+/Ce4+and OB/(OA+ OB+ OC) of CZAC-2.5 and CZAC-5, that is,there was a higher concentration of oxygen vacancies on the surface of these catalysts. Following reduction, part of the Ce4+present in the catalysts CZAC-2.5 and CZAC-5 was converted into Ce3+, which led to the generation of more oxygen vacancies. The surface concentration of the oxygen vacancies was directly proportional to the rate of the catalytic formation of methanol. Therefore,the values of STY of methanol of the catalysts CZAC-2.5 and CZAC-5 were higher than that of CZAC-0. However,when a larger amount of CeO2was added to them, the concentration of oxygen vacancies on the surface of the catalysts decreased, as in case of CZAC-7.5 and CZAC-10, resulting in a decrease in their STY of methanol. In addition, the introduction of a small amount of CeO2to CZAC enhanced the number of strongly basic sites, where this is conducive to the adsorption and activation of CO2,and an enhancement in methanol selectivity. Therefore,the catalyst CZAC-5, which was characterized by the smallest CuO particles, strong intermetallic interaction,and the highest concentrations of oxygen vacancies and strongly basic sites, exhibited the highest catalytic activity. Specifically, the STY of methanol of CZAC-5 was 0.315 g/(g·h), higher than that of the enterprise RK-5 catalyst [0.215 g/(g·h)].
4 Conclusions
The addition of CeO2to CZA did not merely influence the size of the Cu particles and metal-metal interactions in the CZAC catalysts, but also influenced the concentrations of oxygen vacancies and strongly basic sites on the surface of the catalysts. Specifically, as the mass fraction of CeO2in CZAC catalysts increased from 0% to 5%, the dispersion of CuO on their surface increased, the sizes of the Cu particles decreased, the intensity of the interaction between metals increased, and the concentrations of oxygen vacancies and strongly basic sites on the surface of the catalysts increased. However, when the mass fraction of CeO2in the CZAC catalysts was ≥7.5%,the intensity of the interactions between Cu and ZnO decreased with respect to those in CZAC-0 (no CeO2present), as did the concentrations of oxygen vacancies and strongly basic sites on the surface of the catalyst. The catalyst CZAC-5, characterized by a 5% mass fraction of CeO2, contained the smallest CuO particles (8.9 nm),strong CuO-ZnO interactions, and more oxygen vacancies and strongly basic sites than any of the other catalysts.These characteristics rendered it more prone to engage in the adsorption and activation of the reactants.
The results of experiments on catalytic activity conducted in this study indicated that as the mass fraction of CeO2in the CZAC catalysts was increased from 0% to 5%,the rate of CO conversion of these catalysts gradually decreased but the total rate of carbon conversion increased. Indeed, adding a small amount of CeO2to the CZA catalyst increased the extent to which the CO2present in the synthesis gas underwent conversion. When the mass fraction of CeO2in CZAC was ≤5%, a further increase in the amount of CeO2was observed to be associated with an increase in the methanol selectivity and STY of the catalyst. However, as the mass fraction of CeO2in the CZAC catalyst was increased past the 5%mark, the methanol selectivity and STY of the catalysts decreased. The catalyst CZAC-5 exhibited the highest catalytic activity. Its STY of methanol was 0.315 g/(g·h),which was higher than that of the enterprise RK-5 catalyst[0.215 g/(g·h)].
Acknowledgements:This work was supported by the Nature Science Foundation of China (Grant 22262006, 22068009),the Supported by Guizhou Provincial Science and Technology Projects (ZK[2023] ordinary 050, [2023] General 403), the Science and Technology Support Plan Projects of Guizhou Province (Grant (2018) 2192), the Scientific and Technological Innovation Talents Team of Guizhou (2018-5607), the Science and Technology Foundation of Guizhou Province (2017-7254), the One hundred Person Project of Guizhou Province(No.20165655), and the Innovation Group Project of Education Department in Guizhou Province (No. 2021010).
杂志排行

中国炼油与石油化工的其它文章
- Ultra-deep Removal of Metal Ions from Coal Tar by Complexation: Experimental Studies and Density Functional Theory Simulations
- Effect of Mixed Dispersants on Suppression of the Gel Effect during Aqueous Adiabatic Terpolymerization of AM, NaAA, and DMC
- A Metal-free Polyimide Photocatalyst for the Oxidation of Amines to Imines
- C9H10O2:0.5ZnCl2/SG as a High-Efficiency Catalyst for Desulfurization of Model Oil
- Application and Regeneration of a Non-Aqueous System of Cu/HCl and DMF for the Oxidation of Hydrogen Sulfide in Natural Gas
- Pyrolysis Mechanism of a Cyclotriphosphazene-Based Flame-Retardant Epoxy Resin by ReaxFF Molecular Dynamics