Pharmacokinetics of Enrofloxacin and Its Metabolite in Carp (Cyprinus carpio) After a Single Oral Administration in Medicated Feed
2023-03-17LIUYingLIZhaoxinZHANGDahaiXINGLihongSUNWeihongSUNXiaojiePENGJixingZHANGYonggangandLIXianguo
LIU Ying, LI Zhaoxin, ZHANG Dahai, XING Lihong, , SUN Weihong,SUN Xiaojie, PENG Jixing, ZHANG Yonggang, and LI Xianguo,
Pharmacokinetics of Enrofloxacin and Its Metabolite in Carp () After a Single Oral Administration in Medicated Feed
LIU Ying1), 2), 3), 4), LI Zhaoxin4), ZHANG Dahai1), XING Lihong4),*, SUN Weihong4),SUN Xiaojie4), PENG Jixing4), ZHANG Yonggang1), and LI Xianguo1),*
1)College of Chemistry and Chemical Engineering, Ocean University of China, Qingdao266100, China 2) Qingdao Fishery Technology Service Station, Qingdao 266071, China 3)Qingdao Marine Management Support Center, Qingdao266071, China 4) Key Laboratory of Testing and Evaluation for Aquatic Product Safety and Quality, Laboratory of Quality & SafetyRisk Assessment for Aquatic Products, Ministry of Agriculture and Rural Affairs, Yellow Sea Fisheries ResearchInstitute,Chinese Academy of Fishery Sciences, Qingdao 266071,China
A precise and reliable analytical method of high performance liquid chromatography-tandem mass spectrometry (HPLC- MS/MS) was developed to measure trace levels of enrofloxacin (ENR) and its major metabolite ciprofloxacin (CIP) in carp tissues. Optimized chromatographic separation was obtained on a Waters Xterra MS C18reversed-phase column using gradient elution with methanol and 0.1% formic acid aqueous solution including 5mmolL−1of ammonium acetate. The established method was applied to study the pharmacokinetics and distribution of ENR and CIP in tissues of carp following a single oral administration in feed at a dosage of 40mgkg−1bw (body weight). Data were analyzed using DAS 2.0 dynamics software, and the experimental results suggest that ENR was rapidly absorbed and extensively distributed in carp tissues through systemic circulation, and the pharmacokinetic characteristics can be described with a two-compartment model. The elimination half-lives (1/2β) from muscle, liver, gill, plasma and skin were 131, 160, 104, 132 and 310h, respectively. The areas under the drug concentration-time curves (AUC) for these tissues were 491, 972, 750, 249 and 706hmgkg−1, respectively. The maximum concentration(max) values were 13, 29, 37, 9 and 5mgkg−1with peaktimes (max) of 8, 4, 4, 2 and 4h, respectively. Ciprofloxacin, the active metabolite of ENR, was also detected in carp tissues, indicatingthat only 1.54% of de-ethylation of ENR occurs in carp. At a water temperature of 18℃, the drug withdrawal time was determined to be no less than 24d while the carp was fed at a single dosage of 40mgkg−1.
; enrofloxacin; ciprofloxacin; pharmacokinetics; liquid chromatography-tandem mass spectrometry
1 Introduction
Drug residue exceeding the recommended limits is one of the most important problems in the aquatic products’ safety in China. The problem highly impacted the global trading of both marine and fresh water aquatic products from China. Therefore, it is of great significance to study drug metabolism and pharmacokinetics in aquatic animals, for improving our understanding on the underlying mechanism for controlling drug residues, and thus to provide a solid foundation for solving the problem of excessive drug residues and to boost the international reputations of Chinese aquatic products.
Enrofloxacin (ENR) is a third generation synthetic quin-olone that is effective against most gram-negative and gram-positive bacteria, mycoplasmas, chlamydia and ri- ckettsia (Idowu., 2010). The majority of aquatic animal pathogens including,,andare sensitive to ENR (Bowser and Babish, 1991; Martinsen., 1992; Huang., 2019). ENR is there- fore widely used to treat aquatic animal infections (Dalsgaard and Bjerregaard, 1991; Martinsen., 1992; Bowser., 1994; Maluping., 2005; Yang, 2005). ENR can be metabolized into active product of ciprofloxacin (CIP). In recent years, residues of ENR and its metabolites were often found in aquaculture products because of the unreasonable usage of the drug. What is more serious is the increasing resistance of bacteria to these drugs that results in serious deterioration of the eco- logical environment and even threatening to human health. To ensure consumer’s food safety, many countries and regions have regulated the maximum residue limit for ENR in aquatic products. The European Union (EU) sti- pulates the maximum residue limit of ENR in muscle of finned fish for 100μgkg−1. The maxi- mum residue limit of ENR in aquatic products is also 100μgkg−1 in China.
Metabolism of drugs in aquatic animals is closely related to the administration mode and time, drug dosage, water temperature and so on. For the same drug, the metabolic timevaries with the different method and time of administration or the different dosage. Pharmacokinetics of ENR have been widely studied in fingerling rainbow, Atlantic salmon, red pacu, sea bass, seabream, Korean catfish, brown trout, allogynogenetic silver crucian carp, turbot, snakehead fish, nile tilapia and largemouth bass (Bowser., 1992; Martinsen and Horsberg, 1995; Lewbart., 1997; Intorre., 2000; Rocca., 2004; Kim., 2006; Koc., 2009; Fang., 2012; Liang., 2012; Fang., 2015; Teles., 2016; Shan., 2019). With a HPLC, Li. (2009) evaluated the concentration of ENR in tissues of carp following intravenousand orally administration. The results indicated that intravenous administration led to more rapid absorption, less retaining time and higher peak concentration than orally administration. However, intravenous administration or/and intra- peritoneal injection used in previous studies are not suitable for large-scale aquaculture practice. An oral administration with medicated feed is a more practical approach for disease control with a high fish population. The metabolism and pharmacokinetics of a drug might be greatly different depending on aquaculture species and drug administration mode.
Carp (), with its delicious meat and rich nutrition, is one of the major fish species consumed in China (Fisheries and Fisheries Administration Bureau of the Ministry of Agriculture, 2021). Therefore, the aims of this study were to develop a HPLC-MS/MS method for determination of trace levels of ENR and its major metabolite CIP in different tissues of carp, and to evaluate the pharmacokinetics of ENR, after a single oral administration at a dosage of 40mgkg−1bw in medicated feed to carp. It is expected to provide a theoretical basis for establishing the withdrawal time of ENR in a more realistic practice of fish production and a reference for the rational and standardized usage of ENR in aquaculture industry.
2 Materials and Methods
2.1 Chemicals and Reagents
Methanol, acetonitrile and-hexane were of high-perfor- mance liquid chromatography (HPLC) grade and purchased from Merck Corporation (Darmstadt, Germany). Formic acid and ammonium acetate were of HPLC grade and purchased from Sigma-Aldrich (St. Louis, MO, USA). ENRand CIP analytical standards were obtained from Dr. Eh- renstorfer GmbH (Augsburg, Germany). Anhydrous sodium sulfate was of superior pure grade purchased fromSino- pharm Chemical Reagent (Shanghai, China). A Milli-Q sys-tem (Millipore, USA) was used to provide purified water in the laboratory. ENR hydrochloride crude drug (98.0% purity) was obtained from the National Aquatic Products Quality Inspection Center (Qingdao, China).
2.2 Instrumentation and Chromatographic Conditions
Analysis of ENR and CIP was conducted with a ThermoFisher TSQ Quantum Access system equipped with an ESIsource and interfaced to a Surveyor HPLC system (ThermoFisher, USA). Data were analyzed using XcaliburSoftware,Version 2.0, after acquisition with the HPLC-MS/MS system supplemented with a Surveyor Autosampler and a MS Pump.
Mass spectrometry data were collected in positive ion mode with a Spray voltage of 4500V, a sheath gas of 12L·min−1, an auxiliary gas of 2Lmin−1and a transfer capillary temperature of 350℃. A multiple reaction monitoring (MRM) mode was applied for the analytes’ identification and quantification. The optimized parameters for the analytes and internal standards (ISs) were as follows. The quan- titative ion pair were/360/316 for ENR,/332/288 for CIP,/365/321 for ENR-D5and/340/322 for CIP-D8, and the qualitative ion pairs were/360/245 for ENR,/332/245 for CIP.
Chromatographic separation was performed on a Waters Xterra MS C18column (3.5μm, 2.1mm×150mm) (Pheno- menex, USA). Gradient elution was used with the mobile phases (A) 0.1% formic acid aqueous solution including 5 mmolL−1ammonium acetate and (B) methanol. The elution was conducted at a flow rate of 200μLmin−1as follows: 0–0.5min, 10% B; 0.5–2.0min, 10%–90% B; 2.0–5.0min, 90% B; 5.0–5.1min, 90%–10% B; 5.1–7.0min 10% B. The valve was set to direct LC flow to the mass spectrometer from 1.5 to 5.0min with the remaining LC eluent diverted to waste.
2.3 Preparation of Stock and Working Solutions
The primary stock solution of ENR, CIP and their internal standards ENR-D5and CIP-D8(1.0mgmL−1) was prepared by dissolving an accurately weighed quantity of corresponding compound in methanol, respectively. The working solution of the mixture of ENR and CIP at a concentration of 1.0μgmL−1was prepared by serial dilution of the stock solution with methanol. This mixture and further dilutions were used for spiking of carp tissue samples. The working solution of the mixture IS (1.0μgmL−1) was obtained by diluting the ENR-D5and CIP-D8stock solution with methanol. All stock solutions and working solutions were stored at 4℃and brought to room temperature before use.
2.4 Calibration Standard and QC Samples
The final concentrations of calibration standard samples were 2.0, 5.0, 10.0, 20.0, 50.0, 100 and 200ngmL−1. Quality control (QC) samples were freshly and indepen- dently prepared at 3 concentration levels (low, medium andhigh), representing the entire range of calibration. The added volume was less than 5% of the total volume of the samples in order to maintain the integrity of the matrix. The final three concentration levels of QC samples were 2, 10, 40μgkg−1for ENR and CIP, respectively. All spiked samples were stored at −20℃. Fresh calibration standard samples and QC samples were prepared each day for method validation.
2.5 Sample Preparation
Tissue samples, including 2mL plasma, 2g muscle, 2g gill, 2g skin and 1g liver, were spiked with 50μL ENR internal standard solution (1μgmL−1). After incubation in the dark for 10min, 2g anhydrous sodium sulfate was add- ed and ENR was ultrasonically extracted using 8mL acetonitrile containing 1% formic acid. The supernatant was collected after centrifugation at 4000rmin−1for 10min. Thesample was extracted two more times and the supernatants were combined. The combined extract was evaporated to dryness under nitrogen at 40℃and then re-dissolved in 1mL of the mobile phase solvent. The samples were further defatted by extracting with 2mL-hexane, then the aqueous phase was centrifugated at 14000rpm and was filtered through a 0.22μm cellulose acetate membrane. A volume of 10μL of the solution thus prepared was used for HPLC- MS/MS analysis.
2.6 Validation of the Analytical Method
The method was validated for selectivity, linearity, sensitivity, precision, accuracy, extraction recovery, and stability.
To check the potential interference of endogenous substances for analytes and IS in carp tissues, the selectivity was investigated by analyzing carp blank tissue samples (without analyte and IS) and compared with carp tissue samples spiked with IS at the concentration level of LOQ (the limit of quantification) (=6).
Linearity was assessed for ENR and CIP in the concentration range of 5–200ngmL−1at six concentration levels. The calibration curve was constructed by plotting the peakarea ratios () of the analytes to IS against the spiked concentrations of the analytes () with a 1/weighted linear least squares regression. LOQ is defined as the lowest con- centration of spiked sample with the signal/noise ratio no less than 10, and was determined by the analysis of six re- plicates of LOQ samples in three separate validation ba- tches. The accuracy of each LOQ samples should be within ±20% with a precision no greater than 20%.
The intra-daily accuracy and precision were determinedby analyzing ENR and CIP in different tissues of carp spiked with low, medium and high QC samples on one occasion. Whereas the inter-daily accuracy and precision were deter- mined by analyzing ENR and CIP in different tissues spikedwith the three concentration levels of QC samples on three consecutive separate occasions and with three separate calibration curves (one run for each day). The precision and the accuracy was expressed by relative standard deviation (RSD, %) and the relative errors (RE, %), respectively.
For the evaluation of the recoveries of ENR and CIP, different tissues of carp were spiked with low, medium and high QC concentration levels in six replicates for each level. The tissues thus spiked were then extracted, and the concentrations of the targeted analytes and IS were determined. The detected concentrations were compared with those regularly extracted QC samples to determine their recoveries, including the analytes and IS.
The stability of ENR and CIP determination in samples was studied under a variety of storage and handling conditions using low and high QC samples. For short-term and long-term stability, QC samples were exposed at room temperature for 8h and stored at −20℃ for 7d, respectively. And freeze-thawing stability was assessed by analyzing samples through three freeze-thawing cycles. These results were obtained by a comparison with the nominal values and were expressed in the relative standard deviation (s, %) ands (%).
2.7 Pharmacokinetic Study
2.7.1 Fish and acclimation
Healthy carp (1000g±50g) were obtained from a local fishery farm and kept in a flow-through water tank for twoweeks at 18℃±1℃ and were fed once every morning andevening. Oxygen content was kept close to saturated levels by bubbling air through airy stones. Neither ENR nor CIP were found in the muscle, blood, skin, gill or liver of fishes tested in the control group before the start of the experiments.
2.7.2 Oral administration of ENR
Crude drug of ENR hydrochloride was dissolved in distilled water with albumin added and was mixed into the feed. Then the feed was dried at 30℃ in an air oven dryer to a constant weight.
The fish were randomly divided into control and treatment groups. No ENR was given for the control group. For the treatment (medicated) group, ENR was administered with medicated feed at a dosage of 40mgkg−1bw. After one half-hour of the drug administration, the water was changed and the residual bait was removed. Dosed fish were fed continuously with commercial pellet feed (without ENR) the day after medication and for the rest of the experimental period. The experiments were performed at a water temperature of 18℃±1℃.
2.7.3 Sampling of fish tissues
After oral administration, six fishes were sampled from each group at 1, 2, 4, 6, 8, 12, 16, 24, 36h and 2, 4, 6, 8, 12, 16, 20, 24, 30, 40 and 80d. At each time point of sampling, approximately 5mL of blood was collected into syringes from the caudal artery of each fish and transferred to a centrifuge tube whose internal surface was covered with anticoagulant. Animals were then euthanized by concussion and muscle, liver, gill and skin were sampled. Plasma was isolated from a blood sample by centrifugationat 4000rmin−1for 10min. All samples were stored at −20℃until analysis with a HPLC-MS/MS method described above.
2.7.4 Pharmacokinetic analysis
Pharmacokinetic analysis was performed using the com- puter program Drug and Statistics (DAS version 2.0, Research Center for Clinical Drug, Shanghai University of Traditional Chinese Medicine, Shanghai, China). The pro- gram used a compartmental open model based on non-linear regression analysis to analyze the concentration-time data for tissues.
3 Results and Discussion
3.1 Method Development
3.1.1 Sample preparation
Classical extraction reagents of ENR and CIP include pure organic solvents (acetonitrile, methanol, dichlorome- thane,.), buffer solution (phosphate buffer), organic solvents with a certain proportion of acid or alkali, and acetonitrile-water or methanol-water solution. It was found that the extraction efficiency of the pure organic solvents was low. Phosphate buffer was another choice as the extraction reagent, but it was time-consuming and laborious for passing through the SPE cartridge. When the acetonitrile-water was used as the extraction reagent, it is difficult to concentrate for extracts with a higher content of protein. In view of the fact that both ENR and CIP are soluble in weak acid solution and acetonitrile has a strong tissue permeability, we expect acetonitrile with formic acid could be a good choice for the extraction solvent. For comparison, samples of blank carp liver were spiked with standard ENR and CIP solutions at a concentration level of 20μgkg−1, and extracted with different solvents. The concentrations ofENR and CIP were then determined according to the procedure described in Section 2.5 and the recoveries were calculated. The results showed that acetonitrile with 1% formic acid was easy to concentrate with an acceptable recovery (>90% in any case at this concentration level) compared with other extraction reagents (Fig.1). Furthermore, our results in Section 3.2.4 also showed that all of the recoveries of ENR and CIP for different carp tissues were satisfactory while using acetonitrile with 1% formic acid as the extraction reagent. Therefore, acetonitrile with 1% formic acid was chosen for our method development.
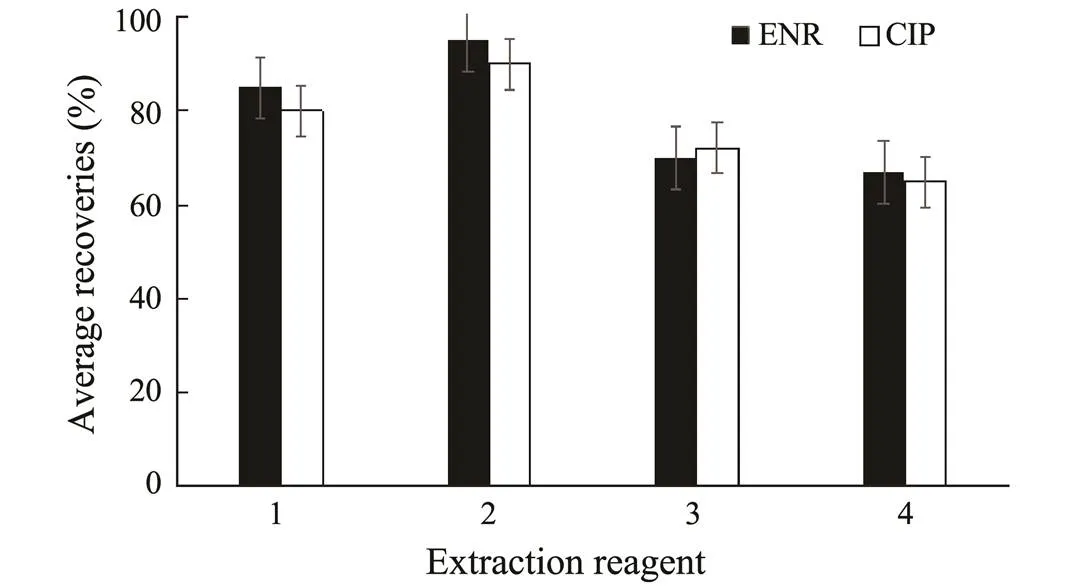
Fig.1 Averaged recoveries of ENR and CIP for carp liver samples at a spiking level of 20μgkg−1, extracted with differentreagents (n=3 for each experiment). 1, acetonitrile with 2% formic acid; 2, acetonitrile with 1% formic acid; 3, dichloromethane; 4, acetonitrile.
The addition of anhydrous sodium sulfate can effectively remove water and other impurities in the extracts. At the same time, sodium sulfate can also promote the denaturation and dispersion of proteins, to prevent the coagulation of samples for a better extraction. The defatting (removal of lipids and proteins) of the extracts was accomplished byusing-hexane after the concentration procedure, followed by centrifugation of the aqueous phase at 14000rmin−1to remove proteins and other impurities. The results showed that the purification of samples was satisfactory for the subsequent HPLC-MS/MS analysis.
3.1.2 Optimization of mass spectrometric conditions
Mass spectrometric optimization was performed by direct infusion of single analyte solutions of interest to HPLC- MS/MS. In order to optimize ESI conditions for ENR, CIPand IS, quadrupole full scans were carried out in both positive and negative ion detection modes, with a better response achieved in positive ionization. In the Q1 full scan, the protonated precursor [M+H]+of ENR, CIP, ENR- D5and CIP-D8were/360, 332, 365 and 340, respectively. Then in the MS2scan, in order to obtain the maximumsensitivity, collision energy was chosen separately for each ion product, and the ion/316, 288, 321 and 322 were selected as the quantification product ions of ENR, CIP, ENR-D5and CIP-D8, respectively. Therefore, the ion transitions monitored for quantification were/360/316 for ENR,/332/288 for CIP,/365/321 for ENR-D5and 340/322 for CIP-D8. Other parameters were optimized and shown in Section 2.2. The chromatographic run was divid- ed into two scan events, each containing a set of optimized MS parameters for the compounds of interest eluting with- in a given time period to ensure the highest sensitivity.
3.1.3 Optimization of liquid chromatographic conditions
A common and practical Waters Xterra MS C18column (3.5μm, 2.1mm×150mm) was used in our study. In order to achieve the maximum signal response and suitable retention time, the percentage of organic phase in the mobile phase at the beginning was low to ensure the retention of the analytes in the column. The retention time shortened with increasing the percentage of organic phase. In this study, methanol was selected as the organic phase due to its better selectivity compared with acetonitrile. The aqueous portion of the mobile phase was also optimized. The results showed that a good separation could be achieved by using a 0.1% formic acid solution (including 5mmol L−1ammonium acetate) as the aqueous portion of the mobile phase with gradient elution.
3.2 Validation of the Analytical Method
3.2.1 Selectivity
Typical MRM chromatograms of blank carp tissue samples (muscle, liver, gill, plasma, skin) , blank carp tissue samples spiked with ENR and CIP at LOQ levels, and the samples from carp tissues 4h after administration are recorded under the above HPLC-MS/MS conditions. The chromatograms indicate that the targets are well separated at these conditions, with retention time of 3.03min and 3.00min for ENR and CIP, respectively. The results also illustrated that no significant interference from endogenous substances were observed at the retention times of the analytes with their concentrations in blank samples far below the LOQs (determined in Section 3.2.2).
3.2.2 Linearity and LOQs
The calibration curves were validated at six levels over the concentration range of 2.0–200ngmL−1. Typical equations of the calibration curves and the correlation coefficient (2) value were as follows:

whererepresents the ratio of peak area of the analyte to that of IS, andrepresents the concentration of the analyte. Good linearity of ENR and CIP in the concentration range was observed, with a LOQ of 2μgkg−1(defined as in Section 2.6) for both ENR and CIP.
3.2.3 Accuracy and precision
Assay precision was calculated using the relative standard deviation (RSD, %). Accuracy is described as the relative deviation in the calculated value () of a standard from that of its true value () expressed as a percentage (, %). It was calculated using the formula:

The results of accuracy and precision for ENR and CIP determination are shown in Tables 1 and 2. The% was in the range of −4.67% to 2.00% for ENR and of −6.93% to −2.33% for CIP. Both the intra-daily and inter-daily precisions were pretty good with RSDs less than 15%. These results met the acceptable criteria for bioanalytical purpose.
3.2.4 Extraction recovery
As shown in Tables 1 and 2, the extraction recoveries were in the ranges of 97.4%–99.8%, 96.5%–102% and 95.3%–102% for ENR at low, medium and high levels, respectively; while they were 93.1%–97.5%, 94.0%–97.7% and 93.2%–97.9% for CIP at low, medium and high levels, respectively. These recoveries are concentration independent and are sufficiently high for a pharmacokinetics study.
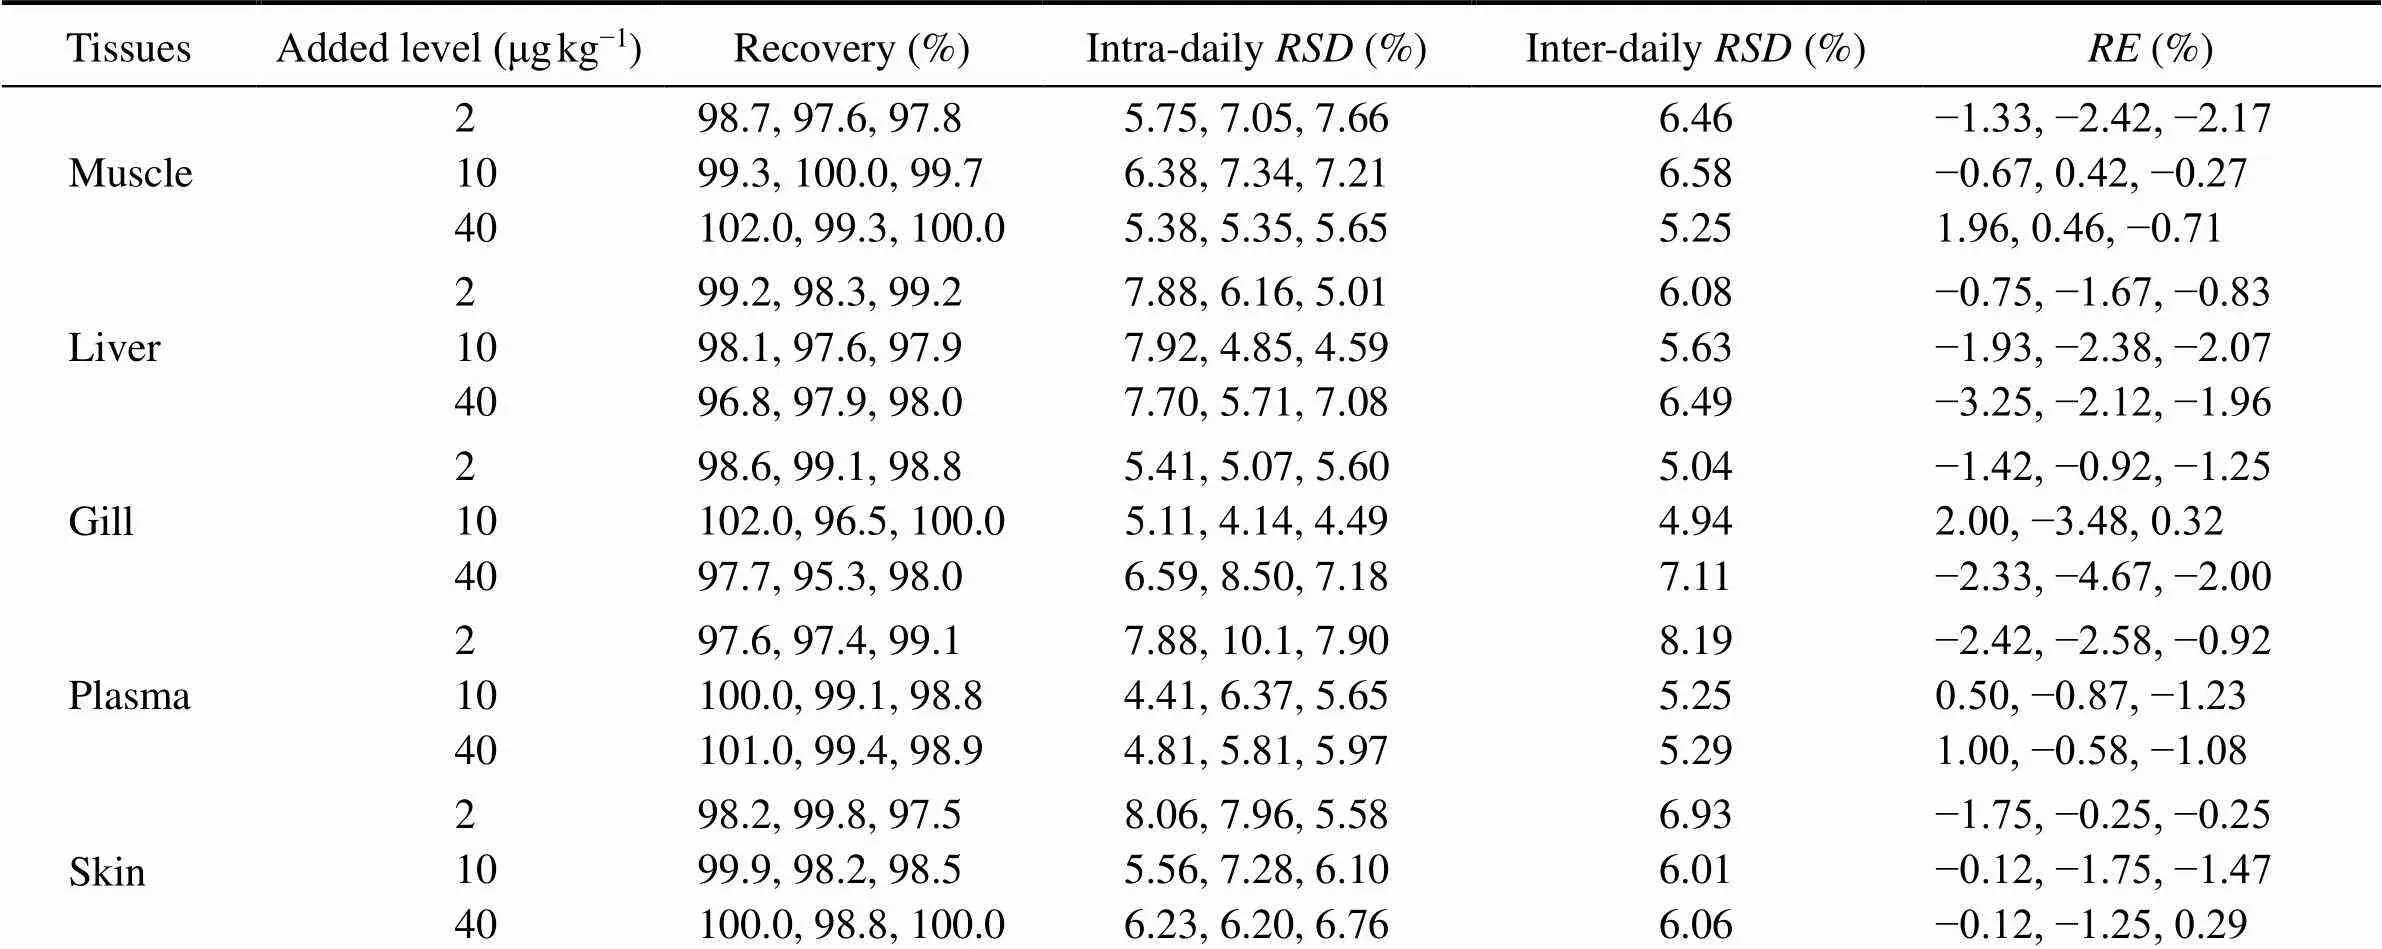
Table 1 Accuracy and precision for determination of ENR in different carp tissues

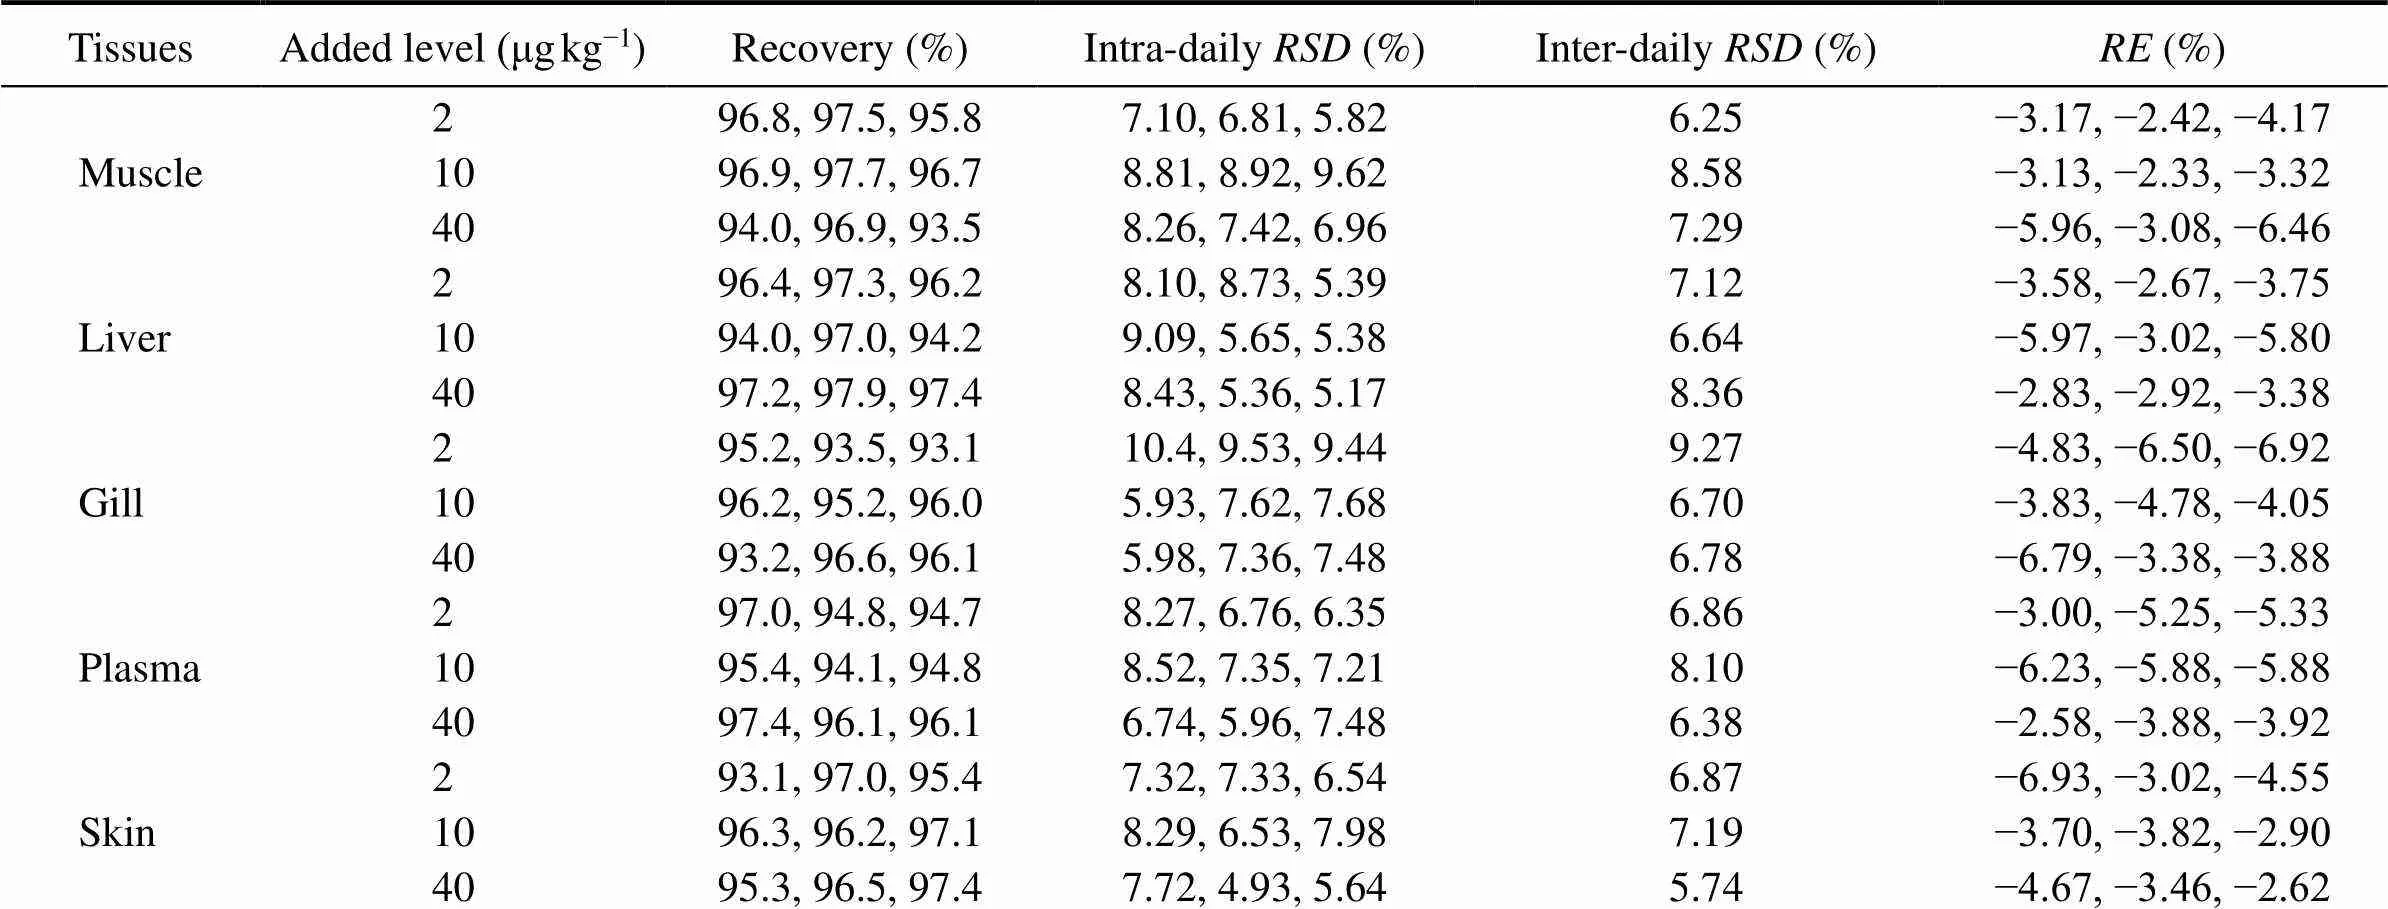
Table 2 Accuracy and precision for determination of CIP in different carp tissues
3.2.5 Stability
As can be seen in Table 3, at the three sample storage conditions tested, thes were in the range of 3.19% to 5.22% withs in the range of −4.98% to −2.25% for ENR, while thes were 4.30% to 6.20% withs in the range of −8.45% to −5.79% for CIP. These results de- monstrated that the determination of ENR and CIP in carp tissues was stable throughout various sample storage pro- cess in the experiment.
3.3 Pharmacokinetic Analysis
3.3.1 Pharmacokinetic of ENR in carp tissues
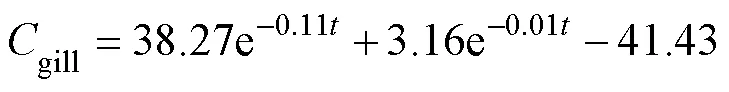
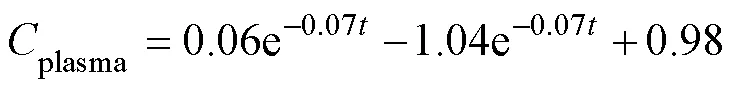
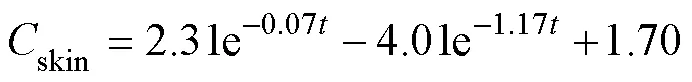
After a single oral administration of ENR to carps at adosage of 40mgkg−1bw and a water temperature of 18℃±1℃, the ENR concentration-time data from different tissues were best fit to a two-compartment open pharma-cokinetic model with first-order absorption. The pharmaco- kinetic equations were:


The absorption half-lives (1/2ka) of ENR in muscle, liver, gill, plasma and skin ranged from 0.59 to 9.35h. The distribution half-lives (1/2α) of the drug was the highest in liver and this value differs widely from the other tissues. The elimination half-lives (1/2β) of the drug ranged from 104 to 310h in the corresponding tissues (Table 4).
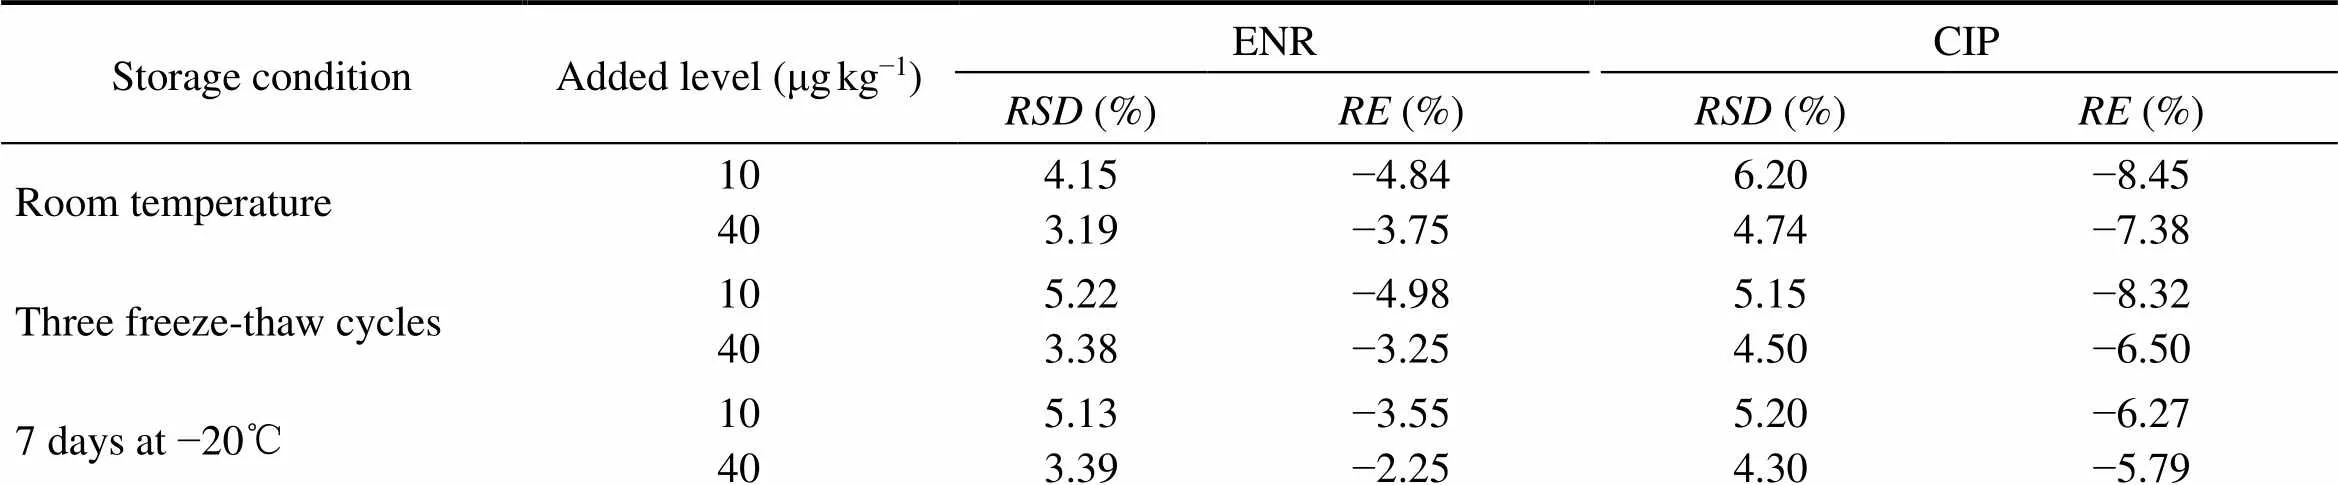
Table 3 Stability of ENR and CIP determination in samples under various storage conditions (n=6)

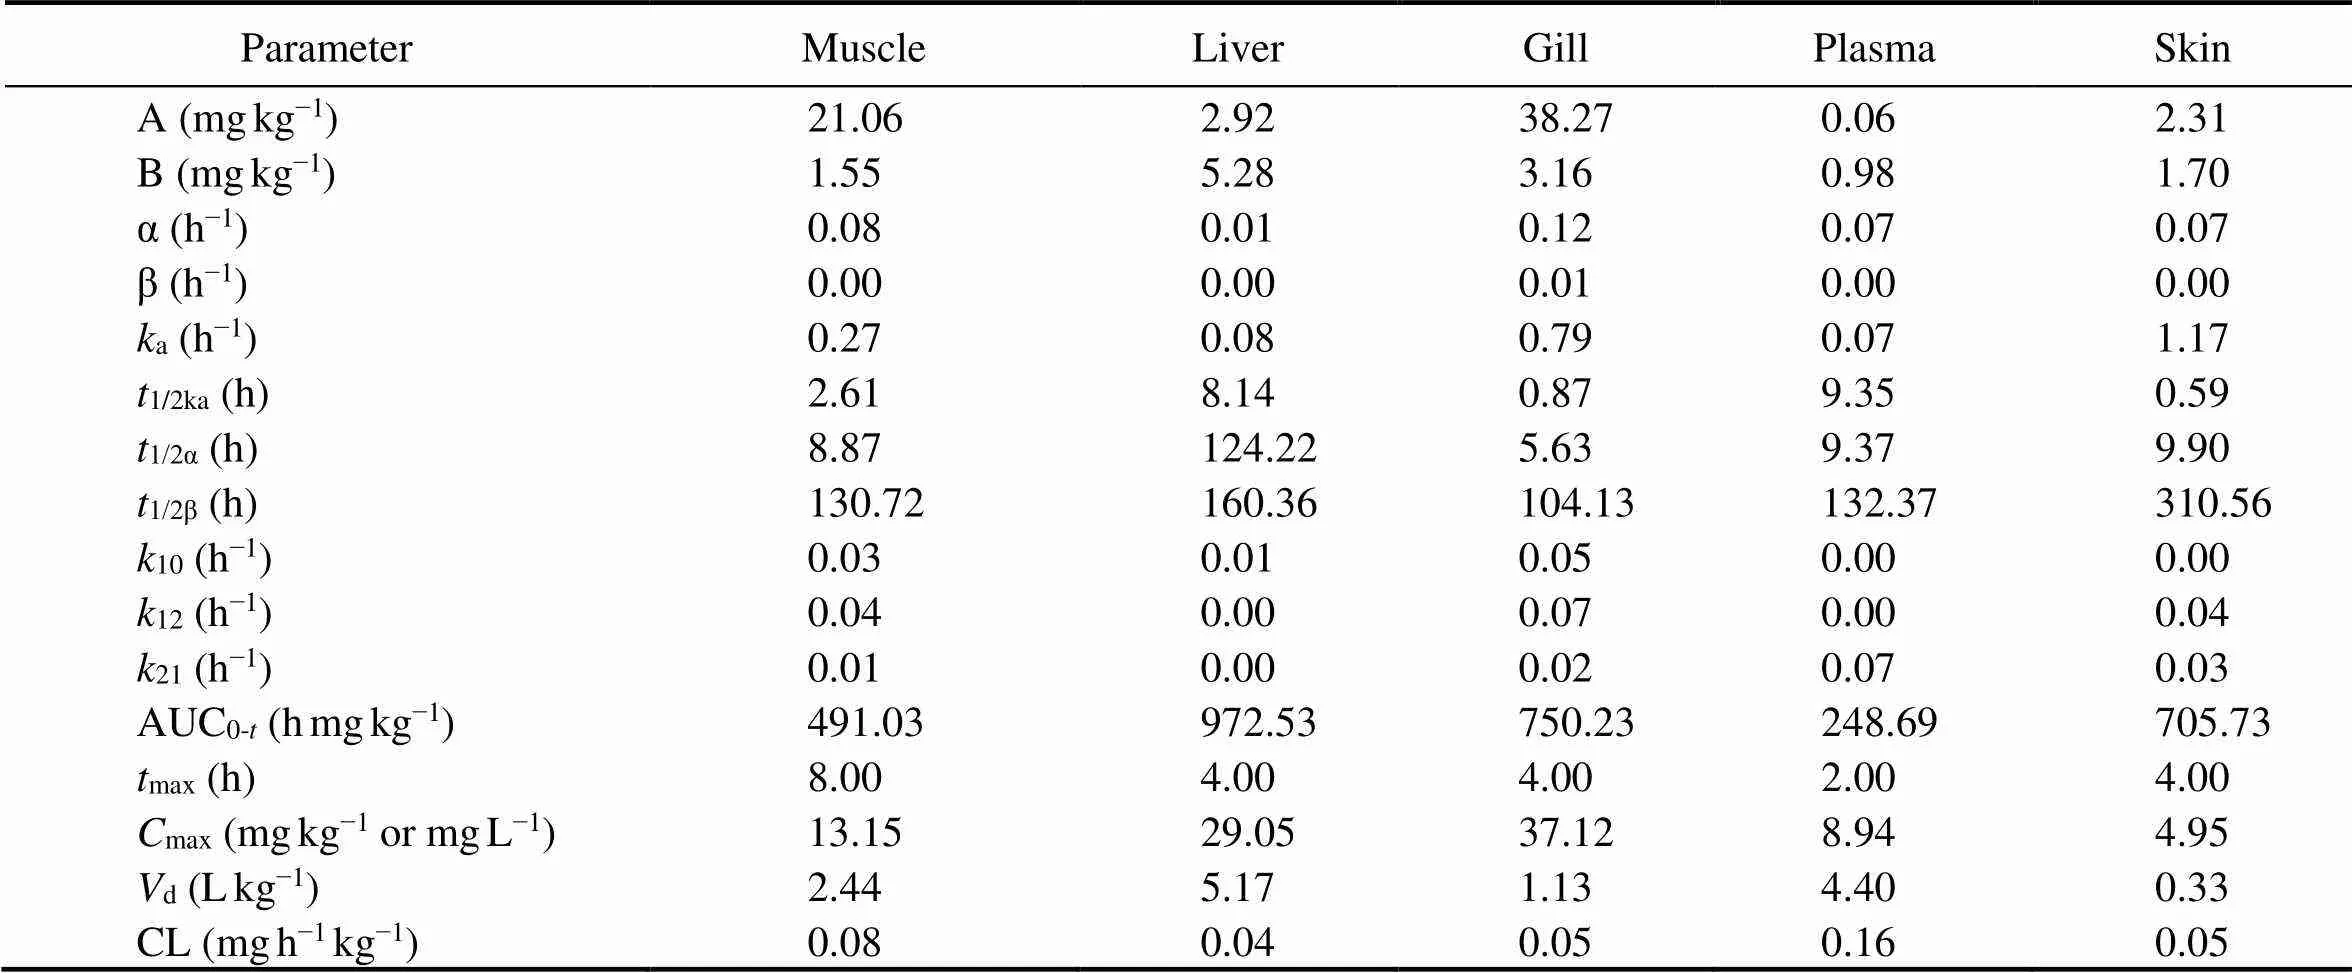
Table 4 Pharmacokinetic parameters of ENR after a single oral administration to carp at a dosage of 40mgkg−1bw and a water temperature of 18℃
Notes: A, zero-time blood drug concentration intercept of distribution phase; B, zero-time blood drug concentration intercept of elimination phase; α, distribution rate constant; β, elimination rate constant;a, absorption rate constant;1/2ka, absorption half-life;1/2α, distribution half-life;1/2β, elimination half-life;10, drug elimination rate constant from central compartment;12, first-order transport rate constant from central compartment to peripheral compartment;21, first-order transport rate constant from peripheral compartment to central compartment; AUC0-t, area under concentration-time curve;max, time to peak concentration;max, peak concentration;d, apparent distribution volume; CL, volume clearance rate.
As early as 1h after ENR administration, we could detect low levels of CIP in tissues. However, the CIP concentration-time data in plasma could not be described by a one- or two-compartment open model but by a non- compartmental model. The AUC0-tof CIP was the highest in liver with a half-life ranging from 84 to 318h, depending on the tissue. The time to peak concentration in liver was 1h, which is the shortest, indicating the metabolism of ENR to CIP in liver was the most rapid while it was the slowest in skin (Table 5).

Table 5 Pharmacokinetic parameters of CIP following a single oral administration of ENR to carp at a dosage of 40mgkg−1bw and a water temperature of 18℃
Notes: AUC0-t, area under the drug concentration-time curve from the time zero to 96h; MRT0-t, mean residue time of drug in body from zero to 576h;1/2z, half-life of the drug;max, time when maximum concentration was obtained;max, maximum concentration.
3.3.2 Concentrations of ENR and CIP in carp tissues
After a single oral ENR administration, ENR concentration level in plasma peaked at 8.94μgmL−1after 2h, and a peak concentration of 13.15mgkg−11was observed in muscle after 8h. All of the peak concentrations for liver, gill and skin occurred at 4h. The peak concentrations (max)were in the order of gill>liver>muscle>plasma>skin and the time to peak concentration (max) was the most rapid for plasma (Fig.2 and Table 4).
CIP was detected after 1h post-treatment in carp tissues at different times. However, CIP levels were significantly lower than ENR levels and the peak time was later than ENR except for liver. For an example, CIP peak concentration in muscle was 157.29μgkg−1with the peak occur- ring at 12h, while ENR peak concentration in muscle was 13.15mgkg−1with the peak at 8h (Fig.3 and Table 5).
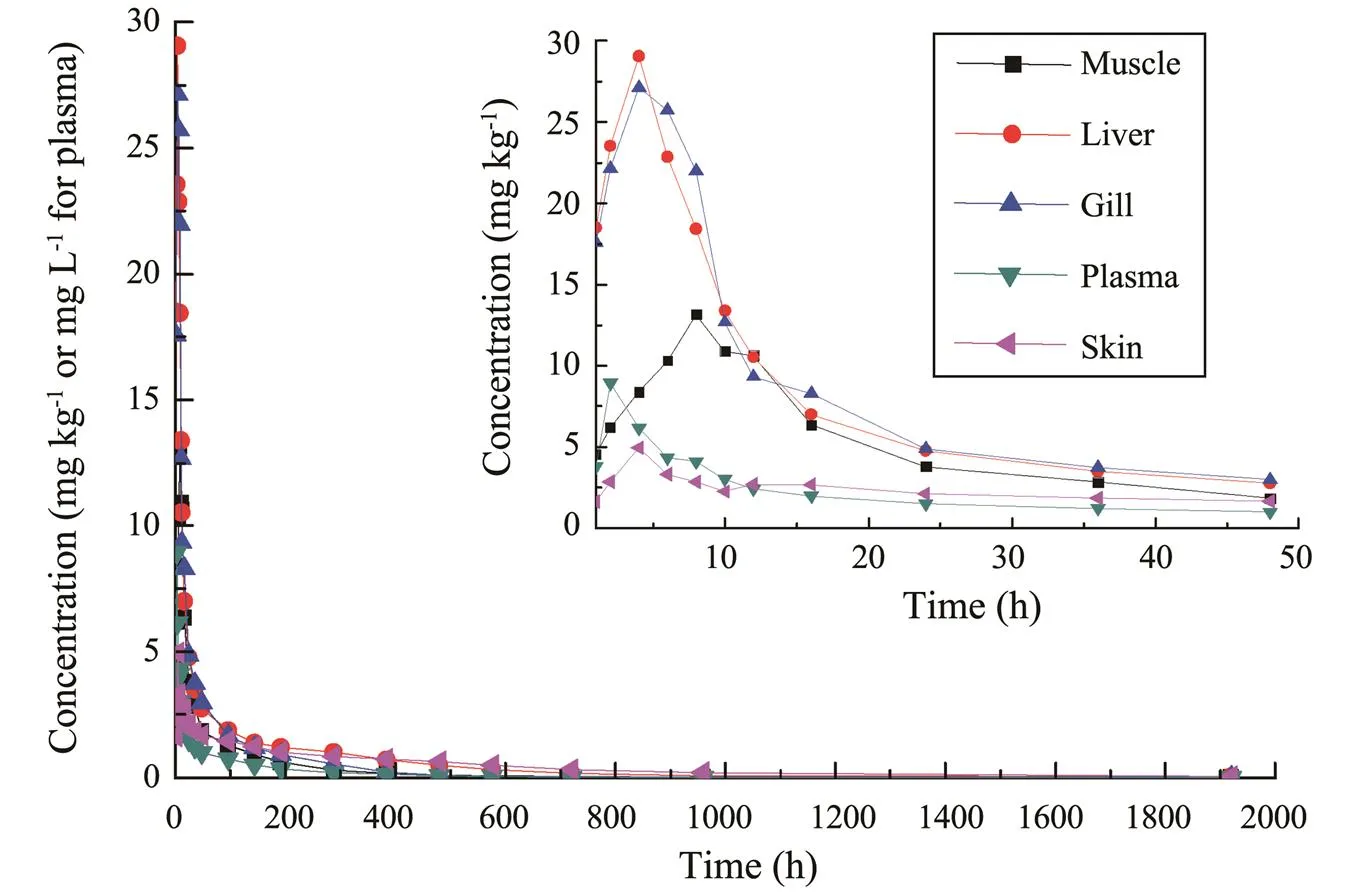
Fig.2 ENR concentration-time profiles following a single oral administration of ENR at a dosage of 40mgkg−1bw and a water temperature of 18℃ (n=6).
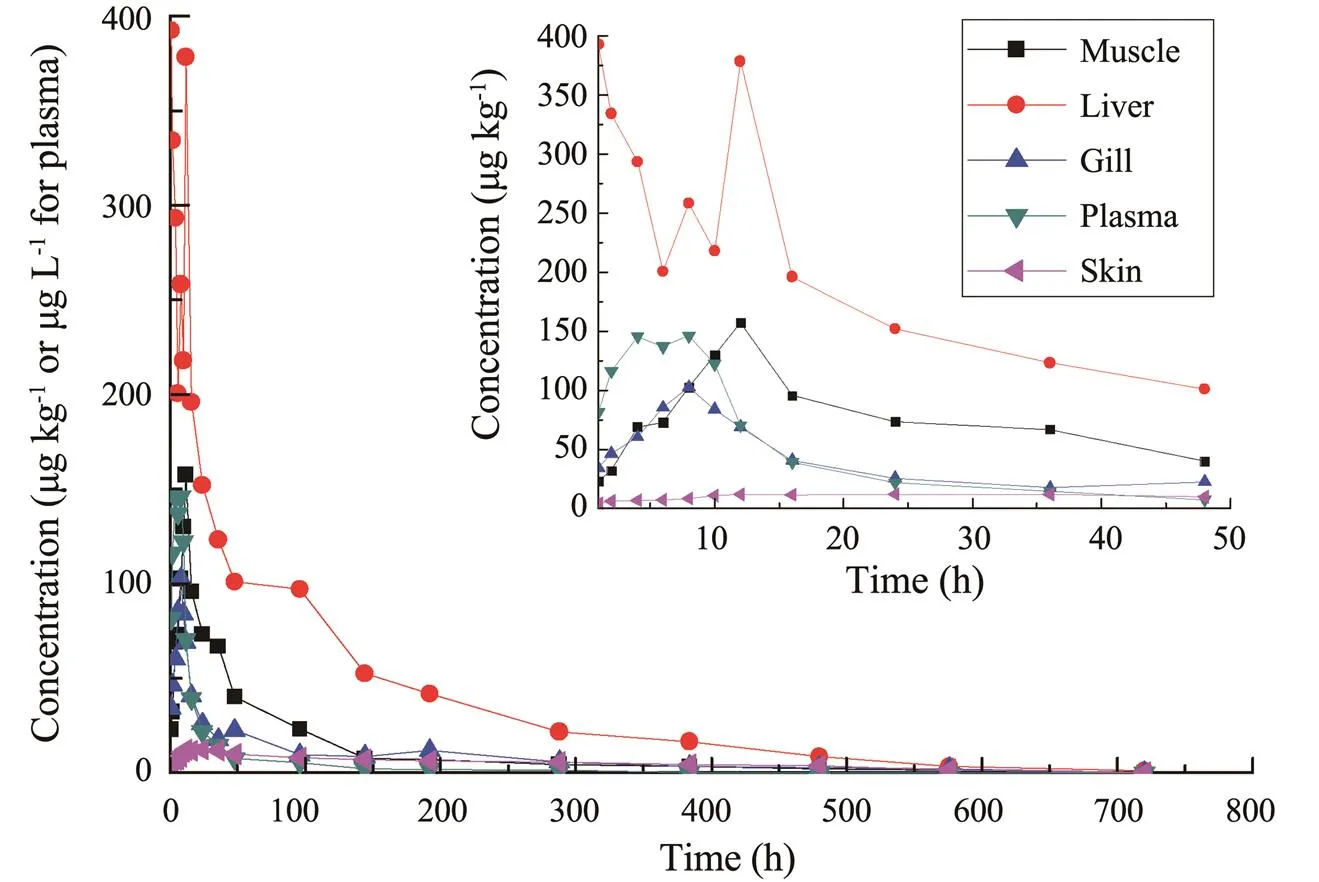
Fig.3 CIP concentration-time profiles following a single oral administration of ENR at a dosage of 40mgkg−1bw and a water temperature of 18℃ (n=6).
3.3.3 Pharmacokinetics of ENR
In plasma, the12valuewas lower than the21,indicating that ENR stayed in the central compartment longer than in the peripheral compartment. Therefore, ENR distribution (from the central compartment to the peripheral compart- ment) was slow in plasma. In contrast,12was higher than21in muscle, gill and skin, suggesting that ENR remained in the peripheral compartment longer.
The1/2βvalues were different in different tissues. It was the longest in skin, and the shortest in gill. Correspondingly,the10value in skin was the smallest and that ingill was the largest, suggesting a slow elimination rate from skin and a rapid rate from gill. We found a1/2βvalue of 132.37h in carp plasma at a water temperature of 18℃, which is similar to two other studies (Liang., 2010, 2012). But it differs from the 25h reported for seabass at 15℃, 42.1h for koi carp at 27–28℃, 161.10h for European eel at 23–25℃, 64.66h for crucian carp at 25℃ and 90.79h for largemouth bass at 28℃ (Intorre., 2000; Fang., 2007; Udomkusonsri., 2007; Fan., 2017; Shan., 2019). Water temperature affects the kinetic profile of many drugs, and a temperature increment of 1℃ corresponds to a 10% increase in the metabolic and excretory rates in fish (Bowser., 1992; Kleinow., 1994; Rigos., 2002; Huang., 2019, Luo., 2020). However, species-specific differences and altered experimental conditions may also affect this property.
After a single oral administration of ENR to carp, the highestmaxwas found in gill (37.12mgkg−1), followed byliver (29.05mgkg−1), muscle (13.15mgkg−1), plasma (8.94mgkg−1) and skin (4.95mgkg−1). This order correlates well with the primary excretory routes in the gill and liver. Themaxvalues in our study were higher than those previously reported (Fang, 2012, 2015) and maybecaused by a high feed concentration (Yang, 2005) used in this study. We found that themaxin gill and liver were 2.82 and 2.21 times higher than that in muscle, respectively, which was similar to the result reported by Liang. (2012).
The AUC is a measure of the amount of drug entering the body and is an important indicator of drug absorption in fish tissues. After ENR administration, the AUC values of ENR in carp tissues were in the order of liver>gill>skin>muscle>plasma. The AUC in carp liver was almost twice that in muscle, while that in plasma was half that inmuscle. The AUC in each tissue differs greatly at the same ENR dosage, indicating that the ENR accumulation capacity was different between carp tissues. The accumulation ability of liver was higher than any other tissues. This is similar to results previously reported for many other ani- mals indicating that most of the absorbed drugs accumulate in liver and then released slowly into the blood for peripheral distribution (Xu., 2004; Yang., 2017; Meng., 2019).
The apparent distribution volume (d) of ENR was 4.40Lkg−1 in plasma of carp after oral administration. Thecalculated values indicated an adequate distribution from plasma to peripheral compartmental tissues. Thisdvalue in carp plasma was larger than the 1.5Lkg−1found in koi carp, 2.56Lkg−1 in fingerling rainbow trout, 2.57Lkg−1 inand 2.21Lkg−1 in largemouthbass(Bowser., 1992; Fang., 2004; Udomkusonsri., 2007; Shan., 2019). However, our result was similar to those found for turbot withdvalues of 3.96 and 4.97Lkg−1after oral administration of ENR at 16 and 18℃ (Liang., 2012).
3.3.4 Metabolism of ENR
Enrofloxacin is de-ethylated to CIP in many animal species (Idowu., 2010; Fan., 2017; Luo., 2019). In terrestrial animal tissues, the corresponding AUC ratios of CIP to ENR ranged from 35% to 55% (Fang., 2007). However, in aquatic animals, the rate of transformation of ENR to CIP is significantly less. For instance, CIP in.hemolymph was detected with an AUC ratio of CIP to ENR at 1.2% (Fang., 2004). Ciproflo- xacin was also detected after intravenous and oral administration of ENR to Korean catfish with AUC ratios of CIP to ENR at 4.44% and 3.33%, respectively (Kim., 2006). In sea bass, CIP was detected occasionally in plasma at concentrations close to the LOD, while it was at concentrations significantly lower than those of ENR in liver and other tissues (Intorre., 2000). Ciprofloxacin was also found after oral administration of ENR in red pacu (Lewbart., 1997). However, CIP was not detected in serumsamples of the seabream after intravenous and oral administrations of ENR (Rocca., 2004).
In our present study, the AUC ratio of CIP to ENR in carp muscle was 1.54%, similar to that reported by Fang. (2004). We also determined CIP concentration levels in each other tissue of carp, which has not been routinely done in previously reported studies (.,Intorre., 2000; John., 2020) and may be related to the analytical method used for quantitation. The HPLC-MS/MS method used in this study allowed the simultaneous qualitative and quantitative determination of ENR and of its main metabolite CIP. This represents an advantage compared with the HPLC methods used in other studies and also possesses a higher sensitivity and selectivity.
3.3.5 Withdrawal time of ENR and CIP
The national standard of the People’s Republic of ChinaGB31650-2019 provides a value of 100μgkg−1as the maxi- mum residue limit of ENR in muscle (expressed as the total of ENR and CIP). We studied the elimination of ENR in muscle in order to determine the withdrawal time of ENR in fish products destined for consumer market. The drug concentration (calculated as the sum of ENR and CIP)in edible muscle tissue of carp was monitored, and the elimination time was then determined to be 24d when the drug concentration in carp muscle dropped to below 100 μgkg−1.
However, it should be noted that there are many factors affecting the pharmacokinetics and residue elimination times in aquatic animals, including animal species and physiological differences, drug dosage, route of administration, water temperature, salinity and pH. Among these factors, we found that water temperature is the most influential factor. The suggested withdrawal time (24d in this study) was obtained under the experimental conditions (18℃ water temperature, single bait administration at a dosage of 40mgkg−1bw). And the clinical withdrawal time should be determined according to the specific fish species and the actual breeding environmental conditions.
4 Conclusions
A rapid and sensitive HPLC-MS/MS method was developed and validated for simultaneous quantitation of ENR and CIP in carp tissues. The method was successfully applied to the pharmacokinetic study of ENR and CIP in carp after a single oral administration of ENR in medicated feed. The results revealed that ENR was metabolized mainly in the form of prototype drug after entering into the carp tissues, and only 1.54% of de-ethylation of ENR occurred. The total concentration of ENR and CIP in edible muscle tissue of carp was below 100μgkg−1after 24 days at a water temperature of 18℃.
Acknowledgement
The study was supported by the Central Public-Interest Scientific Institution Basal Research Fund, CAFS (No. 20 20TD71).
Bowser, P. R., and Babish, J. G., 1991. Enrofloxacin in salmonids., 33 (S1): 46-48.
Bowser, P. R., Wooster, G. A., and Hsu, H. M., 1994. Laboratory efficacy of enrofloxacin for the control ofinfection in rainbow trout.,6(4): 288-291.
Bowser, P. R., Wooster, G. A., St. Leger, J., and Babish, J. G., 1992. Pharmacokinetics of enrofloxacin in fingerling rainbow trout ()., 15: 62-71.
Dalsgaard, I., and Bjerregaard, J., 1991. Enrofloxacin as an antibiotic in fish.,87: 300-302.
Fan, J., Shan, Q., Wang, J., Liu, S., Li, L., and Zheng, G., 2017. Comparative pharmacokinetics of enrofloxacin in healthy and-infected crucian carp ().,40 (5): 580-582.
Fang, W. H., Yu, H. J., Cai, Y. Q., Zhou, K., and Huang, D. M., 2007. Pharmacokinetics of enrofloxacin and its metabolite ciprofloxacin in European eel () after a single oral gavage., 14(4): 622-629 (in Chinese with English abstract).
Fang, X., Liu, X., Liu, W., and Lu, C.,2012. Pharmacokinetics of enrofloxacin in allogynogenetic silver crucian carp,, 35: 209-212.
Fang, X., Zhou, J., and Liu, X.,2015. Pharmacokinetics of enrofloxacin in snakehead fish,., 39: 209-212.
Fang, X. X., Wang, Q., and Li, J., 2004. Pharmacokinetics of en- roflxacin and its metabolite ciprofloxacin in., 28: 36-41 (in Chinese with English abstract).
Fisheries and Fisheries Administration Bureau of the Ministry of Agriculture, 2021.. China Agriculture Press, Beijing, 24.
Huang, Z. Y., Fang, L. X., Song, C., Fan, L. M., Meng, S. L., Qiu, L. P.,., 2019. Antibiotic enrofloxacin in fishery: A review., 9 (11): 57-62 (in Chinese with English abstract).
Idowu, O. R., Peggins, J. O., Cullison, R., and Bredow, J., 2010. Comparative pharmacokinetics of enrofloxacin and ciprofloxacin in lactating dairy cows and beef steers following intravenous administration of enrofloxacin., 89: 230-235.
Intorre, L., Cecchini, S., Bertini, S., Cognetti, A. M., Soldani, G., and Mengozzi, G., 2000. Pharmacokinetics of enrofloxacin in theseabass ()., 182(1-2): 49-59.
John, A. G., Gregory, A. L., and Mark, G. P., 2020. Population pharmacokinetics of enrofloxacin and its metabolite ciprofloxacin in clinically diseased or injured eastern box turtles (), yellow-bellied sliders (), and river cooters ()., 43 (2): 222- 230.
Kim, M. S., Lim, J. H., Park, B. K., Hwang, Y. H., and Yun, H. I., 2006. Pharmacokinetics of enrofloxacin in Korean catfish ()., 29: 397-402.
Kleinow, K. M., Jarboe, H. H., Shoemaker, K. E., and Greenless, K. J., 1994. Comparative pharmacokinetics and bioavailabi- lity of oxolinic acid in channel catfish () and rainbow trout ()., 51 (5): 1205-1211.
Koc, F., Uney, K., Atamanalp, M., Tumer, I., and Kaban, G., 2009. Pharmacokinetic disposition of enrofloxacin in brown trout () after oral and intravenous administrations.,295: 142-144.
Lewbart, G., Vaden, S., Deen, J., Manaugh, C., Whitt, D., Doi, A.,., 1997. Pharmacokinetics of enrofloxacin in the red pacu () after intramuscular, oral and bath administration., 20: 124-128.
Li, C. Y., Li, J. C., Lu, T. Y., Wang, D., and Hou, X. L., 2009. Pharmacokinetic of enrofloxacin in carp following different ways of administration., 14 (3): 234-239 (in Chinese with English abstract).
Liang, J. P., Li, J., Zhang, Z., Wang, Q., Liu, D. Y., and Wang, J. Q., 2010. Pharmacokinetics of enrofloxacin in plasma of turbot () after a single intramuscular and oral administration., 6: 1122-1129.
Liang, J. P., Li, J., Zhao, F. Z., Liu, P., andChang, Z. Q., 2012. Pharmacokinetics and tissue behavior of enrofloxacin and its metabolite ciprofloxacin in turbotat two water temperatures., 30 (4): 644-653.
Luo, J. J., Zhang, X. Z., Song, Y., Jiang, X. Y., Lai, C. Q., Liu, C. Z.,., 2020. Metabolism and elimination of enrofloxacin and its metabolites inat different water temperature., 11 (6): 1749-1757 (in Chinese with English abstract).
Luo, J. J., Zou, R. J., Song, Y., Huang, H., Han, D. F., Li, J. W.,., 2019. Metabolism and elimination rule of enrofloxacin and its metabolites in.,36 (7): 95-103.
Maluping, R. P., Lavilla-Pitogo, C. R., DePaola, A., Janda, J. M., Krovacek, K., and Greko, C., 2005. Antimicrobial susceptibility ofspp.,spp. andisolated in the Philippines and Thailand., 25 (4): 348-350.
Martinsen, B., and Horsberg, T. E., 1995. Comparative single-dosepharmacokinetics of four quinolones, oxolinic acid, flumequine,sarafloxacin, and enrofloxacin, in Atlantic salmon () held in seawater at 10℃., 39 (5): 1059-1064.
Martinsen, B., Oppegaard, H., Wichstrom, R., and Myhr, E., 1992. Temperature-dependentantimicrobial activity of four 4-quinolones and oxytetracycline against bacteria pathogenic to fish., 36 (8): 1738- 1743.
Meng, Y., Zhu, X. H., Li, B. P., Chen, X. H., Shen, M. F., Yang, H. S.,., 2019. Residues elimination rules of enrofloxacin and its metabolites in channel catfish () under pond culture conditions., 38 (1): 97-102 (in Chinese with English abstract).
Rigos, G., Alexis, M., Andriopoulou, A.,and Nengas, I., 2002. Pharmacokinetics and tissue distribution of oxytetracycline in sea bass,, at two temperatures., 210: 59-67.
Rocca, G. D., Salvoa, A., Malvisia, J., and Sellob, M., 2004. The disposition of enrofloxacin in seabream (L) af- ter single intravenous injection or from medicated feed administration.,232 (1-4): 53-62.
Shan, Q., Wang, J. X., Zheng, G. M., Zhu, X. P., Yang, Y. H., Ma, L. S.,., 2019. Pharmacokinetics and tissue residues of enrofloxacin in the largemouth bass () after oral administration., 43 (2): 147-152.
Teles, J. A., Castello, L. C., Del, M., Pilarski, F., and Reyes, F. G. R., 2016. Pharmacokinetic study of enrofloxacin in Nile tilapia () after a single oral administration in medicated feed., 39 (2): 205-208.
Udomkusonsri, P., Arthitvong, S., Klangkaew, N., and Kusucharit, N., 2007. Pharmacokinetics of enrofloxacin in koi carp () after various routes of administration., 41(5): 62-68.
Xu, W. H., Lin, L. M., Zhu, X. B., Wang, X. T., and Kang, X. L., 2004. Residues of enrofloxacin and its metabolite in Jifuand., 23 (7): 5-8 (in Chinese with English abstract).
Yang, Q. H., AI, X. H., Liu, Y. T., Xu, N., and Zhao, F., 2017. Studies on elimination dynamics of enrofloxacin residues and its metabolites in channel catfish at two different water temperatures., 41 (4): 781-786 (in Chi- nese with English abstract).
Yang, X. L., 2005.. China Agricultural Press, Beijing, 208-209 (in Chinese).
(December 19, 2021; revised April 12, 2022; accepted July 14, 2022)
© Ocean University of China, Science Press and Springer-Verlag GmbH Germany 2023
Corresponding authors. E-mail: xinglh@ysfri.ac.cn
E-mail: lixg@ouc.edu.cn
(Edited by Ji Dechun)
杂志排行
Journal of Ocean University of China的其它文章
- The Subduction Structure Beneath the New Britain Island Arc and the Adjacent Region from Double-Difference Tomography
- Differences of Polygonal Faults with Irregularly Polygonal Geometries: A Case Study from the Changchang Sag of Qiongdongnan Basin, Northern South China Sea
- Characterization of Bacterial Communities in Aerosols over Northern Chinese Marginal Seas and the Northwestern Pacific Ocean in Autumn
- Assessment and Application of Beach Quality Based on Analytic Hierarchy Process in Yangkou Beach, Qingdao
- Role of Resuspended Sediments as Sources of Dissolved Inorganic Phosphorus Along Different Dimensions in the Subei Shoal, South Yellow Sea, China
- Histone Deacetylation Modifier Induced One New Resorcylic Acid Lactone 7′(Z)-zeaenol from the Zoanthid-Derived Fungus Cochliobolus lunatus