Role of Resuspended Sediments as Sources of Dissolved Inorganic Phosphorus Along Different Dimensions in the Subei Shoal, South Yellow Sea, China
2023-03-17WANGChangyouZHENGPingSURongguoLUOZhuhuaZHANGYuanzhiandMAOLongjiang
WANG Changyou, ZHENG Ping, SU Rongguo, LUOZhuhua, 3), ZHANG Yuanzhi, and MAO Longjiang
Role of Resuspended Sediments as Sources of Dissolved Inorganic Phosphorus Along Different Dimensions in the Subei Shoal, South Yellow Sea, China
WANG Changyou1), *, ZHENG Ping1), SU Rongguo2), LUOZhuhua1), 3), ZHANG Yuanzhi1), and MAO Longjiang1)
1) School of Marine Sciences, Nanjing University of Information Science and Technology, Nanjing 210044, China 2) Key Laboratory of Marine Chemistry Theory and Technology, Ministry of Education, Ocean University of China, Qingdao 266100, China 3) Key Laboratory of Marine Biogenetic Resources, Third Institute of Oceanography, Ministry of Natural Resources, Xiamen 361005, China
Several studies have documented that during ‘green tide’ events, comprising green macroalgae blooms in aquatic ecosystems, dissolved inorganic phosphorus (DIP) levels remain relatively steady despite the absorption of a large amount of DIP. In this study, surface sediment samples and a sediment core were extracted using a modified sequential extraction scheme, and water and surface sediment samples were analyzed in April 2017 to better understand phosphorus (P) cycling and replenishment in Subei shoal.We used a simple model on equilibrium of adsorption-desorption to present the buffering capacity of phosphate. The total P (TP) in the surface sediments ranged from 12.2 to 28.4μmolg−1(average 15.5μmolg−1) and was dominated by inorganic P. TP, exchangeable P, reactive and reductive Fe/Al bound P, and authigenic apatite P significantly decreased northward and eastward from Subei shoal, contrary to the detrital P and organic P results.Dissolved and particulate inorganic P in the water samples ranged from 0.01 to 0.54μmolL−1(average 0.19μmolL−1) and 0.9 to 19.6μmolg−1(average 4.9μmolg−1), respectively. The applied model showed that suspended particulate matter is an important regulator of DIP behavior. Thus, modification of SPM can alter the DIP buffering capacity. The calculated buffering capacity in the surface layer of the sea water was >60 within Subei shoal and always >10 alongthe path offloating, providing a reasonable explanation for the steady concentration of DIP and its replenishment during the blooming of this green macroalgae.
phosphorus; speciation; sediment; buffering capacity; South Yellow Sea
1 Introduction
Phosphorus (P) is a potentially limiting nutrient for plant growth in both fresh and marine waters, and the content of bioavailable P for autotrophic organisms determines the magnitude of primary productivity (Duan., 2009; Otten., 2012; Bartlett., 2018). Rivers are the primary carriers of mobile P from continental sources to estuaries, coastal waters, and oceans (Compton., 2000; Duan., 2009; Withers., 2009). More- over, as an element, P features strong particle activity, with a solid-liquid distribution coefficient of up to 104– 107(Santschi, 1995; Lin and Guo, 2016; Cao., 2019) in surface seawater. The allocation of P in the dissolved and particle phases plays a crucial role in controlling its abundance, speciation, transformation, bioavailability,and biogeochemical cycle.
has been the dominant green tide species for blooms in the South Yellow Sea since the summer of 2007. The biomass ofreached its highest level in 2021 compared with that observed in previous years (Zhang., 2020). Overall, thefloating biomass has increased over 100 times between 33˚–35˚N when these weeds have been floating northward (Wang., 2014; Zhou., 2015), with up to 36% ofdissol- ved inorganic phosphorus (DIP) in surface water depleted per day (Ding, 2014). In fact, a lack of replenishment from large river inputs is evident in Subei shoal and adjacent waters (Wei and Wang, 2012; Shi., 2015; Wei., 2018). Nevertheless, the concentration of DIP has exhibited small changes (Shi., 2015; Zhang., 2020). However, the primary sources of DIP leading toblooms in these coastal waters remain unclear. Subei shoal has been encroaching at the outer part but filling up at the inner part. Strong reciprocating and a large amount of loose sediments have contributed to accumulation of high loads of suspended particulate matter (SPM) in the shoal, increasing the turbidity. Consequently, the average deposition rate is an order of magnitude higher than that in the central Yellow Sea (Wang., 2005; Zhang., 2013a). The P levels in sediments and changes in P speciation are major concerns. Previous studies have demonstrated that particulate P is controlled by the settlement- resuspension process caused by the periodic changes in tidal currents (Qi, 2005; Li, 2011). Furthermore, P concentrations in the inorganic and organic pools in the waters and sediments in the South Yellow Sea as well as Haizhou Bay have been extensively studied (Cao, 2006; Zhu, 2009; Wei and Wang, 2012; Song, 2014; Wei., 2018) to evaluate the importance of P cycling in the se- diment. However, P exchange between water, SPM, and the sediment phase in Subei shoal has not been investigated. The relationship between transformation in P species and occurrence of green tide has also remained understudied.
In this study, we aimed to determine the P speciation and P exchange between water, SPM, and sediment, as well as the changes in P concentration with depth in the sediments of the Subei shoalto understand P cycling and identify the primary origin of DIP in this coastal ecosystem.
2 Materials and Methods
2.1 Description of Subei Shoal and Selection of Sampling Locations
Subei shoal is a colossal radial sand body stretching from the Yangtze River Delta up to the Sheyang River approximately 90km longitudinally and 200km in the northwest-southeast direction, with an area of nearly 30000km2. The water depth is < 15m in most parts of the shoal and approximately 20–30m at the edge. Subei shoal is characterized by intense tidal activity, complex hydrodynamic forces, loose sediments, continual high-water turbidity, high density fishing, and aquaculture (Wang., 2011; Su., 2020).
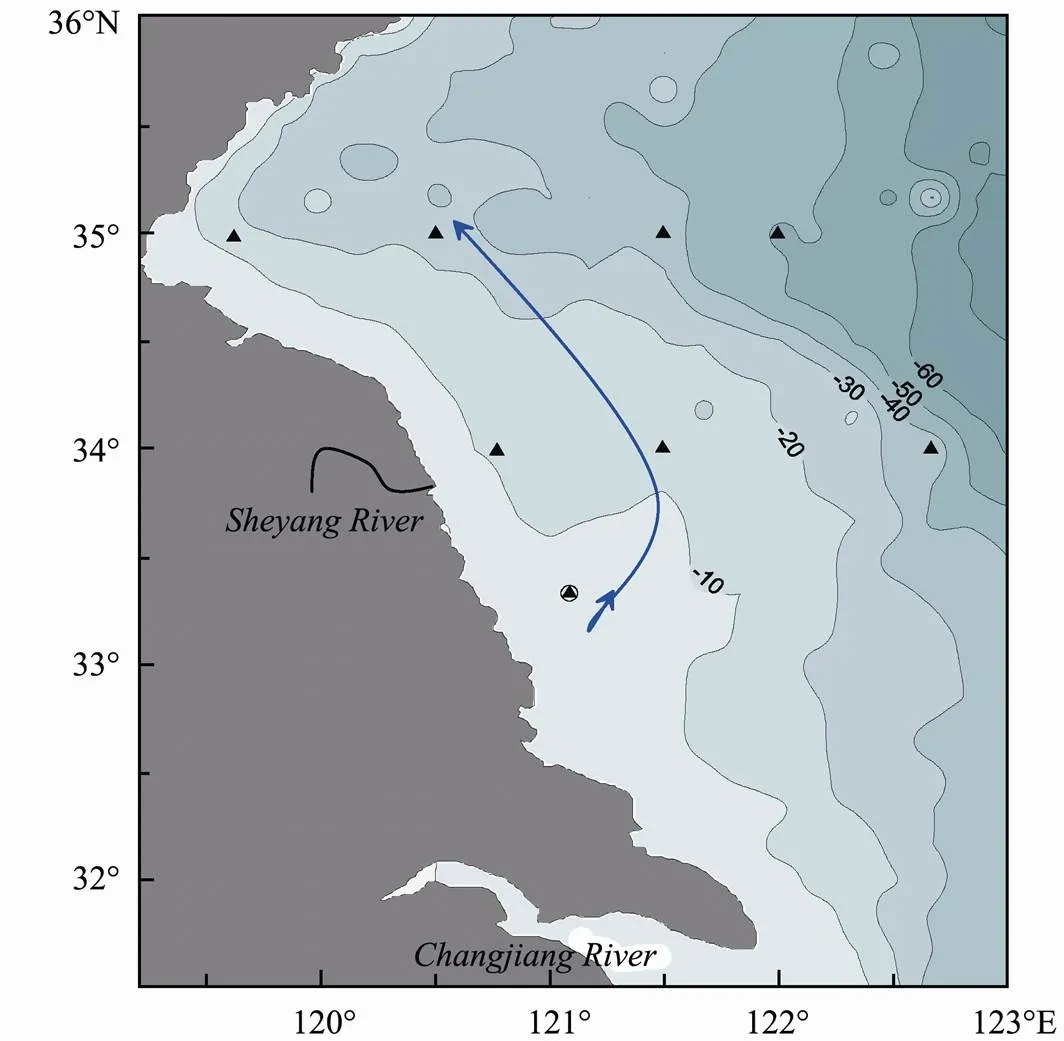
Fig.1 Map showing the sampling locations in Subei shoal and adjacent waters. ▲, sampling location for surface sediments;, sampling location for the sediment core; full line, path of floating Ulva prolifera.
The main study areas included three dimensions: the path offloating through this shoal, and the dimensions along 34˚N and 35˚N from inshore waters near the coastal area of Subei shoal to the offshore waters within the Yellow Sea (Fig.1). A sediment core was collected near the center of Subei shoal.
2.2 Sample Collection and Analysis
Seven surface sediment samples were collected with a sampler (Van Veen12.110; KC Denmark A/S, Silkeborg, Denmark) on April 17, 2017 (Fig.1). One sediment core was collected using aluminum alloy tubes (100cm long and 10 cm wide), which were inserted directly into the sediment with a vibracorer (QTZ-1; Master Machinery Co., Shandong, China). The sediment samples were stor- ed in a refrigerator at 4℃. The collected core was 33cm in length and sectioned into four layers (thickness was determined according to the content of silt and shells). The separated sediment samples were air-dried at room temperature and ground to < 250μm (Wang., 2014).
Sedimentary P speciation was extracted using a modified sequential extraction scheme (SEDEX) procedure (Ruttenberg, 1992; Wang., 2014). The sedimentary P pools separated by this technique are 1) exchangeable or loosely adsorbed P (Pex), 2) reactive Fe/Al bound P (Preac), 3) reductive Fe/Al bound P (Predu), 4) authigenic apatite plus CaCO3-bound P plus biogenic apatite (Pauth), 5) detrital apatite of igneous or metamorphic origin (Pdet), and 6) organic P (Porg). The modifications to the original SEDEX protocol included determination of the reactive Fe/Al bound P with 1.0molL−1NaOH and the washing of residue in the second step with 1molL−1NaCl instead of 1molL−1MgCl2(Wang., 2014). Total P (TP) in the sediments is the sum of all the extracted P species. Inorganic P (IP) in the sediments was obtained as the difference between the TP and Porg. All the phosphate concentrations in the extracted supernatants were determined using the phosphomolybdate blue method (Murphy and Riley, 1962). A UV-visible spectrophotometer (UV 1700; Shimadzu Co., Kyoto, Japan) with a detection limit of 0.02µmolL−1was used to measure the extracted phosphate in leachates. All leachates were diluted to the detection range in de-ionized water before measurement. The reference material (GBW07314, offshore marine sediment, China; P2O5(1480±140)μgg−1) was also sequentially fractionated and measured to verify the analytical quality. The average relative error of TP in the reference material was less than 10%. Precision was generally less than 8% based on replicate analyses.
A total of 22 water samples were collected from the surface, middle, and bottom layers at eight stations and filtered through 0.7μm Whatman GF/F membrane filters.The filters were kept frozen for the measurements of the total particulate phosphorus (TPP), particulate inorganic phosphorus (PIP), and SPM. Part of the filtrate and subsample of unfiltered water were collected in polyethylene screw cap bottles and stored at −20℃ for the measurement of DIP and total dissolved phosphorus (TDP) (Shi., 2015; Lin and Guo, 2016). Phosphate concentrations were measured using the standard molybdenum blue method (Grasshoff., 1999). SPM was determined by a dried-weight difference between the pre-weighed filter and filter samples and the filtered water volumes.
2.3 Partition and Buffering Capacity of Phosphorus in a Solid-Liquid System
The highly turbid sea water in Subei shoal emphasizes the importance of particle-water interactions. Although transformation between dissolved P and particulate P is complex, the adsorption and desorption processes are rapid, occurring within minutes to hours (Froelich, 1988). Thus, interactions between the resuspension of sediment and dissolved P can be simplified to an adsorption-de- sorption process.
It can be assumed that a particle with abundant exchangeable sites can bind with a phosphate ion to form surface complexes and almost instantaneously reach equilibrium with the concentration of dissolved P (Prastka., 1998). The partitioning of P between dissolved and particulate phases, expressed as the stability constant (K), can be calculated to quantify its particle reactivity (Lin and Guo, 2016), as shown in Eq. (1):
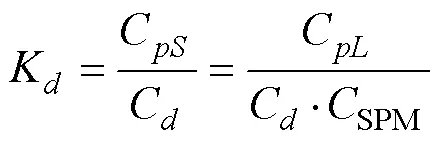
whereC(orC) is the concentration of inorganic, organic, or total P in µmolg−1(or µmolL−1) in the particulate phase;Cis the concentration of dissolved P in the inorganic, organic, or total P pool (µmolL−1); andSPMis the concentration of SPM (gL−1). Thus, the dimension ofKis Lg−1.
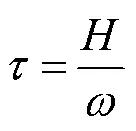
According to the steady state principle, the amount of resuspension of sediment is equivalent to that of particle deposition and accounts forpercent of the SPM (SPM). Note that theSPM(gL−1) is conservative.(h−1) can then be calculated by the inverse of the residence time of resuspension of sediment(h), andcan be estimated by the SPM settling velocity(mh−1) and water depth(m), as expressed by Eq. (2):
The settling velocity(mh−1) can be estimated with the empirical formula (Einstein and Krone, 1962; Zhu., 2020) shown in Eq. (3):

whereandare empirical coefficients with values of 16.9 (m Lmh−1g−m) and 1.59, respectively (Einstein and Krone, 1962; Zhu., 2020).
The resuspended sediment had a phosphorus concentration ofsed(μmolg−1). The initial equilibrium concentrations of dissolved and particulate P wereC0(μmolL−1) andC0(μmolg−1), respectively. After time(h), the final equilibrium concentrations of P in the dissolved and particulate phase wereC(μmolL−1) andC(μmolg−1), respectively. Assuming that the equilibration reaction occurred after time, the concentration of DIP, particulate P, and resuspended sedimentary P is sharply equal to the sum of the concentrations of DIP, particulate P, and deposited particulate P. In such case, the mass balance equation can be expressed by Eq. (4):
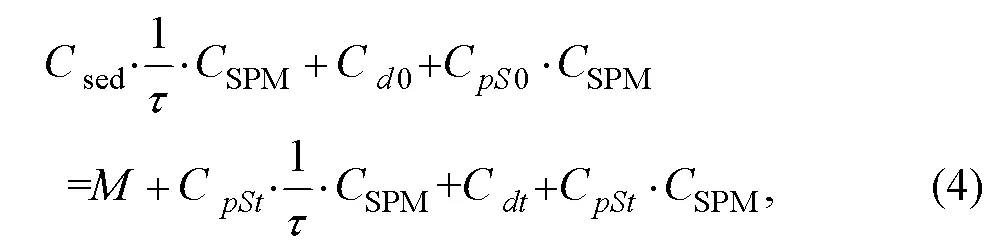
where(μmolL−1) is dissolved P absorbed by phytoplankton. As rapid equilibrium could be established,is >>. Eqs. (1)–(3) were substituted into Eq. (4), causing the terms involvingC0andCto collect on the right. This yielded Eq. (5):
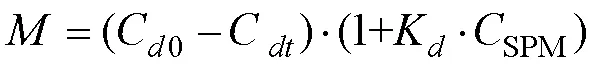
For highly turbid waters,KCSPM>>1, in whichcan be formulated as follows:
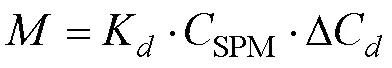
Indeed, ΔCis exceedingly small whenSPMis sufficiently high. Thus, Eq. (7) can be used to rationalize the steady concentration of DIP during green tide in the Yellow Sea.
represents the amount of phosphate removed from a steady particle-water system and can be used to quantify the buffering capacity of the system. Herein, the buffering capacity of P in a solid–liquid system is defined as the number of moles of phosphate desorbed from the solid phase when reducing dissolved P in 1 L of sea water by one unit, and can be expressed as:
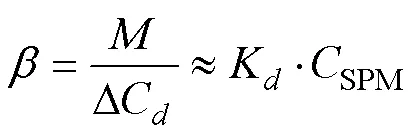
whereis the buffering capacity, representing the ability of the particle-seawater system to withstand changes in the concentration of DIP. Eq. (8) stems from the equilibrium of adsorption-desorption and shows that SPM is an important regulator of P transformation. Hence, the modification of SPM can change the DIP removal capacity. Moreover,can be used for rationalization of the disparate patterns of P behavior in the Subei shoal and adjacent waters.
3 Results and Discussion
3.1 Phosphorus Speciation in the Core Sediment and Their Significance to DIP
The depth profiles of the sediment core TP with the subsequently extracted sedimentary P fractions are shown in Fig.2. The TP concentrations ranged from 26.8 to 28.4 μmolg−1and generally decreased slightly with depth in Subei shoal. These estimates were higher than those in the adjacent sea area (Cao, 2006; Zhu, 2009). Significant inning flat areas of land within Subei shoal were initially documented for marine agricultural purposes 100 years ago (Zhang., 2013a; 2013b). The seaweed breeding area has grown rapidly since 2007 (Su., 2020), and seaweed breeding has also expanded rapidly thereafter. The coastal deposition rate in Subei shoal is approximately 3.1–3.3cma−1(Wang., 2005). The depth of that core corresponded to about 10 years prior to 2017 (.., about 2007) given this sedimentation rate.
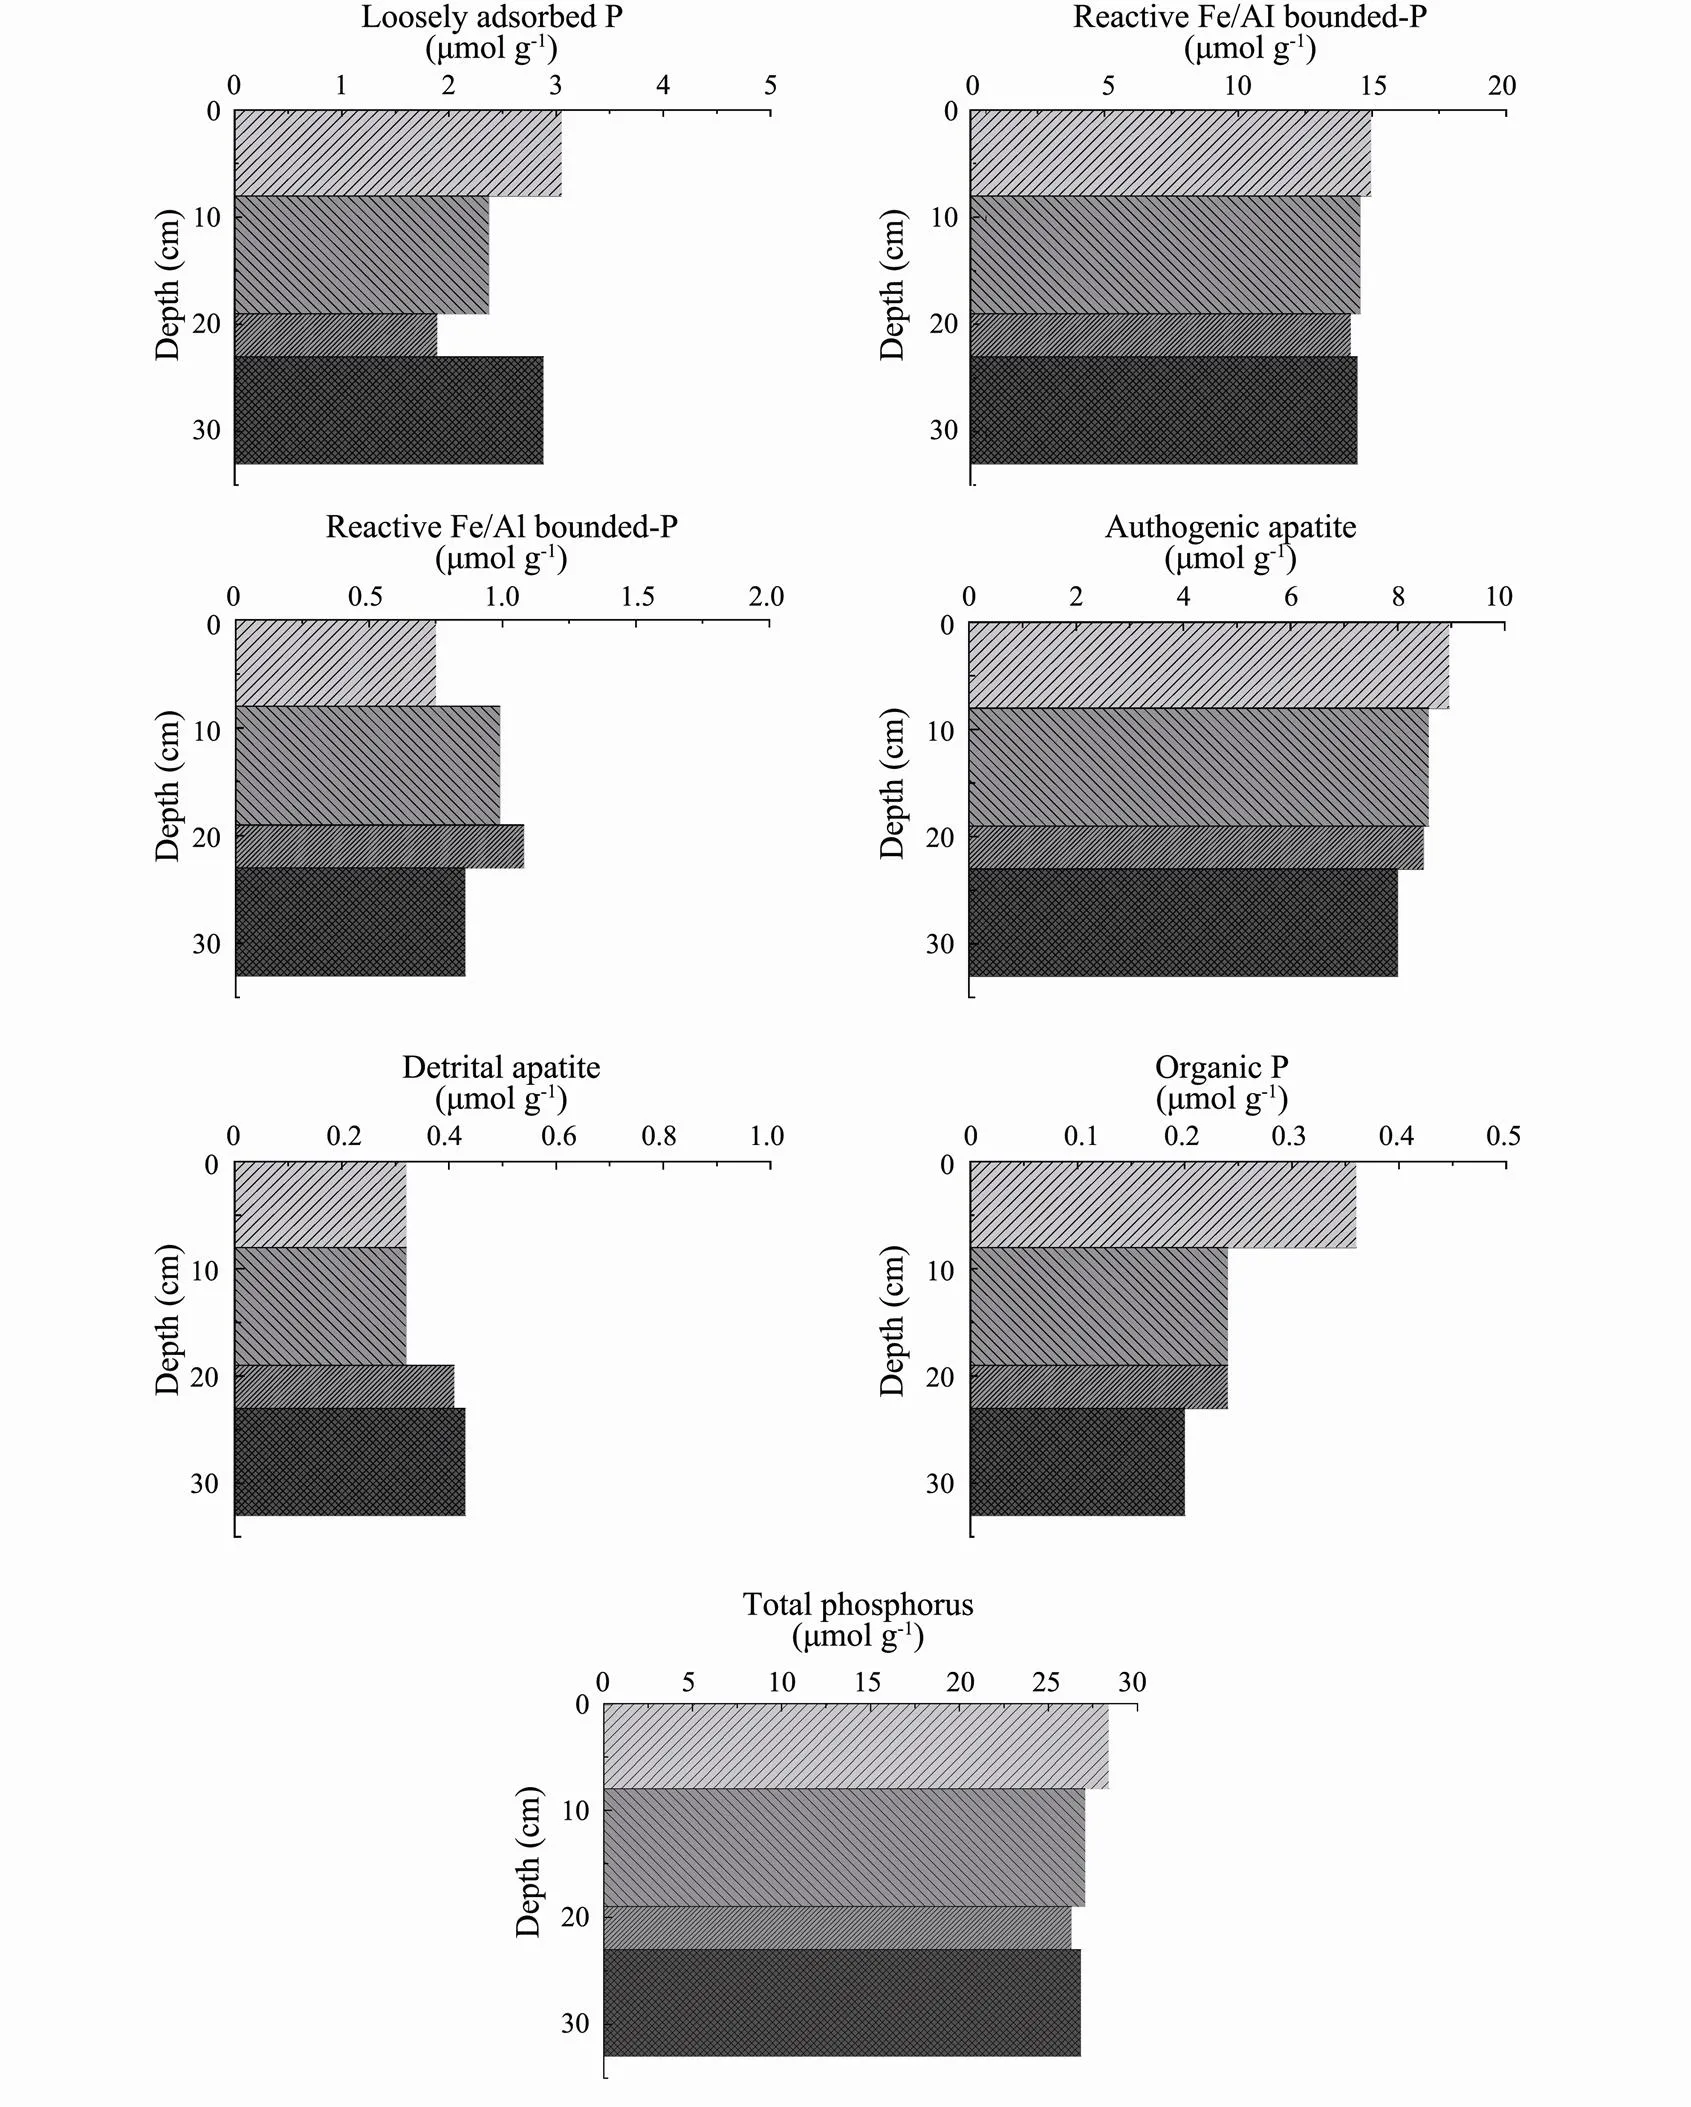
Fig.2 Solid-phase profiles of phosphorus (P) (μmolg−1) as determined with the extraction procedure: exchangeable or loosely adsorbed P, reactive Fe/Al bound P, reductive Fe/Al bound P, authigenic apatite plus CaCO3-bound P plus biogenic apatite, detrital apatite of igneous or metamorphic origin, organic P, and total phosphorus for the sediment sampled in Subei shoal.
The Pexconcentrations varied from 1.9 to 3.1μmolg−1in Subei shoal and usually represented <11% of the TP, which was higher than the proportions of Pex(usually < 8% of the TP) previously observed in bays and continental shelf sediments (Dai., 2006; Monbet., 2007). The depth profile of Pexwas characterized by a minimum concentration of 1.9μmolg−1in the 19–23cm sediment layer, followed by a substantial increase to 2.9μmolg−1in the 23–33cm layer. This pattern is similar to the usual profile with up and bottom sources, which is dominated by adsorption and desorption processes and presents a minimum concentration in the middle layer of sediment. In Subei shoal, the relatively high Pexconcentrations could quickly release into the water to balance the phosphate in the water and solid phases, which play an important role in the influence of particles on the DIP of water. Therefore, the strong resuspension of surface sediment and the concentration of SPM contribute to the stability of DIP in this sea area. Moreover, the relatively high Pexconcentrations in the sediment core revealed that there is a repository of bioavailable P in the Subei shoal since 2017.
In Subei shoal, Preacconcentrations have always constituted a major proportion of the TP pool (up to 53%– 54% of the TP). These concentrations varied in a narrow range of 14.2 to 15.0μmolg−1, thus confirming the origin from terrigenous sources and the reciprocating settlement-resuspension process (Qi, 2005; Dai., 2006). Moreover, the Preacconcentrations remained essentially the same with depth, similar to the TP profile. This can be explained by the re-deposition of the resuspended sediments from the delta of the ancient Yellow River (Li, 2011), as Preacis an index of terrigenous formation (Dai., 2006; Wang., 2014). This explanation can be supported by the distribution of SPM, which increased vertically with increasing depth and decreased horizontally at the bottom (Fig.3). As associated with Al, Fe, and Mn oxyhydroxides, the release of Preacis usually attributed to the amounts of the poorly crystalline ferrihydrite and akageneite and the reduction of Fe oxides (Slomp., 1996; Ruban., 1999; Monbet., 2007).
We further reported that Preduwas relatively low in this sediment, with the Preduconcentration ranging from 0.8 to 1.1μmolg−1and representing 3%–4% of the TP. Preduremained relatively constant in the sediment layers, as Preduis the form of phosphate coated with Fe oxyhydroxides and is usually transported by rivers from catchment areas (Petersen and Corey, 1966; Nguyen, 2000). This may be attributed to the lack of large riverine inputs of Preduin Subei shoal and adjacent waters. The concentrations of Pauthranged from 8.0 to 9.0μmolg−1and were responsible for 30%–32% of the TP in the sediment core. There was a slight decrease in the Pauthconcentration with depth, following a concomitant decrease in the shell content. CaCO3-associated P, biogenic apatite, or carbonate fluo- rapatite are the main forms of Pauthin sediment (Ruttenberg, 1992). Furthermore, Pdetranged from 0.3 to 0.4 μmolg−1and constituted 1%–2% of the TP, including P of igneous and metamorphic origin bound to apatite (Wang., 2014). Porgranged from 0.2 to 0.4μmolg−1and represented the lowest fraction of the TP, with percentages ranging from 0.7% to 1.3%. The depth profile of Porgexhibited a decrease with depth, similar to that of TP.
3.2 Distribution of Phosphorus Speciation in Surface Sediment Within the Subei Shoal and Adjacent Waters
TP concentrations in surface sediment within Subei shoal and adjacent waters ranged from 12.2 to 28.4 μmol g−1and considerably decreased northward and eastward from Subei shoal (Fig.4). The average concentrations of Pex, Preac, Predu, and Pauth, were 1.0, 2.7, 0.5, and 2.3 μmol g−1, respectively, and constituted 6%, 17%, 3%, and 15% of the TP in the surface sediments, respectively. The distribution patterns of Pex, Preac, Predu, and Pauthgenerally decreased with distance, similar to those of SPM and TP (Figs.3 and 4). Moreover, the concentration of SPM exhibited substantial changes in the Subei shoal and adjacent waters, ranging from 16.6 to 1058.0mgL−1. The product of PexandSPMcan be used as a potential inventory of phosphate releasing into water. Such calculation abilities for phosphate release from SPM varied considerably, ranging from 0.008 to 2.0μmolL−1, with the highest value in Subei shoal. However, Pdetin the surface sediment showed an inverse pattern as the concentrations increased with distance from Subei shoal, with an average of 7.6 μmolg−1accounting for 49% of the TP. The pattern of Porgwas similar to that of Pdet; however, the concentration averaged only 1.4μmolg−1and constituted 9% of the TP.
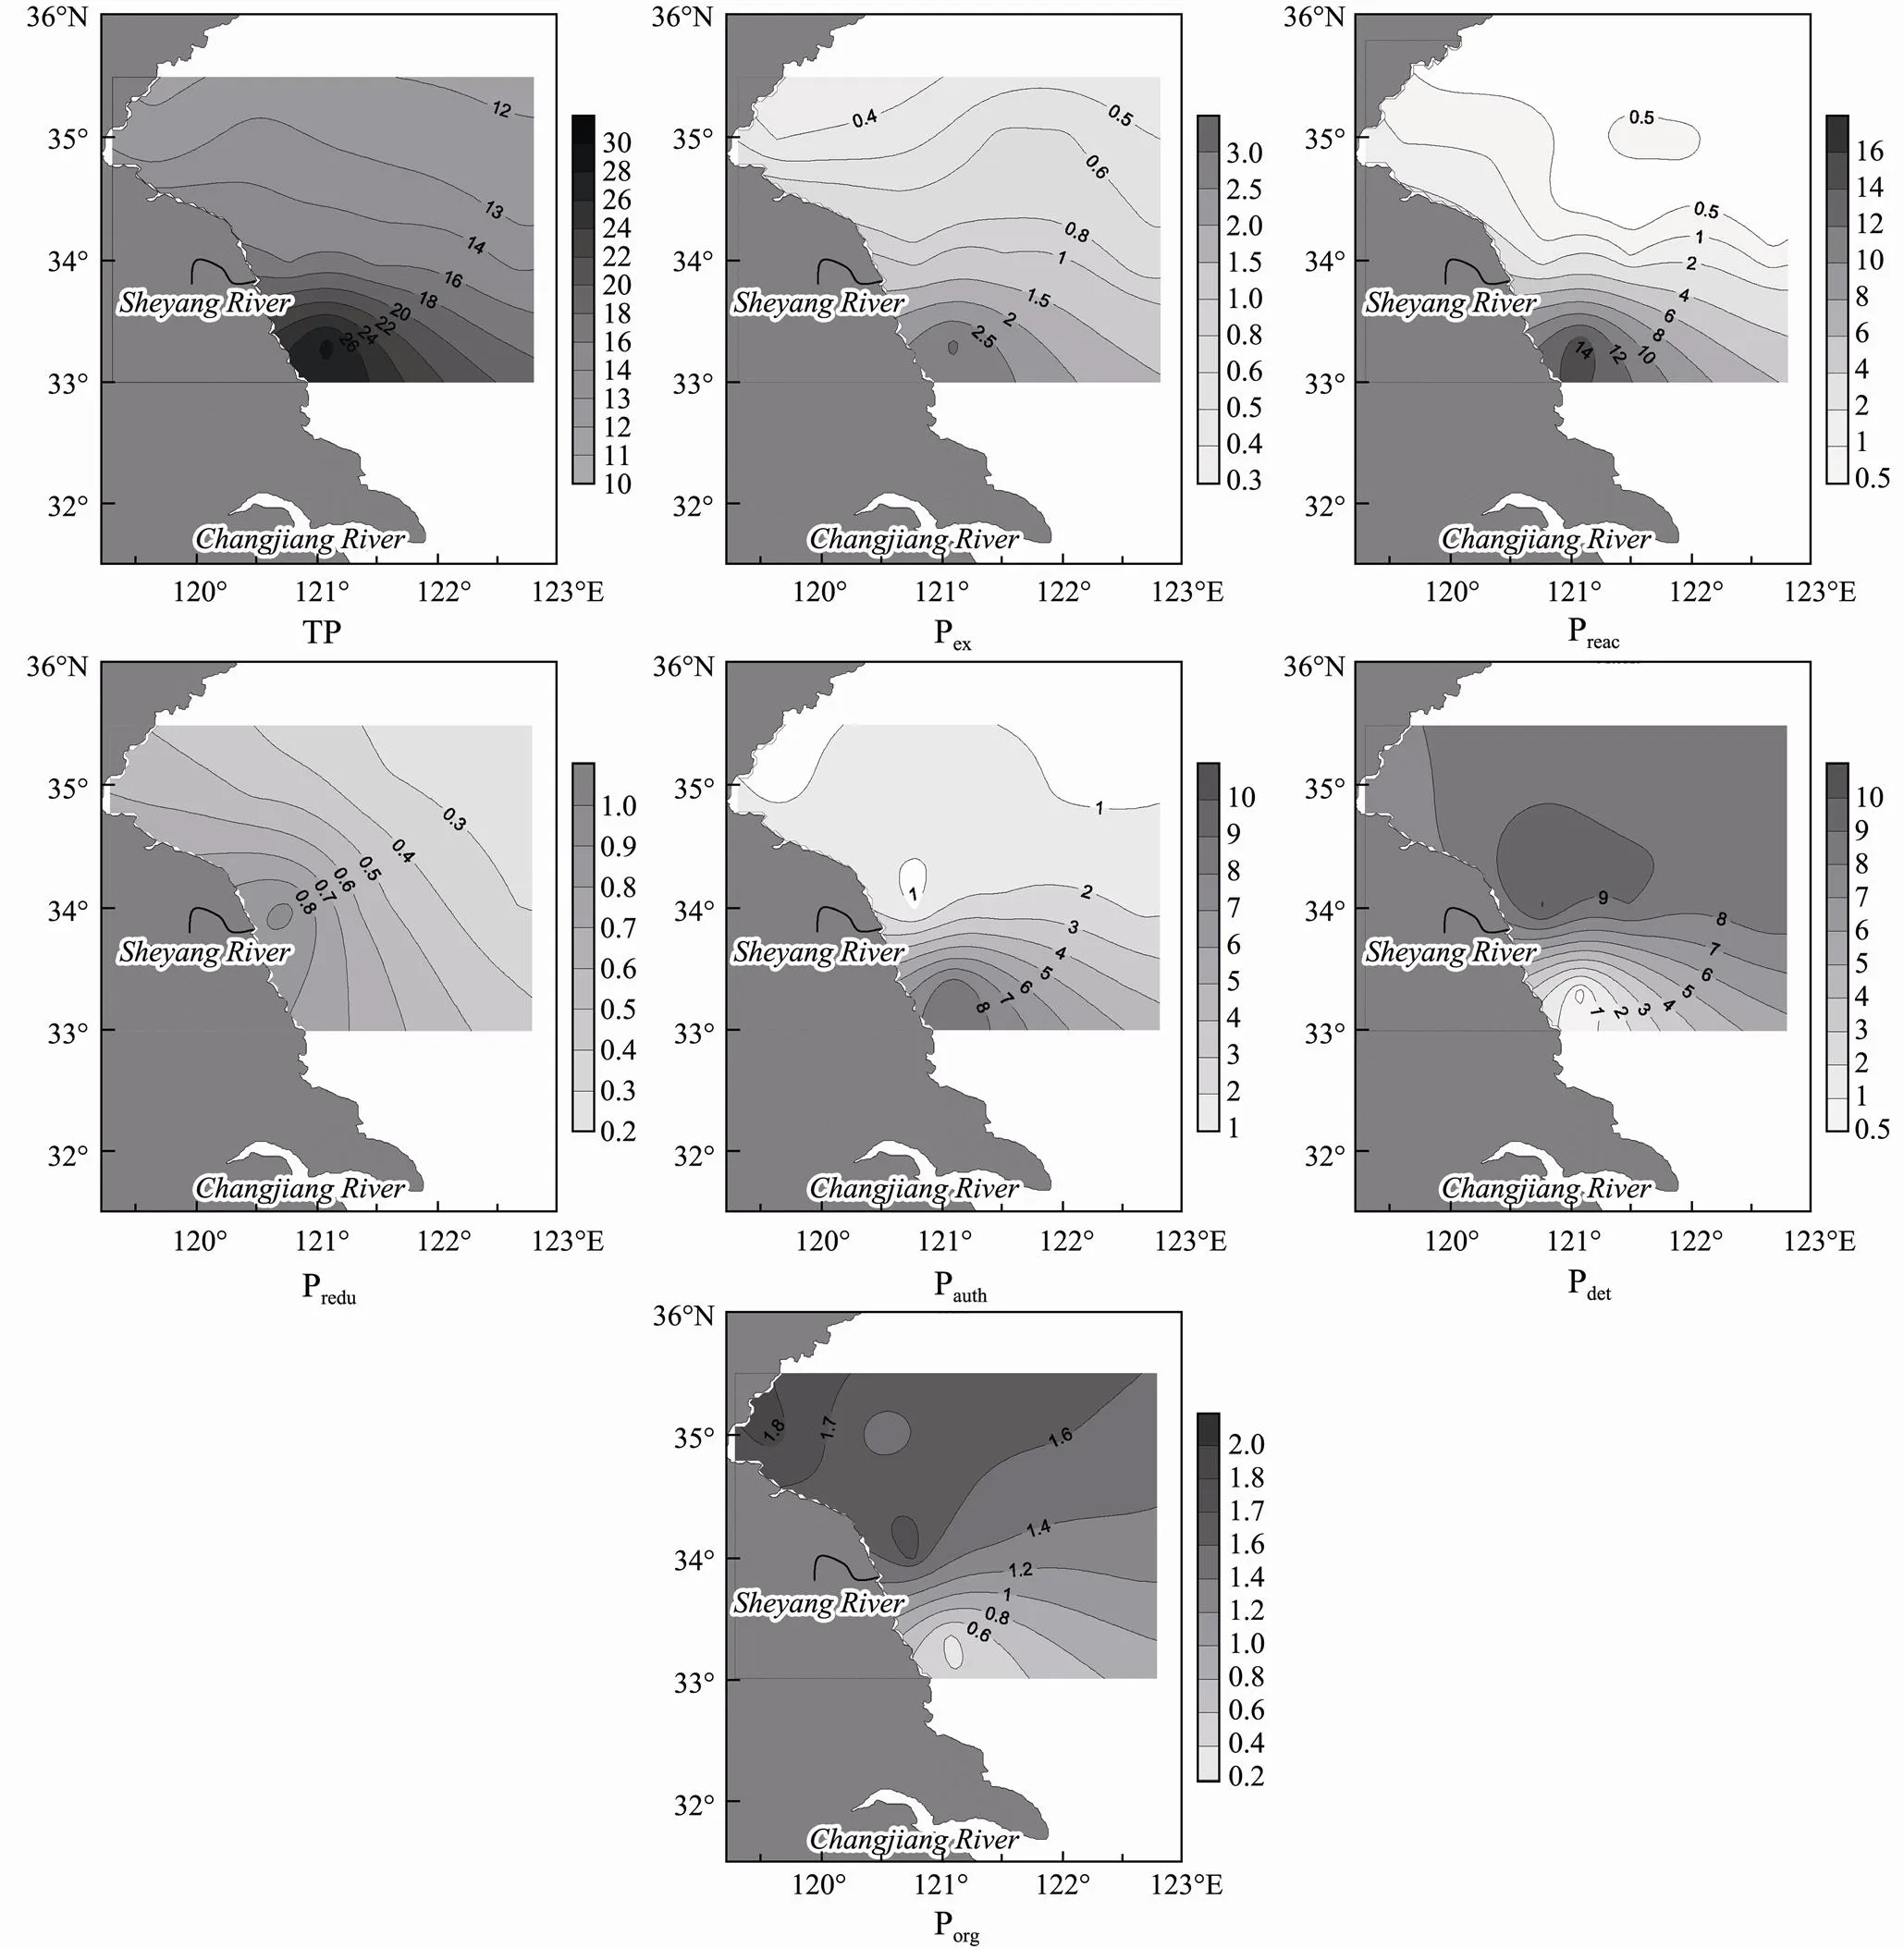
Fig.4 Distribution of sedimentary phosphorus (P) (μmolg−1) as determined with the extraction procedure: exchangeable or loosely adsorbed P, reactive Fe/Al bound P, reductive Fe/Al bound P, authigenic apatite plus CaCO3-bound P plus biogenic apatite, detrital apatite of igneous or metamorphic origin, organic P, and total phosphorus for the sediments sampled in Subei shoal.
3.3 Profile of IP in Solid Phase Within Subei Shoal and Adjacent Waters
Due to the strong mix influence of waves and the resulting vertical uniformity in SPM concentrations (Fig.3), the variations in PIP concentrations with depth were generally small in the direction offloating northward. However, these concentrations increased from 2 to 10μmolg−1with increasing distance from Subei shoal (Fig.5). IP in the surface sediment gradually decreased from 25 to 14μmolg−1in the same dimension. Moreover, the difference between PIP and IP in the surface sediment along the path ofchanged dramatically (average 4–23μmolg−1). Such large differences would lead to a huge(amount of P removed from the particle–water system according to Eq. (5)), up to 0.1–71μmolL−1when reducing the DIP in 1L of sea water by 0.01μmol. This finding confirms that a large amount of P was released from the particle to water phase when SPM in Subei shoal was 100–1000mgL−1and almost came from resuspension of surface sediment (Qi, 2005; Li, 2011). These results also indicate that the resuspension of sediments sustained the high primary production in this coastal area, such as green tide in conjunction with floating.
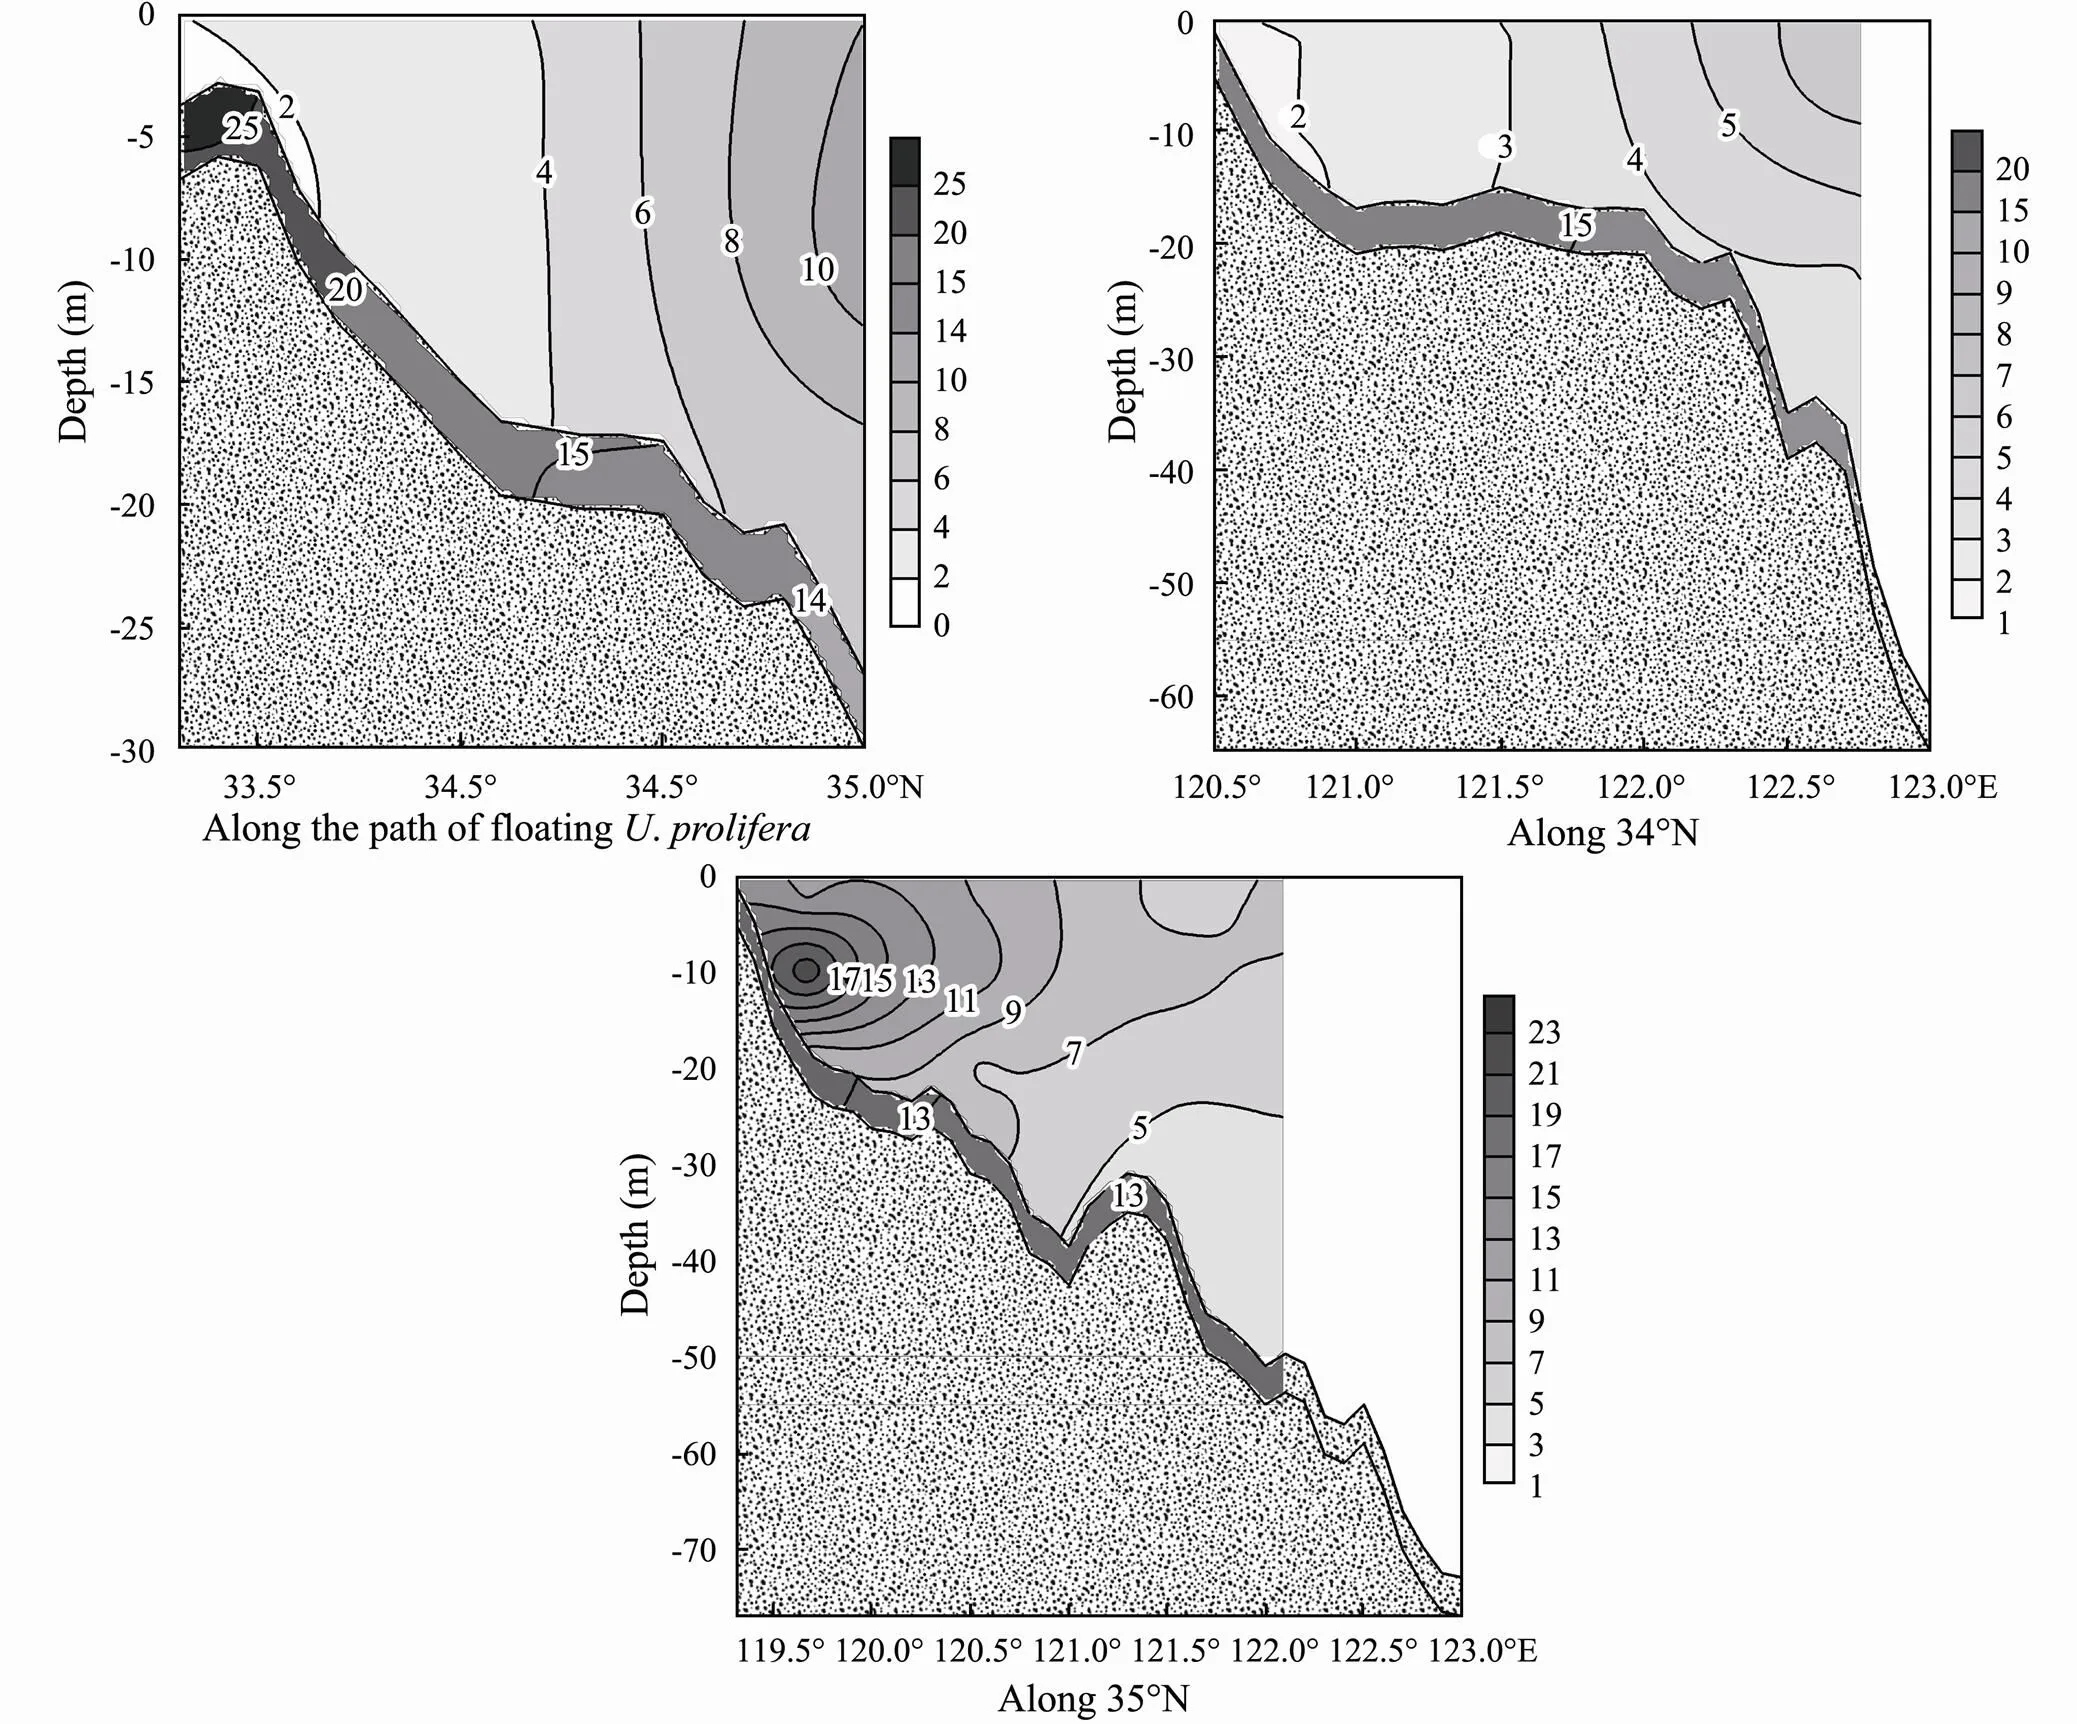
Fig.5 Particulate inorganic phosphorus profiles and inorganic phosphorus in sediment (μmolg−1) along the path of floating Ulva prolifera and along 34˚N and 35˚N within Subei shoal and adjacent waters.
The depth profile of PIP along 34˚N exhibited a similar pattern to that of the path offloating, given the highly turbid seawater. Moreover, the difference between PIP in particles and IP in surface sediment along this dimension was also large (average 11.4μmolg−1), ma- nifesting a strong release of P in the solid-seawater system. In fact, the large amount of floatingwere first found near 34˚N in recent years (Huang., 2014, Guo., 2016; Zhang., 2020), stemming from the abundance of DIP.
The concentrations of PIP and SPM with depth prominently varied along 35˚N, compared with those along 34˚ N and the path offloating. PIP concentrations gradually decreased offshore, in contrast with those along 34˚N. However, PIP along 35˚Nwas generally higher than that along 34˚N, which could be attributed to its low concentration (< 25mgL−1) in SPM at the margin of Subei shoal. Moreover, the difference between PIP and IP in the surface sediments along this dimension was relatively small (average 5.1μmolg−1). These would reduce the averaged M to 0.14μmolL−1by a reduction of 0.01 μmol DIP L−1according to Eq. (5).
3.4 Buffering Capacity of DIP in the Particle-Sea- water System Within the Subei Shoal and Adjacent Waters
As shown in Fig.6, theof DIP in the surface layer of sea water calculated using Eq. (8) was >60, with a maximum of 103 at Subei shoal, and quickly decreased offshore. Such a high level of buffering capacity would lead to the biological uptake of 1μmolL−1phosphate, thus reducing the concentration of DIP by only 0.01μmolL−1and further yielding 3.5mgL−1primary production according to the Redfield ratio (Redfield., 1963). This provides a reasonable explanation for the steady concentration of DIP in Subei shoal despite the high primary production. Furthermore, theof the sea area east to 122˚ E and north to 34˚N was lower than 1, indicating that DIP was hardly complemented by the release of P from the particles. Previous studies have reported that the above area is a muddy deposit area regulated by a cold eddy that forms a P sink (Wei and Wang, 2012; Bian., 2013; Song, 2014). This is consistent with the significance of, and the distribution ofis used to understand the distribution patterns of floating, which nearly narrowed their behavior down to the west of 122˚E (Huang., 2014, Guo., 2016; Zhang., 2020). The model used in this study and the inferred buffering capacity clearly identify these disparate patterns of P behavior. More specifically, the different values ofindicated that SPM is an important regulator of DIP concentration. Therefore, the replenishment of DIP can potentially limit the distribution of phytoplankton forming
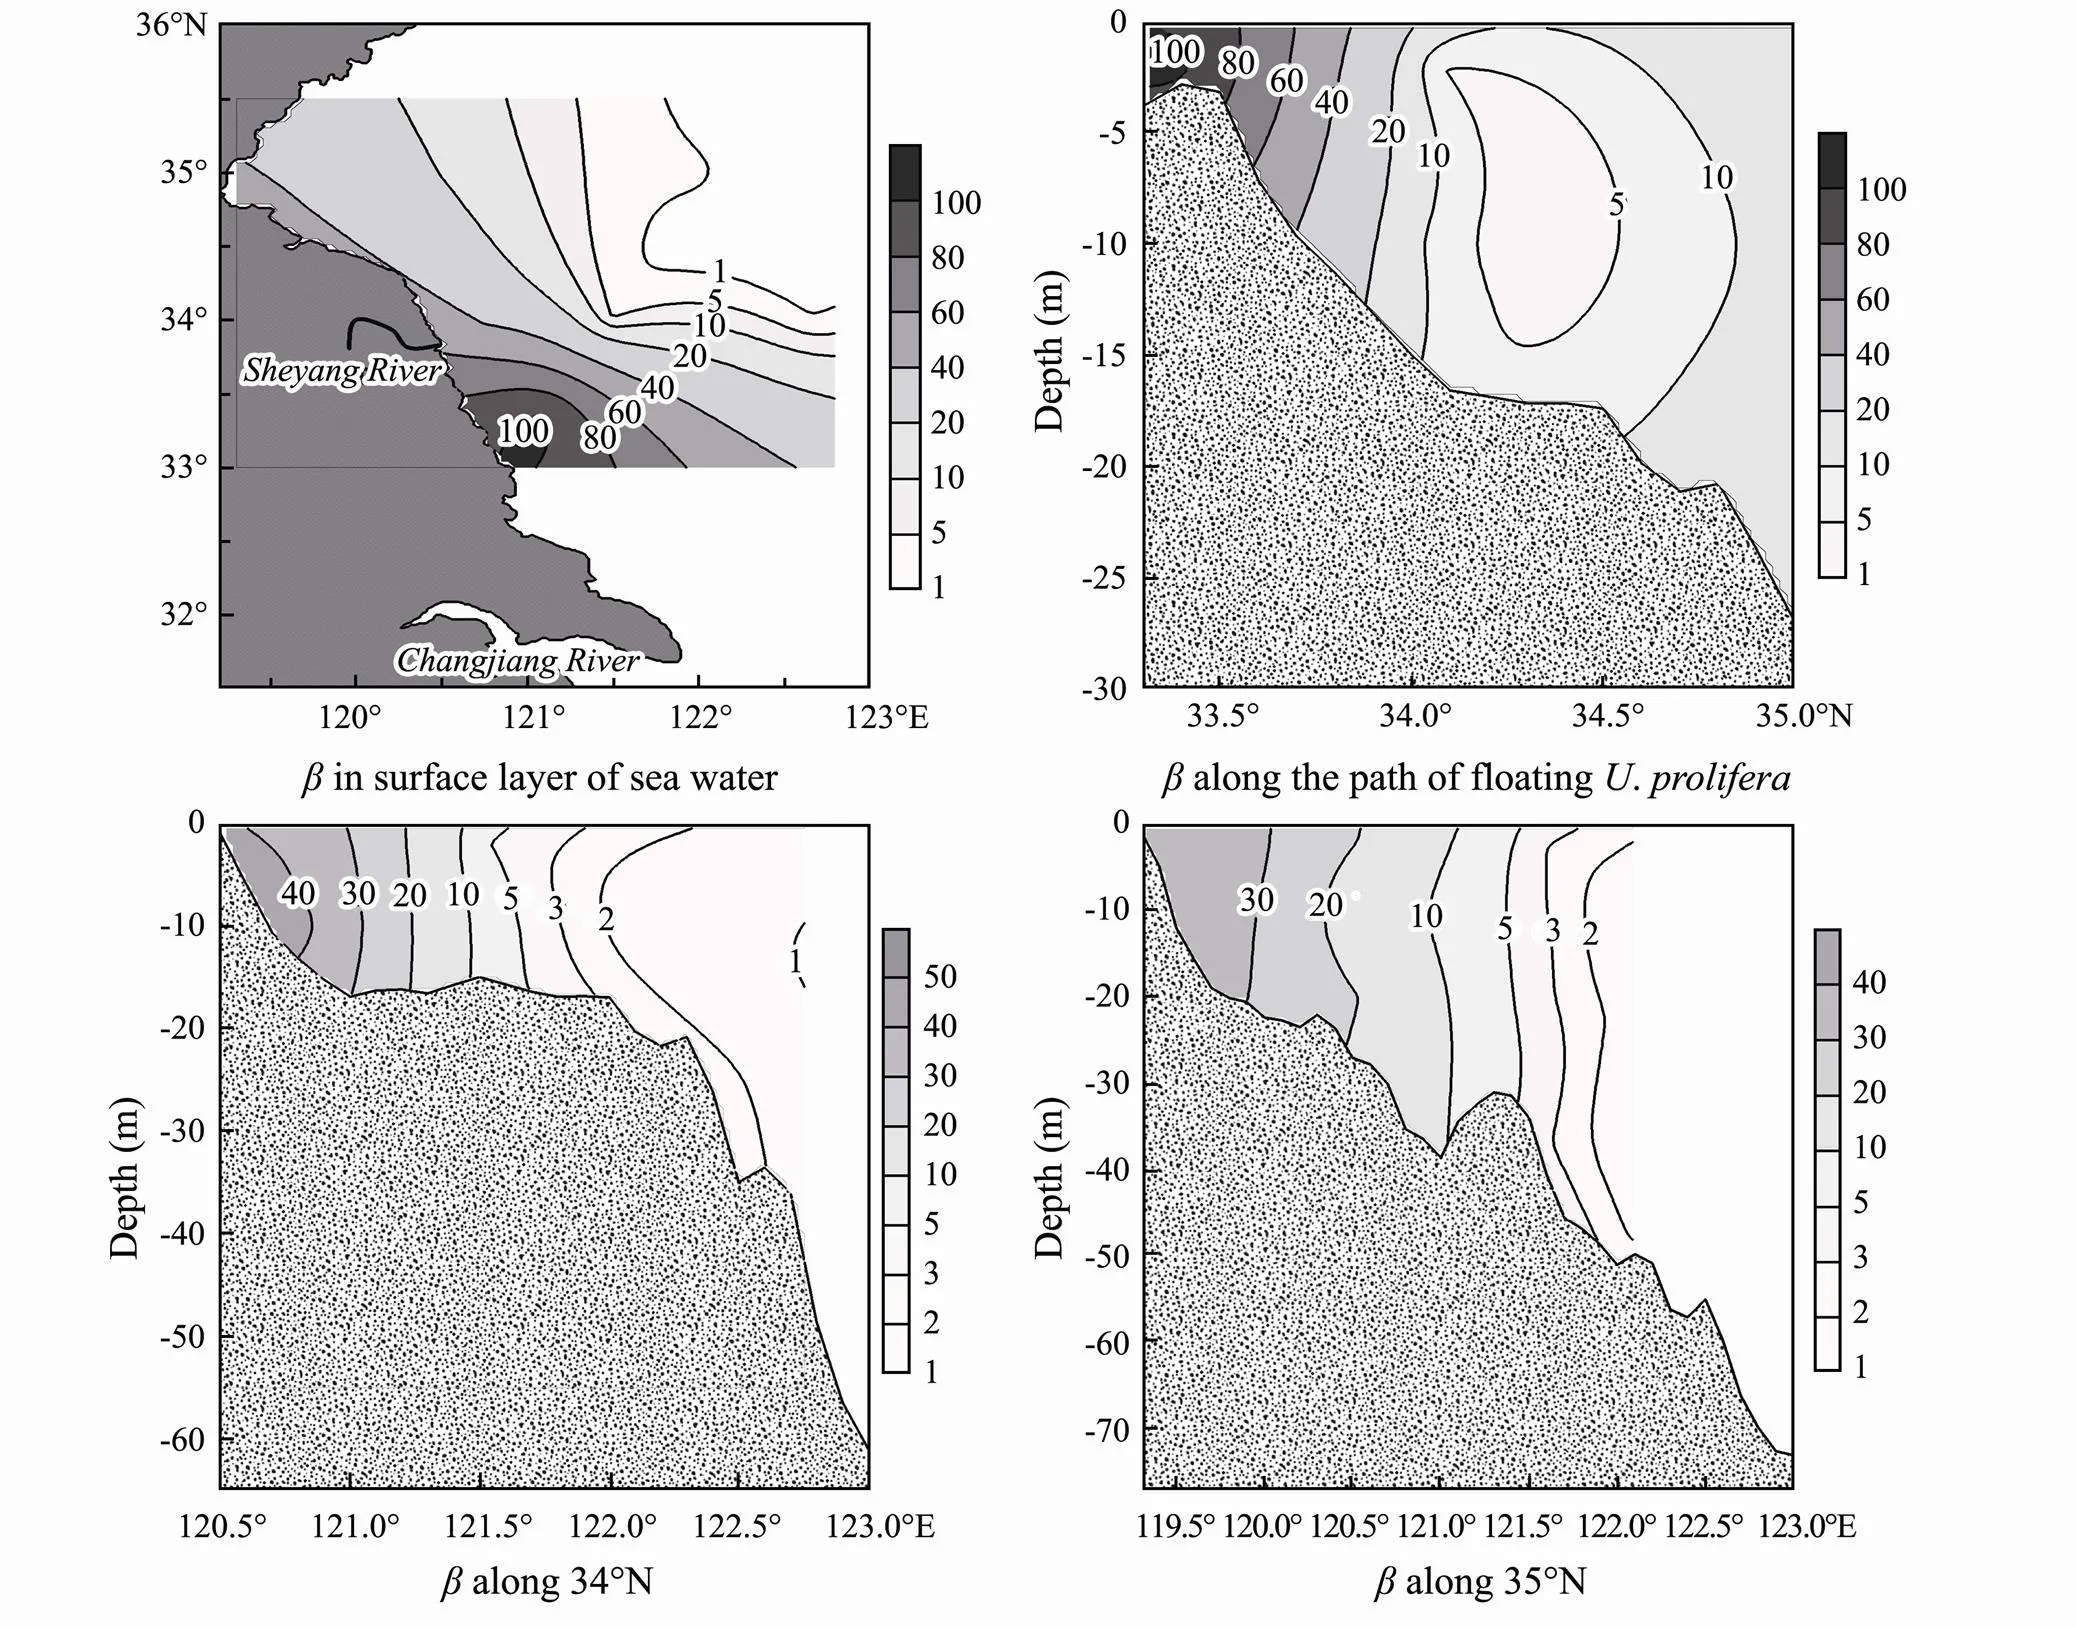
Fig.6 Distribution of the buffering capacity of the particle-seawater system (β) at the surface layer of seawater and profiles along the path of floating Ulva prolifera, 34˚N, and 35˚N in Subei shoal and adjacent waters.
green tide.
4 Conclusions
This study demonstrated that the TP in the surface sediments was dominated by IP, accounting for an average of 89.7% of the TP within Subei shoal and the adjacent waters. TP, Pex, Preac, Predu, and Pauthsignificantly decreased northward and eastward from Subei shoal, contrary to Pdetand Porg. DIP and PIP in the water samples exhibited average values of 0.19μmolL−1and 4.9μmolg−1, respectively. This study used the model on equilibrium of adsorption-desorption process to rationalize the disparate patterns of P behavior in turbid waters. The model results confirmed that SPM is an important regulator of DIP speciation, and the modification of SPM can further modify the buffering capacity of DIP. The calculatedin the surface layer of seawater was >60 within the Subei shoal and always >10 alongthe path ofthe floating, providing evidence of the steady concentration of DIP and distribution of the blooming.
Acknowledgements
This study was supported by the National Natural Science Foundation of China (No. U1901215), the National Key Research and Development Program of China (No. 2019YFE0124700), the China National Key Research and Development Program (No. 2022YFC3106002), and the Startup Foundation for Introducing Talent of NUIST (No. 2020r028). We would like to thank Editage (www.editage.cn) for English language editing.
Bartlett, S. L., Brunner, S. L., Klump, J. V., Houghton, E. M., and Miller, T. R., 2018. Spatial analysis of toxic or otherwise bioactive cyanobacterial peptides in Green Bay, Lake Michigan., 44 (5): 924-933.
Bian, C., Jiang, W., Quan, Q., Wang, T., Greatbatch, R. J., and Li, W., 2013. Distributions of suspended sediment concentration in the Yellow Sea and the East China Sea based on field surveys during the four seasons of 2011., 121-122: 24-35.
Cao, W., 2006. A study on the speciation of phosphorus in the sediments of the East China Sea and the Yellow Sea. PhD thesis. Ocean University of China, Qingdao.
Cao, X. Y., Wang, H., Lu, M., Ge, C. F., Zhou, L. M., and Yang, G. P., 2019. Evaluation study for phosphorus mobilisation- release behaviour on different marine sediments: Focus on phosphate sorption characteristics., 16: 179-186.
Compton, J., Mallinson, D., Glenn, C. R., Filippelli, G., Föllmi, K., Shields, G.,., 2000. Variation in the global phosphorus cycle., 66: 21-33.
Dai, J. C., Song, J. M., Li, X. G., Zheng, G. X., and Yuan, H. M., 2006. Phosphorus and its environmental marker function in Jiaozhou Bay sediments., 27: 1953- 1962.
Ding, Y. M., 2014. Impacts of Ulva ()in the green tide on the Yellow Sea ecological environment– Implications from migration and transformation of biogenic elements. PhD thesis. Ocean University of China, Qingdao.
Duan, H., Ma, R., Xu, X., Kong, F., Zhang, S., Kong, W.,., 2009. Two-decade reconstruction of algal blooms in China’s Lake Taihu., 43 (10): 3522-3528.
Einstein, H. A., and Krone, R. B., 1962. Experiments to determine modes of cohesive sediment transport in salt water., 67 (4): 1451-1461.
Froelich, P. N., 1988. Kinetic control of dissolved phosphate in natural rivers and estuaries: A primer on the phosphate buffering mechanism., 33: 649- 668.
Guo, W., Zhao, L., and Li, X., 2016. The interannual variation of green tide in the Yellow Sea., 38 (12): 36-45(in Chinese with English abstract).
Huang, J., Wu, L., Gao, S., and Li, J., 2014. Analysis on the interannual distribution variation of green tide in Yellow Sea., 23: 572-578.
Li, M. G., 2011. Advances in the research and development of the radial sandbanks., 32 (4): 229-243.
Lin, P., and Guo, L., 2016. Dynamic changes in the abundance and chemical speciation of dissolved and particulate phosphorus across the river-lake interface in southwest Lake Michigan., 61 (2): 771-789.
Monbet, P., Brunskill, G. J., Zagorskis, I., and Pfitzner, J., 2007. Phosphorus speciation in the sediment and mass balance for the central region of the Great Barrier Reef continental shelf (Australia)., 71: 2762- 2779.
Murphy, J., and Riley, J. P., 1962. A modified single solution method for the determination of phosphate in natural water., 27: 31-36.
Nguyen, L. M., 2000. Phosphate incorporation and transformation in surface sediments of a sewage-impacted wetland as influenced by sediment sites, sediment pH and added phosphate concentration., 14: 139-155.
Otten, T. G., Xu, H., Qin, B., Zhu, G., and Paerl, H. W., 2012. Spatiotemporal patterns and ecophysiology of toxigenic microcystis blooms in Lake Taihu, China: Implications for water quality management., 46 (6): 3480-3488.
Petersen, G. W., and Corey, R. B., 1966. A modified Chang and Jackson procedure for routine fraction of inorganic soil phosphates., 30: 563-565.
Prastka, K., Sanders, R., and Jickells, T., 1988. Has the role of estuaries as sources or sinks of dissolved inorganic phosphorus changed over time? Results of a Kstudy., 36: 718-728.
Qi, X. H., 2005. Studies on biogeochemistry of phosphorus in the coastal waters of China. PhD thesis. Ocean University of China, Qingdao.
Redfield, A. C., Ketchum, B. H., and Richards, F. A., 1963. The influence of organisms on the composition of the sea water. In:. Hill, M. N., ed., John Wiley and Sons, Inc., New York, 12-17.
Ruban, V., López-Sánchez. J. F., Pardo, P., Rauret, G., Muntau, H., and Quevauviller, P., 1999. Selection and evaluation of sequential extraction procedures for the determination of phosphorus forms in lake sediment., 1: 51-56.
Ruttenberg, K. C., 1992. Development of a sequential extraction method for different forms of phosphorus in marine sediments., 37: 1460-1482.
Santschi, P. H., 1995. Seasonality in nutrient concentrations in Galveston Bay., 40: 337- 362.
Shi, X., Qi, M., Tang, H., and Han, X., 2015. Spatial and temporal nutrient variations in the Yellow Sea and their effects onblooms., 163: 36-43.
Slomp, C. P., Epping, E. H. G., Helder, W., and Van Rassphorst, W., 1996. A key role for iron-bound phosphorus in authigenic apatite formation in North Atlantic continental platform sediments., 54: 1179-1205.
Song, G., 2014. The distribution of phosphorus forms and affecting factors in the sediments of the Yellow Sea and East China Sea. PhD thesis. Ocean University of China, Qingdao.
Su, J., Fan, W., and Wang, F., 2020. Correlation analysis of spatial distribution change and driving factors of laver cultivation in Haizhou Bay., 32: 22-31.
Wang, A., Gao, S., Jia, J., and Pan, S., 2005. Impact ofon sedimentary and morphological evolution of tidal salt marshes of Jiangsu, China., 60: 61-70.
Wang, C., and Morrison, R. J., 2014. Phosphorus speciation and changes with depth in the sediment of Lake Illawarra, New South Wales, Australia., 71 (8): 3529-3541.
Wang, X. H., Qiao, F. L., Lu, J., and Gong, F., 2011. The turbidity maxima of the northern Jiangsu shoal-water in the Yellow Sea, China., 93: 202- 211.
Wei, Q., Wang, B., Yao, Q., Fu, M., Sun, J., Xu, B.,., 2018. Hydro-biogeochemical processes and their implications forblooms and expansion in the world’s largest green tide occurrence region (Yellow Sea, China)., 645: 257-266.
Wei, Q. S., and Wang, B. D., 2012. Distributions of carbon, nitrogen and phosphorus in the surface sediments and their ecological implications in the areas of cold water mass and off the western coast of the Southern Yellow Sea., 32: 1697-1707.
Withers, P. J. A., Jarvie, H. P., Hodgkinson, R. A., Palmer- Felgate, E. J., Bates, A., Neal, M.,., 2009. Characterization of phosphorus sources in rural watersheds., 38: 1998-2011.
Zhang, H., Wang, G., Zhang, C., Su, R., Shi, X., and Wang, X., 2020. Characterization of the development stages and roles of nutrients and other environmental factors in green tides in the southern Yellow Sea, China., 98: 101893.
Zhang, X. X., Yan, C., Xu, P., Dai, Y., Yan, W., Ding, X.,., 2013a. Historical evolution of tidal flat reclamation in the Jiangsu coastal areas., 68: 1549-1558.
Zhang, X. Y., Yang, Q., Sun, Y., and Huang, J. S., 2013b. The distribution of phosphorus forms and bioavailability in sediments from Huang Dong Hai continental shelf., 33: 3509-3519.
Zhu, W., Wang, N., Dong, X., Cong, X., Han, X., and Pan, X., 2020. Study on the influence of turbulence intensity and se- diment concentration on the settling velocity in Haizhou Bay., 39: 475-506.
Zhu, Y., 2009. Preliminary study on distribution characteristics and biogeochemistry of various phosphorus forms in the sediments of the East China Sea and the Yellow Sea. PhD thesis. Ocean University of China, Qingdao.
(November 30, 2021; revised March 5, 2022; accepted June 6, 2022)
© Ocean University of China, Science Press and Springer-Verlag GmbH Germany 2023
Corresponding author. E-mail: chywang@nuist.edu.cn
(Edited by Ji Dechun)
杂志排行
Journal of Ocean University of China的其它文章
- The Subduction Structure Beneath the New Britain Island Arc and the Adjacent Region from Double-Difference Tomography
- Differences of Polygonal Faults with Irregularly Polygonal Geometries: A Case Study from the Changchang Sag of Qiongdongnan Basin, Northern South China Sea
- Characterization of Bacterial Communities in Aerosols over Northern Chinese Marginal Seas and the Northwestern Pacific Ocean in Autumn
- Assessment and Application of Beach Quality Based on Analytic Hierarchy Process in Yangkou Beach, Qingdao
- Pharmacokinetics of Enrofloxacin and Its Metabolite in Carp (Cyprinus carpio) After a Single Oral Administration in Medicated Feed
- Histone Deacetylation Modifier Induced One New Resorcylic Acid Lactone 7′(Z)-zeaenol from the Zoanthid-Derived Fungus Cochliobolus lunatus