Surface structure modification of ReSe2 nanosheets via carbon ion irradiation
2023-03-13MeiQiao乔梅TieJunWang王铁军YongLiu刘泳TaoLiu刘涛ShanLiu刘珊andShiCaiXu许士才
Mei Qiao(乔梅) Tie-Jun Wang(王铁军) Yong Liu(刘泳)Tao Liu(刘涛) Shan Liu(刘珊) and Shi-Cai Xu(许士才)
1College of Physics and Electronic Information,Shandong Key Laboratory of Biophysics,Dezhou University,Dezhou 253023,China
2School of Physics,State Key Laboratory of Crystal Materials and Key Laboratory of Particle and Particle Irradiation(MOE),Shandong University,Jinan 250100,China
3School of Electronic and Information,Qingdao University,Qingdao 266071,China
Keywords: ion irradiation,microstructure,crystallinity,surface morphology
1.Introduction
Owing to the unique optical and electronic properties,transition metal dichalcogenides (TMDs) have been widely studied, showing that TMD has a great potential application in beyond-CMOS devices.[1-8]Among the TMDs,ReSe2crystallizes belong to the triclinic system, and the cluster of Re4units forms a one-dimensional (1D) chain inside each monolayer, with layers held together by van der Waals attraction.[9]Generally, most VI TMDs such as MoS2and WS2show more superior performances due to their monolayer structure,while unlike other two-dimensional(2D)materials,ReSe2shows very weak layer-dependent optical and vibrational properties.[10,11]The stabilization of the extra valence electron in each Re atom can result in inherent lattice distortion in ReSe2, which makes it a suitable candidate for tuning the optical properties via strain engineering.[12]The multilayer ReSe2flakes have been demonstrated as field-effect transistors(FETs), digital inverters, and photodetectors.[13,14]However, the synthesis technology of ReSe2nanosheet is more complicated than those of other TMDs such as MoS2and WS2, due to its properties (like structure, crystal quality, domain size, thickness, and morphology) are difficult to modify accurately.[15,16]Unlike hexagonal layered TMDs such as MoS2and WS2, the ReSe2with anisotropy shows the potential in fabricating versatile devices, and it is essential to develop modification strategy to improve properties of ReSe2for practical applications.[12]In recent years, a large amount of work on ion beam modification of 2D or other film materials has been performed,showing an effective way to modify ReSe2.[17-24]
In this work, the properties of multilayer ReSe2samples on Al2O3substrates are modified by ion irradiation technique.The irradiated C ions lose energy through two mechanisms:nuclear energy loss (originating from nucleus collision) and electronic energy loss(arising from interaction between irradiated electron and lattice atoms).The micro-structure and related properties of multilayer ReSe2sample are modified through these two energy-losing mechanisms.The surface morphologies, including the size, thickness, microstructure,elemental analysis, bonding configurations, and crystallinity of the multilayer ReSe2samples, are studied after 1.0-MeV C ion irradiation at fluence rates of 5.0×10¹³ions/cm2and 5.0×10¹⁴ions/cm2.The results indicate that the domain sizes,thickness,crystallinities,and morphologies of the ReSe2samples can be effectively controlled by ion irradiation process.
2.Materials and methods
The multilayer ReSe2samples were grown on the single crystal Al2O3by the CVD with dimensions of 5.0 mm×5.0 mm×0.5 mm,and irradiated by 1.0-MeV C ions at the fluences of 5.0×10¹³ions/cm2and 5.0×10¹⁴ions/cm2from a 2×1.7-MV tandem accelerator[25]at room temperature(~300 K).The details of the ions irradiated on multilayer ReSe2flakes on crystalline Al2O3are displayed in Table 1.
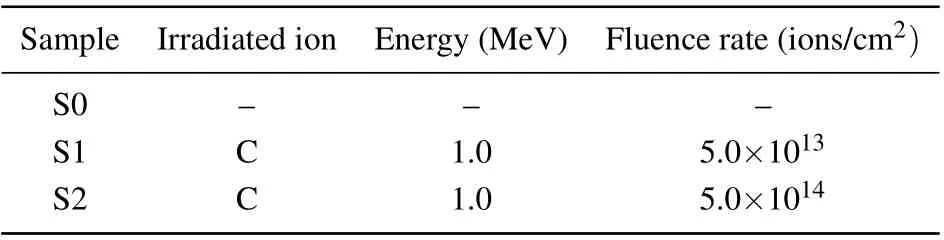
Table 1.Details of ion irradiated multilayer ReSe2 flakes on crystalline Al2O3.
The ion irradiation effects in multilayer ReSe2samples were characterized by utilizing atomic force microscope(AFM), scanning electron microscopy (SEM), micro-Raman spectra, x-ray photoelectron spectroscopy (XPS), and x-ray diffraction (XRD).The thickness of non-irradiated and irradiated ReSe2flakes were characterized by AFM on NT-MDT model BL222 RNTE.The peak force amplitude and scan rate were 150 nm and 0.977 Hz, respectively.Surface morphologies, including the sizes and shapes of the multilayer ReSe2samples, were determined by SEM imaging on a Hitachi S-4800.The imaging resolution and accelerating voltage were 1.0 nm and 5 kV, respectively.The detailed Raman peak positions and a comparison before and after ion irradiation were obtained at room temperature by using a multichannel modular triple Raman system(HORIBA Jobin-Yvon HR800)at 632.8-nm excitation wavelengths.The spot diameters of the focused laser beam on the multilayer ReSe2samples were all about 1.0 µm.The core level elemental analysis and bonding configurations of the multilayer ReSe2samples were performed by XPS on an ESCALAB 250.Monochromatic AlKαx-ray source(1486.6 eV)and hemispherical deflector analyser were used in the XPS spectrometer,working at constant pass energy,and constant energy resolution on the whole spectrum can be maintained with this mode.Intrinsic resolution of the spectrometer was 0.45 eV,which was proved by the the Ag 3d5/2line.The x-ray spot in this experiment was about 150-µm diameter.The XRD experiments were conducted to structurally analyze the samples with CuKαemission(λ=1.54056 °A)on a Rigaku RINT-2500 VHF x-ray diffractometer.The diffraction patterns were recorded between 10°and 30°on a 2θscale in steps of 0.04°.
3.Results and discussion
In Fig.1,AFM images of multilayer ReSe2surface nonirradiated and irradiated with 1.0-MeV C ions at fluence of 5.0×10¹³ions/cm2and 5.0×10¹⁴ions/cm2are shown.The typical shape and corresponding height profile of multilayer ReSe2are determined by AFM and the reults are displayed in Figs.1(a)-1(f).The ReSe2flakes on Al2O3substrates display quadrilateral shape before irradiation and then turn into oval shapes after being processed.The change of shape can be attributed to the difference in edge formation energy between the Re edge and Se edge termination before and after being irradiated by C ions.After the irradiation of 1.0-MeV C ions,the specific edge termination effect was destroyed,and oval shapes form in the multilayer ReSe2.Thickness of the monolayer ReSe2flake is approximately in a range of 0.7 nm-0.8 nm.[9]In Fig.1,the observed thickness values of the ReSe2samples are approximately 2.8,6.4,and 9.1 nm corresponding to flakes consisting of 4,9,and 13 layers for samples S0,S1,and S2,respectively.Through the collision cascade,the atoms of ReSe2acquire higher energy than that due to the van der Waals’ forces.Then, the ReSe2flakes continue to grow and the thickness values of the ReSe2flakes increase after the irradiation of 1.0-MeV C ions.
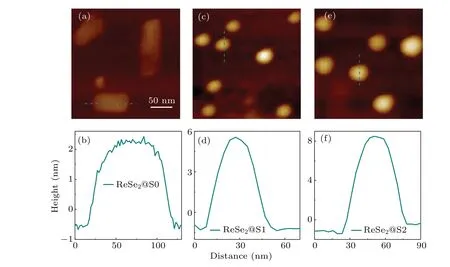
Fig.1.AFM images for multilayer ReSe2: (a)2D image and(b)height profile for sample S0;(c)2D image and(d)height profile for sample S1;(e)2D image and(f)height profile for sample S2.
The surface morphologies before and after 1.0-MeV C ions irradiation are determined by using SEM technique and shown in Fig.2.Figure 2(a)shows that the surface profile of the non-irradiated multilayer ReSe2is relatively smooth and uniform.Figure 2(b) displays a magnified view of the nonirradiated multilayer ReSe2.After the irradiation of 1.0-MeV C ions,the morphologies of the samples S1 and S2 are greatly changed.After the irradiation of 1.0-MeV C ions at the fluence rate of 5.0×10¹³ions/cm2,pores with diameters in a range of 10µm-25µm are evenly located on the multilayer ReSe2sample(as shown in Fig.2(c)).Figure 2(d)shows that the particles of ReSe2are perfectly oval with a uniform size distribution.The long diameter and short diameter of the ReSe2nanoparticles(sample S2)are approximately 3.0µm and 1.0µm, respectively.The average distance between the nanoparticles is approximately 17.0 µm.A higher irradiation fluence causes great damaging effects on the dimensions of the samples.It is an effective way to modify sample size by controlling the irradiation conditions.

Fig.2.SEM images of multilayer ReSe2 samples under different irradiation conditions: (a) sample S0 (unirradiated), (b) high-magnification for sample S0,(c)sample S1(1.0-MeV C ions at a fluence of 5.0×10¹³ ions/cm2),and(d)sample S2(1.0-MeV C ions at a fluence of 5.0×10¹⁴ ions/cm2).
The atomic vibrational spectra of multilayer ReSe2flakes after the irradiation of 1.0-MeV C ions at the fluence rates of 5.0×10¹³ions/cm2and 5.0×10¹⁴ions/cm2are detected in a range of 100 cm-1-300 cm-1and are shown in Fig.3.Unlike the Raman spectra of MoX2and WX2(X=S, Se), the Raman spectra of the ReSe2are feature-rich with approximately 18 first-order Raman-active modes in the range of 100 cm-1-300 cm-1, which are nondegenerate due to their low-symmetry triclinic structure.[9]For ReSe2,it is difficult to determine a pure vibration mode because of the complicated crystal lattice.Therefore,we name the Raman modes based on the dominant direction of the phonon vibrations.As shown in Fig.3,the Raman peaks at 121 cm-1results from the in-plane vibrational mode (Eg-like) and at 163 cm-1and 176 cm-1originate from the out-of-plane vibrational mode(Ag-like).[26]
The thickness values of ReSe2layers after being irradiated by 1.0-MeV C ions are measured from the AFM images and shown in Fig.1.With the increase of sample thickness,most of the peaks for the few-layer ReSe2are red-shifted(Fig.3).Only considering the long-range Coulombic interactions, the Coulombic screening can be increased by the increasing dielectric tensors that augment with the number of layers increasing.This results in a softer Coulombic interaction between atoms, and therefore, the redshift takes place in the corresponding Raman peaks.[27]However, if we consider the van der Waals force, the interaction between the layers tends to suppress the lattice vibrations with the number of layers increasing.Thus,the vibrational energy of each vibration mode can increase,thereby leading to blueshift.[28]We know that the atomic mass of ReSe2is almost equal to that of WSe2.For WSe2,theE2gandA1gmodes show the changes of redshift and blueshift from the monolayer to the bulk,respectively.[29]The strength of Coulombic screening can be measured by the ratio of the long-range coulomb interaction of the monolayer to that of the bulk,
The details can be found in previous work.[26]From the above equation,we can determine that the long-range Coulombic interactions in WSe2and ReSe2are similar to each other.In addition,the interlayer force constantα∝µωcan be used to measure the van der Waals interaction,wheremandware the atomic mass of the monolayer TMDCs and the Raman frequency, respectively.From Ref.[30], the frequency of the C mode and the LB mode in bilayer WSe2are higher than those in bilayer ReSe2.The calculations show that the interlayer van der Waals interaction of ReSe2is much weaker than that of WSe2.According to the above discussion,with the number of ReSe2layers increasing,the redshifts of the Raman modes after the irradiation of 1.0-MeV C ions as shown in Fig.3 indicate that the interlayer van der Waals interaction is not strong enough to determine the layer dependence of the phonon behavior.
However,the Raman mode at 163 cm-1mainly involves the atomic displacement of the Re-Re bond.[31]After the irradiation of 1.0-MeV C ions, the Raman mode is located at 162.5 cm-1for sample S1 and at 161.7 cm-1for sample S2.Under the above condition, we can determine that a longer bond length for the Re-Re bond occurs due to the volume expansion induced by irradiation, with the ReSe2layer number increasing.
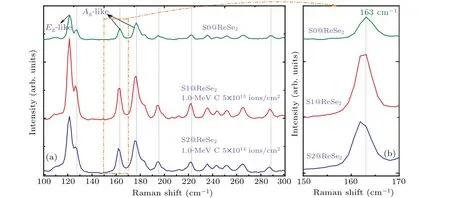
Fig.3.Raman spectra obtained at 632.8-nm excitation energy for multilayer ReSe2 flakes irradiated under different conditions.

Fig.4.XPS spectra of multilayer ReSe2 flakes before and after the irradiations of 1.0-MeV C ions.
The elemental compositions and bonding configurations of the multilayer ReSe2samples are characterized by XPS.The detailed information regarding the Re signal and Se signal is exhibited in Figs.4(a), 4(c), 4(e) 4(b), 4(d), and 4(f),respectively.As shown in Fig.4(a), two characteristic peaks located at 41.6 eV and 44.1 eV are observed, which correspond to the core 4f7/2and 4f5/2levels of Re4+.Additionally,figure 4(b)shows clearly resolved Se2-3d5/2and 3d3/2peaks at 54.78 eV and 55.61 eV determined via the curve fitting.The two characteristic peaks are consistent with the results reported in Ref.[32],and the curve fitting method is based on the XPS peak code.Additionally, the ratio of Re to Se acquired from XPS is nearly 1:2, which suggests that the CVD-grown ReSe2is reasonably stoichiometric.
To further analyze the change of multilayer ReSe2after the irradiation of 1.0-MeV C ions , the shift of XPS peak is studied and shown in Figs.4(c)-4(f).The peak position shift of XPS is a combined result of three main factors.First of all,the defects induced by ion irradiation will result in surface energy band bending and the peak value shifts to a higher energy value.Meanwhile,the irradiation-induced defects and latticedisorder will also lead the lattice volume to expand,and further cause longer bond length of the Re-Re bond, with irradiated fluence increasing.The longer Re-Re bond length is apparently corresponding to weaker bond strength,which causes the binding energy to shift to a lower energy value.Furthermore,C ion irradiation will induce partial electron to transfer, and part of Re4+ions are converted into Re2+ions, which leads the binding energy to decrease.
The XPS result of Re 4f in Fig.1(c)shows two spin-orbit split peaks with a separation of 2.5 eV, which correspond to 4f7/2and 4f5/2respectively.Apparently,the Re 4f7/2peak can be fitted by two peaks,i.e.,the dominant peak at 41.9 eV(the characteristics of n-type doping), which is due to the surface energy band bending effect induced by defect,and the weaker peak at 41.0 eV, which is attributed to the volume expansion of lattice and the presence of Re2+ion.The Re 4f5/2peak can also be fitted by two peaks, out of the same reason.In addition,as shown in Fig.4(e),the Re 4f7/2peak value of sample S2 shifts by 0.7 eV, reasching a lower energy value, which shows that lattice volume expansion and the role of Re2+ion are dominated in sample S2.As a conclusion,the shift of XPS peak shows an oscillatory trend with fluence increasing,which is determined by the joint action of irradiation induced defects,lattice-expansion effect and the role of Re2+ion.
The XRD is used to evaluate the structural characteristics of multilayer ReSe2flakes under the different irradiation conditions, and the results are shown in Fig.5.For samples S0, S1, and S2, most of significant (001) peaks are observed at 2θ=13.00°, 13.76°, and 13.65°, respectively.The XRD pattern is consistent with the JCPDS card No.89-0340, wihch indicates the presence of the triclinic phase for multilayer ReSe2.The interplanar spacings are approximately 6.8712 °A,6.4306 °A,and 6.4811 °A from Jade 6.0 for samples S0-S2,respectively.Nonirradiated ReSe2flakes(S0)yield a very noisy powder XRD pattern with lines of weak intensity and wide FWHM, indicating poor crystallinity of the sample S0.After the irradiation of 1.0-MeV C ions,which causes the ReSe2to grow,the thickness of the ReSe2layer increases,the intensity of the diffraction peak strengthens, and the FWHM decreases.This indicates that the crystallinity of the ReSe2flake is improved with the number of layers increasing after the irradiation of 1.0-MeV C ions.Comparing with non-irradiated ReSe2flakes(sample S0),the intensity of the diffraction peak is improved by approximately 148%for sample S1 and 180%for sample S2.In addition, the FWHM values of the (001)diffraction peakare approximately 2.15°,0.92°,and 0.87°,for samples S0, S1, and S2 respectively.From the above data,the average crystallite size can be calculated using the Debye-Scherer equation
The details can be found in Ref.[33].From Eq.(2), we can determine the average crystallite sizeD0=3.67 nm (sample S0),D1=8.65 nm (sample S1), andD2=9.09 nm (sample S2).The increased crystallite size can also reveal that the crystallinity is improved with the increase of the number of layers after the irradiation of ions.As a result, comparing with the data of samples detected by XRD,AFM,and SEM,it is apparent that samples S1 and S2 show almost the same crystalline quality and grain size,which means that the irradiated condition of S1(with lower fluence means cost-effective and lower irradiation effect)is more appropriate for ReSe2samples.
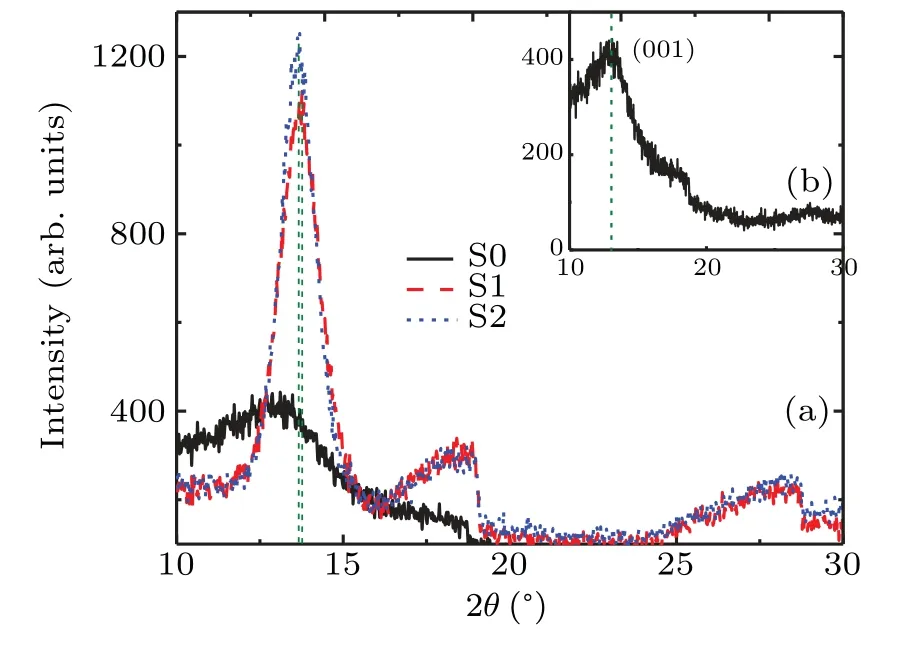
Fig.5.XRD patterns (θ-2θ) of multilayer ReSe2 flakes before and after being irradiated by 1.0-MeV C ions.
4.Conclusions
In this work, the effect of C ion irradiation of multilayer ReSe2flakes has been studied and characterized by utilizing AFM, SEM, micro-Raman spectra, XPS, and XRD.The results confirm that that the domain size,thickness,morphology,and crystallinity for the ReSe2sample can be effectively controlled after the irradiation of 1.0-MeV C ions.Through appropriately regulating the energy and fluence of C ions,multilayer ReSe2samples with high-quality crystallinity,relatively large size and good performance can be obtained.
Acknowledgements
Project supported by the National Natural Science Foundation of China (Grant Nos.12105036, 11775135,and 11805108), the Natural Science Foundation of Shandong Province, China (Grant Nos.ZR2020QA088 and ZR2021QA074), the Taishan Scholars Program of Shandong Province, China (Grant No.tsqn201812104), and the State Key Laboratory of Nuclear Physics and Technology at Peking University,China.
猜你喜欢
杂志排行

Chinese Physics B的其它文章
- Matrix integrable fifth-order mKdV equations and their soliton solutions
- Comparison of differential evolution,particle swarm optimization,quantum-behaved particle swarm optimization,and quantum evolutionary algorithm for preparation of quantum states
- Explicit K-symplectic methods for nonseparable non-canonical Hamiltonian systems
- Molecular dynamics study of interactions between edge dislocation and irradiation-induced defects in Fe-10Ni-20Cr alloy
- Engineering topological state transfer in four-period Su-Schrieffer-Heeger chain
- Spontaneous emission of a moving atom in a waveguide of rectangular cross section