In2O3修饰三维纳米花MoSx构建S型异质结用于高效光催化产氢
2023-01-13李红英龚海明靳治良
李红英,龚海明,靳治良
北方民族大学化学与化学工程学院,国家民委化工技术基础重点实验室,宁夏太阳能化学转化技术重点实验室,银川 750021
1 Introduction
Molybdenum based sulfide (such as MoS2) is a good substitute for noble metal materials such as Pt due to its good electrochemical stability, low cost, and low Gibbs free energy8.Bulk MoS2is divided into 2H, 1T, 1T’ and 3R phases according to the coordination behavior and stacking order of [MoS6]polyhedrons (triangular prisms or octahedrons)9.Among them,the in-plane electron transport performance in the 2H, 3R, and 1T’ phases are good.However, electron transport on thec-axis is limited for various reasons10.Therefore, the establishment of a three-dimensional structure to increase the electron transport channel can further promote the hydrogen evolution activity of the molybdenum-based material.Interestingly, threedimensional (3D) Mo2S3is a molecular Mo-S chain embedded in 1T’-MoS2, and its vertical zigzag chain is connected to the 1T’unit, providing a 3D channel for electron transmission11,12.However, it is difficult to synthesize pure Mo2S3at lower temperatures.Therefore, MoSxwith the same three-dimensional morphology was synthesized by hydrothermal method, and the unsaturated Mo and S atoms still existed on the edge, which could expose more active sites and promote the precipitation of hydrogen13.
The In2O3has suitable band gap (2.8 eV), easy-to-control morphology and good stability14,15.Thed10electronic configuration of In3+ions causesdelectrons to participate in photoexcitation, which plays a key role in the photocatalytic activity of In2O316.Nevertheless, In2O3has limited absorption capacity for visible light, which affects the hydrogen evolution activity17.Coupling semiconductor materials with different band gaps to construct a heterojunction can drive the directional migration of carriers and promote the separation and transfer of photoelectrons18.Traditional heterojunctions include type-II heterojunctions, p-n heterojunctions, surface heterojunctions,all-solid state Z-scheme heterojunctions, and semiconductor graphene (SC-graphene) heterojunctions19-21.It has been reported that traditional type II heterojunctions have defects in both thermodynamics and kinetics.The electron transfer mechanism of Z-scheme heterojunctions derived from traditional type-II heterojunctions is prone to confusion22.Therefore, Yuet al.introduced a new concept of S-scheme heterojunction to describe the photocatalytic hydrogen evolution mechanism23.The characteristic of the S-scheme heterojunction is that more useful electrons are retained in the conduction band of the reductive catalyst, and more useful holes are retained in the valence band of the oxidized catalyst24.In addition, the useless electron and hole is recombination under the influence of three factors: internal electric field, band bending and Coulomb gravity, preserving the stronger redox ability of the material25.
In this work, MoSx/In2O3was constructed by a simple hydrothermal method.The three-dimensional nanoflower was provide a 3D electron transport channel and an S-scheme heterojunction to directionally control the separation and transfer of carriers to promote the precipitation of hydrogen.The layered stacking structure of molybdenum-based sulfide and the edge unsaturated Mo and S atoms are the active sites for the reaction to increase.At the same time, the appropriate band gap of In2O3was used to construct a heterojunction to accelerate carrier transfer.This work provides a new idea for rationally regulating the directional separation and transfer of carriers to construct a high-efficiency hydrogen evolution catalyst.
2 Experimental and computational section
Thiourea (AR 98%, CH4N2S), ammonium molybdate (AR 99%, (NH4)2MoO4) and indium nitrate (AR 99%,In(NO3)3·xH2O)) were purchased from Sarn Chemical Technology (Shanghai) Co., Ltd.Ammonia (25.0%-28.0%) was purchased from Sinopharm Holding Chemical Reagent Co.,Ltd.; polyvinylpyrrolidone was purchased from Beijing Chemical Reagent Company.All reagents are of analytical grade purity and have not been processed.
2.1 Synthesis of MoSx
0.583 g (NH4)2MoO4, 1.266 g of thiourea and 0.416 g polyvinylpyrrolidone (PVP) were dissolved in 60 mL deionized water with stirring.After stirring for 30 min, the solution was transferred to a high polytetrafluoroethylene reactor at 200 °C for 24 h.The cooled reaction solution cooled to room temperature was washed with deionized water and ethanol, and dried at 80 °C to obtain a black powder.
2.2 Synthesis of In2O3
1 g In(NO3)3was added to 20 mL of deionized water until dissolved, and 3 mL of ammonia (25%-28%) was added dropwise to form a white cloudy solution.The solution was aged in 80 °C water bath for 1 h.After the precipitate was cooled,centrifugation, washing (water and ethanol) and drying were used to obtain a white powder.The powder was further calcined in a muffle furnace to obtain a pale yellow powder (350 °C/3 h).
2.3 Synthesis of MoSx/In2O3
The preparation process of the composite catalyst is similar to MoSx.Similarly, 0.583 g (NH4)6Mo7O24·4H2O, 1.266 g thiourea and 0.416 g polyvinylpyrrolidone (PVP) were dissolved in 60 mL deionized water.The amount of In2O3powder was added to the solution and stirring for 30 min (0.029, 0.058, 0.087, 0.116 and 0.175 g respectively).The mixed solution was kept at 200 °C for 24 h, cooled to room temperature, washed and dried with deionized water and ethanol.The resulting composite sample is simply named 5-MIO, 10-MIO, 15-MIO 20-MIO and 30-MIO.The experimental preparation process is shown in the Scheme 1.
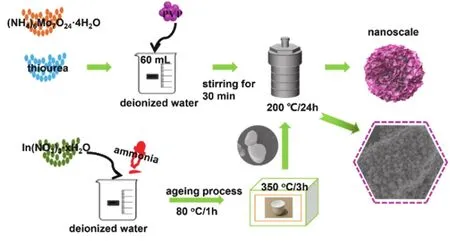
Scheme 1 The synthesis process of MoSx/In2O3.
2.4 Characterization
Scanning electron microscopy (SEM, EV018, ZEISS,Germany) and transmission electron microscopy (TEM, JEOL JEM1200EX, Japan) are tools to study the morphology of the catalysts.X-ray diffractometer (XRD, RigakuSmartLab, Japan,CuKα) was used to test the crystal structure of MoSx, In2O3andx-MIO.The X-ray photoelectron spectroscopy (XPS, EscaLab 250Xi, Thermo Scientific, USA) was used to test the surface valence state and elemental composition of the samples.In addition, the size of the specific surface area of the sample is also discussed (ASAP 2460, Micromeritics, USA).The FluoroMAX-4 spectrometer (Horiba, France) recorded the photoluminescence (PL) spectrum of the samples.The optical properties of the samples were investigated by UV-2550 (Lambda 750 S,PerkinElmer, USA) spectrometer with BaSO4as background.
微信红包分享,让微信支付快速崛起,“打车优惠券”分享,让滴滴成为破百亿美元的移动入口。实践证明:消耗就是积累,资源越用越有价值,即分享就是获取。
2.5 Hydrogen evolution performance evaluation
10 mg photocatalyst, 20 mg eosin (EY) and 30 mL triethanolamine solution (TEOA, 15%v/v, pH = 10) were added to the 62 mL reaction flask (PCX50A Discover) and ultrasonicated for 15 min to form a suspension solution.The air in the bottle was replaced with an inert gas (nitrogen) and then placed in a multi-channel reaction system with a 5W LED lamp as the light source for photocatalytic reaction.The amount of hydrogen was detected by gas chromatograph (Timei GC7900,TCD, 13X column, N2as carrier).In addition, 10-MIO was tested for cyclic stability for 20 h.Each cycle was performed for 5 h and 20 mg of fresh EY dye was added prior to the start of each cycle.
2.6 Photoelectrochemical measurements
Photoelectrochemical measurements were performed by an electrochemical analyzer (VersaStat4-400, Advanced Measurement Technology, Inc, AMETEK, USA).The testing process used a standard three-electrode system with 0.2 mol·L-1Na2SO4solution as the electrolyte and a 300 W Xenon lamp as the light source.The three electrodes consist of a platinum electrode, a saturated calomel electrode and a working electrode.The preparation process of the working electrode is based on the preprocessing that 5 mg of catalyst was dissolved in 10 μL of 10% Nafion solution and a uniform suspension formed by sonication.Then, the suspension was evenly dropped on a pretreated (ethanol and deionized water) FTO glass sheet with an area of 1 cm × 1 cm, and dried to obtain a working electrode.
3 Results and discussion
3.1 X-ray diffraction analysis
The crystal phase structure of the photocatalyst was shown in Fig.1.The diffraction peak pattern of MoSxwas shown in Fig.1a,which has obvious crystalline phase structure characteristics.Diffraction peaks containing Mo2S3and Mo15S19were found by comparison with the standard card (PDF#78-1332, PDF#40-936).Among them, two distinct sharp peaks at 12.03° and 57.26°are attributed to the (101) and (020) crystal plane of Mo15S19and Mo2S3.In Fig.1b, the diffraction peaks of In2O3show sharp and obvious features.The main peaks of In2O3at 2θ= 30.66°, 51.26°and 60.77° correspond to (222), (440) and (622) crystal planes,respectively (PDF#6-416).In addition, the weaker peaks at 21.52°, 35.56°, 45.78° and 56.18° are attributed to the (211),(400), (431) and (611) crystal planes of In2O3.In contrast, the diffraction peaks of the composite catalyst showed the main characteristics of MoSxdue to its large content.However, the intensity of the (222), (440) and (622) crystal planes of In2O3in the composite material gradually increase as the content of In2O3increases.In addition, no peaks other than MoSxand In2O3were detected in the composites, indicating that the composites of both were successfully prepared.
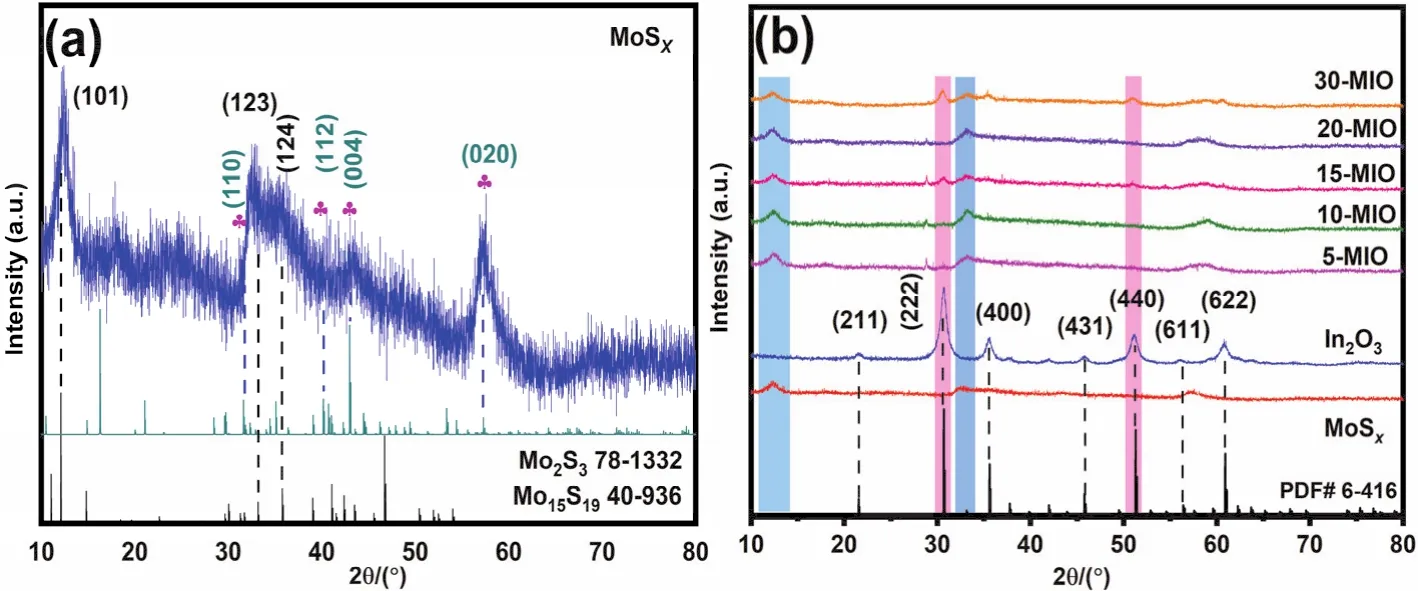
Fig.1 XRD patterns of (a) MoSx; (b) MoSx, In2O3, x-MIO.
3.2 Morphology analysis
The surface morphology of MoSx, In2O3and 10-MIO were confirmed by scanning electron microscopy (SEM) analysis.The three-dimensional layered structure of MoSxwas clearly observed in Fig.2a, which is consistent with the original experimental idea.The superposition between the sheet-like structures provides adsorption space for dye molecules while exposing more active sites.At the same time, the successful preparation of the three-dimensional structure also provides a special channel for the transmission of electrons.In Fig.2b, the In2O3shows an irregular spherical morphology with micrometers.The morphology of the composite material shows that the surface of In2O3is loaded with MoSxnanoflower.On the one hand, the existence of In2O3is in close contact with MoSxto facilitate the dispersed growth of nanoflower, and on the other hand, it forms a heterojunction with MoSxto regulate the separation and transfer of carriers (in Fig.2c).In addition, the results of EDX and element mapping show the distribution of Mo, S, In and O elements in the composite, as shown in Fig.2d, e.

Fig.2 SEM images of (a) MoSx; (b) In2O3 and (c) 10-MIO; (d) EDX and (e) element mapping of 10-MIO.
In Fig.3, the morphology of the MoSx, In2O3and 10-MIO were deeply explored by transmission electron microscopy(TEM).The nanoflower structure of MoSxcan be clearly observed in Fig.3a.In addition, the low magnification transmission pattern of In2O3is also consistent with the SEM pattern (in Fig.3b).In Fig.3c, the composite is formed by 3D nanoflowers dispersed on the surface of In2O3.Among them, the close contact between a large number of MoSxnanoflowers and In2O3is clearly observed in the yellow area.To further verify the successful preparation of the composites, a high-magnification scan of MoSxand In2O3were performed to obtain a TEM pattern containing clear lattice spacing (Fig.3d, e).In Fig.3f, the lattice spacing values at 0.25 nm correspond to the (400) plane of In2O3.In addition, the lattice spacings located at 0.73 and 0.20 nm correspond to the (101) plane of Mo15S19and the (004) plane of Mo2S3.Thereby, the successful coupling of the composites is further indicated.
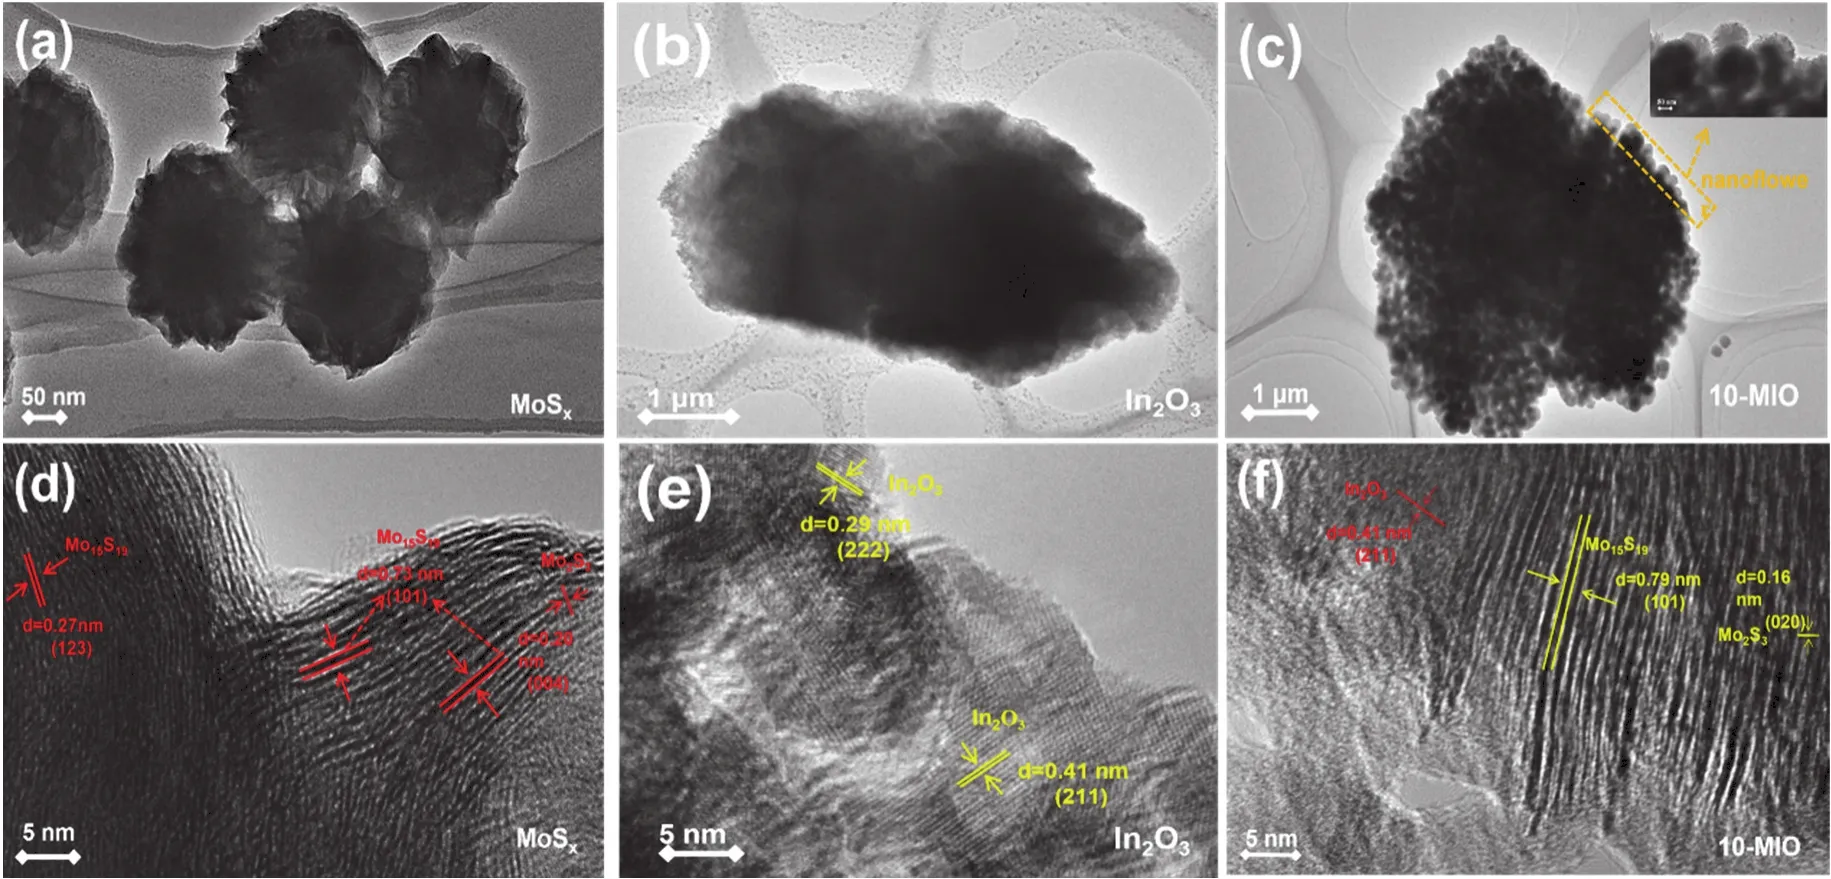
Fig.3 TEM images of (a) MoSx; (b) In2O3; (c) 10-MIO and HRTEM image of (d) MoSx; (e) In2O3; (f) 10-MIO.
3.3 X-ray photoelectron spectroscopy analysis (XPS)
XPS is commonly used to analyze the surface valence and binding energies of materials.As shown in Fig.4a, the fine spectrum of the Mo element of pure MoSxshows six peaks.The Mo element exhibits three different valence states of +4, +5 and+6.The binding energies at 228.48 and 231.56 eV belong to Mo 3d5/2and Mo 3d3/2of Mo4+26,27.The binding energies at 232.79 and 235.89 eV belong to 3d5/2and 3d3/2of the other valence band of Mo element28.In addition, the single peak at 225.43 eV can be attributed to the presence of S 2s.Meanwhile,the peak of Mo5+was detected at the binding energy of 229.37 eV29.As shown in Fig.4b, S 2p3/2and S 2p1/2are detected at the binding energies of 161.24 and 162.45 eV in the high-resolution of S element30,31.The binding energy positions of Mo and S elements in the 10-MIO are shifted to lower angular directions.In addition, there are two distinct characteristic peaks in the high-resolution spectrum of In element.In Fig.4c, the characteristic signals of In 3d5/2and In 3d3/2appear at binding energies of 444.75 and 452.43 eV32,33.In Fig.4d, the binding energy of oxygen element at 530.42 and 532.02 eV are attributed to the existence of C=O and O-H bonds34.This may be caused by the sample being exposed to the air during the test.The difference is that the binding energy of the In element in 10-MIO shifts slightly to the high-angle direction.Therefore, the change of binding energy roughly confirms the transfer direction of electrons from In2O3to MoSx.In addition, the change of binding energy in the composites also confirmed the strong interaction between MoSxand In2O3.
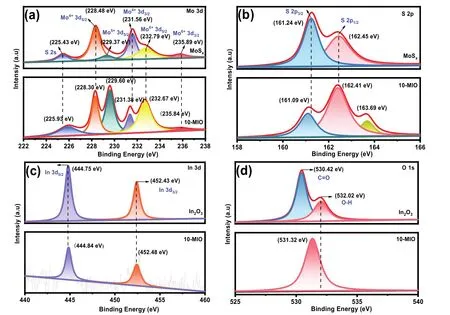
Fig.4 XPS spectra of (a) Mo 3d; (b) S 2p; (c) In 3d and (d) O 1s.
3.4 Surface area analysis
In Fig.5a-c, the curves of MoSx, In2O3and 10-MIO show typical IV curve characteristics.At the same time, there is H3 hysteresis in the curves, indicating that the material has multilayer adsorption the characteristics and is a mesoporous material35.The pore size distribution diagram of MoSxand 10-MIO in the figure shows that the pore size is distributed in 2-50 nm, which confirms the mesoporous characteristics of the materials36.The pore size distribution of In2O3is within 100 nm, indicating that there are not only mesopores but also some macropores.In Table 1,the specific surface areas of 10-MIO reaches 25 m2·g-1.The difference in average pore size between MoSx, In2O3and 10-MIO is not large.The specific surface area of the 10-MIO is slightly increased compared to MoSx.The increase of the specific surface area can expose more active sites for the adsorption of H+to generate hydrogen37.

Fig.5 N2 adsorption-desorption isotherms and pore diameter distribution curves of (a) MoSx; (b) In2O3 and (c) 10-MIO.
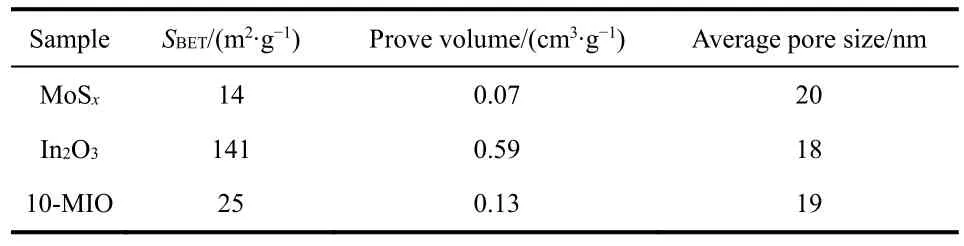
Table 1 The SBET, pore volume and average size of samples.
3.5 Hydrogen evolution experiment of photocatalyst
The photocatalytic hydrogen evolution kinetics experiment in tuitively shows the level of hydrogen evolution activity of the material.Based on the design ideas of the experiment, the hydrogen evolution experiment uses eosin Y (EY) as a dyesensitizer for related research.In Fig.6a, the optimized composite material has good catalytic activity compared to MoSxand In2O3.By changing the mass of In2O3to be 10% that of MoSx, the hydrogen evolution performance of the composite catalyst is the best (as shown in Fig.6b).In Fig.6c, 10-MIO displays the best hydrogen evolution performance under weak alkaline conditions.The alkaline of the sacrificial reagent is too strong, the internal H+is too little, and the hydrogen production power is insufficient.The production performance of the catalyst in a strong acid environment is still not good due to the protonation of TEOA38.In addition, the photocatalytic hydrogen production experiment was performed by adjusting the amount of EY, as shown in Fig.6d.With the introduction of EY, the ability of material is enhanced, which broadens the response range of the photocatalyst to light.When the dosage of EY is 20 mg, the hydrogen evolution performance of the photocatalyst reaches the highest.However, excessive EY will cover the surface of the photocatalyst due to the shading effect or the accumulation of substances produced by self-degradation will affect the hydrogen evolution performance39.Therefore, it is explored that the amount of EY has an important effect on the reaction.In addition, the durability of the catalyst is also one of its important properties.As shown in Fig.6e, 10-MIO performed a hydrogen production experiment that lasted 20 h without replacing TEOA.With fresh EY (20 mg) added in each cycle,and 10-MIO exhibited good stability.Fig.6f shows the comparison of X-ray diffraction before and after photocatalyst hydrogen production.The intensity of the diffraction peaks attributed to Mo15S19decreased significantly, but the intensities of the (123) and (124) crystal planes did not change.

Fig.6 (a) H2 evolution performances of MoSx, In2O3 and 10-MIO and (b) x-MIO; (c) the effect of pH and (d) the effect of EY on 10-MIO;(e) stability experiments for 10-MIO; (f) X-ray diffraction pattern before and after hydrogen evolution reaction.
3.6 Optical properties of the samples
The optical properties of MoSx, In2O3and 10-MIO were explored by ultraviolet diffuse reflection test.In Fig.7a, In2O3has obvious absorption band edges near 450 nm.The absorption intensity of In2O3is obviously weaker than that of MoSx, which shows that its ability to absorb light is limited.The MoSxhas the unique strong light absorption characteristics of black materials in the range of 250-800 nm.After studying the optical properties of the materials, it is found that 10-MIO has the best light absorption characteristics, which is related to the black color of the sample.The enhancement of the light-absorbing ability of the material can obtain more driving force to stimulate the carrier transition40.Fig.7b shows the band gap value (Eg) of In2O3as 2.62 eV (Eq.(1))41.The experimental value is close to that reported in the literature (2.80 eV), indicating the successful preparation of In2O3.
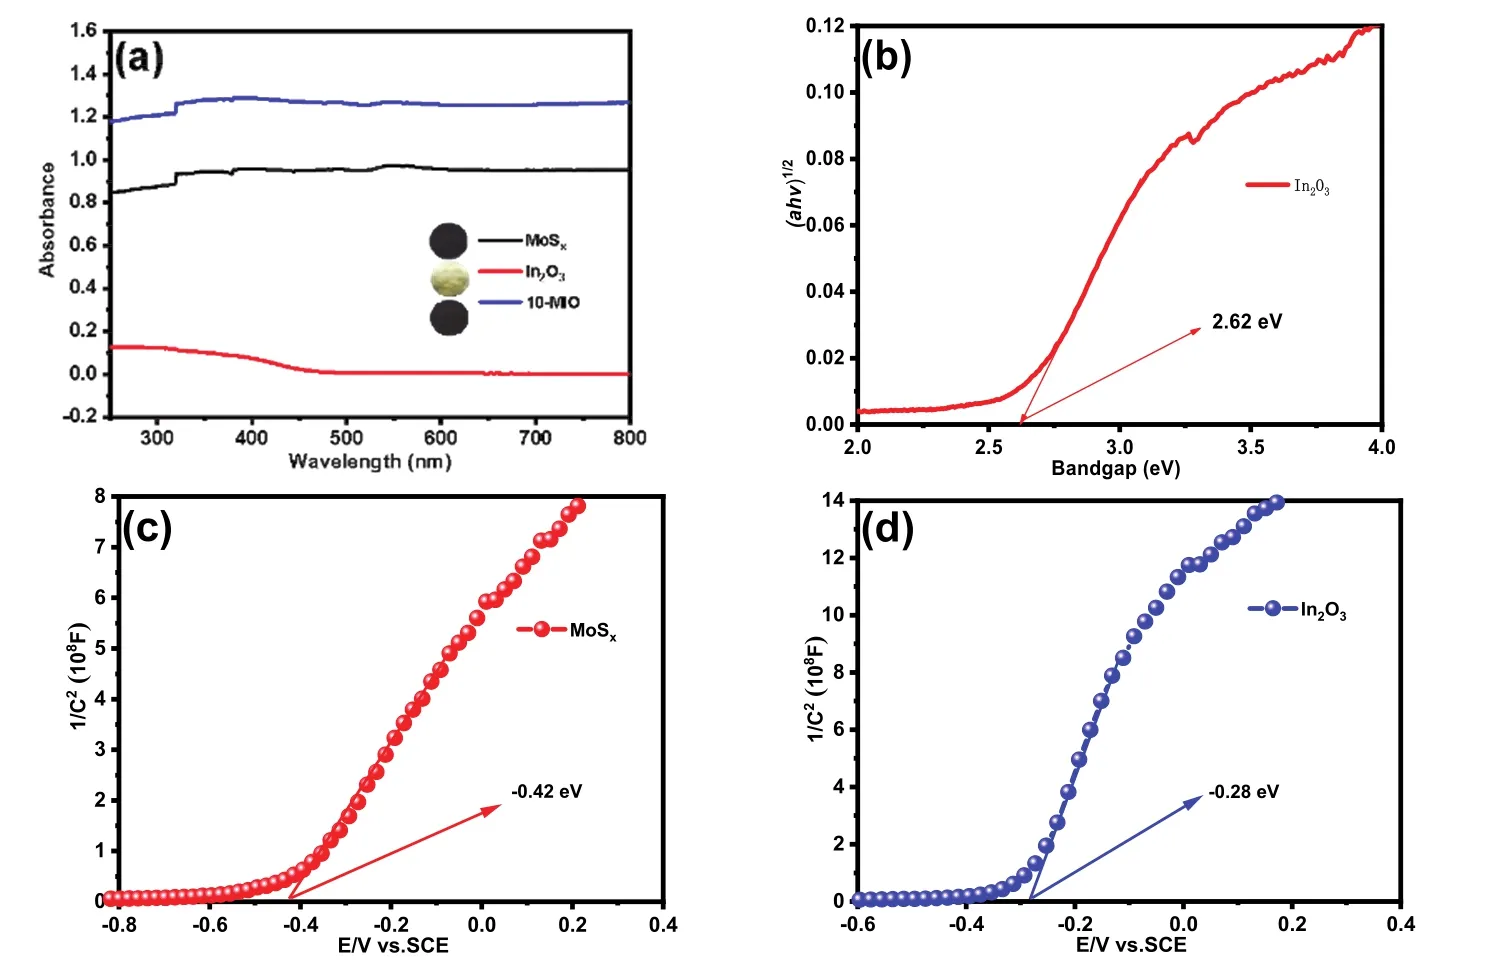
Fig.7 (a) UV-Vis diffuse reflectance spectra of MoSx, In2O3 and 10-MIO; (b) band gap value of In2O3 and Mott-Schottky plots for (c) MoSx; (d) In2O3.

aandvrepresent absorption coefficient and optical frequency;EgandAband gap energy and constant.
In addition, the Mott-Schottky test confirmed that MoSxand In2O3belong to n-type semiconductors (in Fig.7c, d)42.In addition, the Mott-Schottky results approximate the apparent flat-band potential values of -0.42 and -0.28 eV for MoSxand In2O3.In general, the conduction band position of n-type semiconductors is 0.1 eV or 0.2 eV lower than the flat band potential (Eq.(2))43.From this, the conduction band values of MoSxand In2O3are -0.38 and -0.24 eV.Integrating the band gap value and Mott Schottky test results, the following formula can be used to obtain the valence band value of In2O3as 2.38 eV(Eq.(3)).

3.7 Photoluminescence analysis
The photoluminescence analysis (PL) was used to analyze the charge separation of the sample in the EY solution (1 × 10⁻⁶).In Fig.8a, the EY solution has the strongest fluorescence intensity at the excitation wavelength of 480 nm.In particular,In2O3has a fluorescence intensity similar to that of EY solution,indicating that the internal electrons and holes are recombined seriously.In addition, the fluorescence emission peak intensity of MoSxand 10-MIO decreased significantly, and the peak intensity of 10-MIIO was the lowest.Fig.8b clearly shows that the fluorescence intensity of the EY solution dropped significantly after adding the composite catalyst, confirming the efficient separation of electron and hole pairs.The fluorescence intensity of the composites with different ratios decreased to different degrees.The charge transfer between MoSx, In2O3and 10-MIO was intensively investigated by time-resolved fluorescence spectroscopy.It can be seen from Fig.8c that the transient spectral curve of 10-MIO has a significant blue shift.The double exponential decay fitting model was used to fit the test data to obtain the decay life shown in the following Table 2.
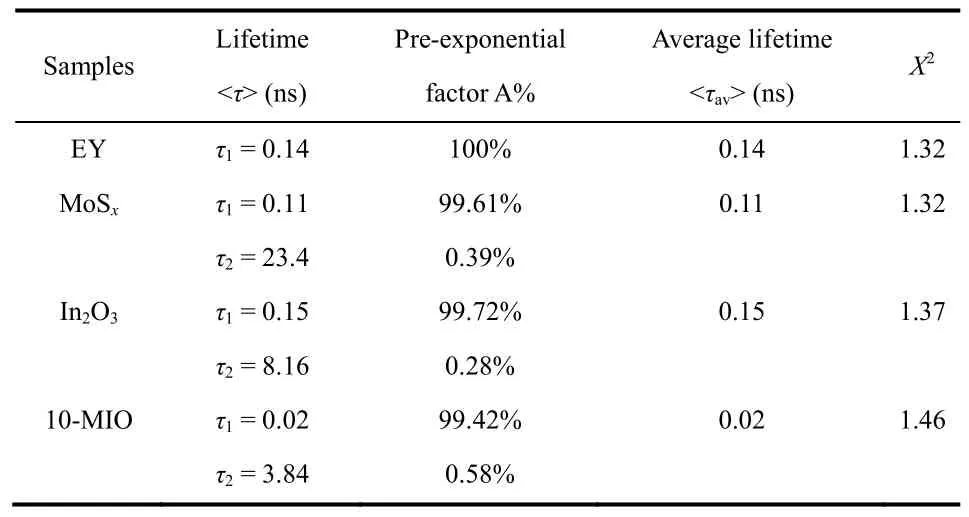
Table 2 Time-resolved fluorescence decay parameters of EY,MoSx, In2O3 and 10-MIO.
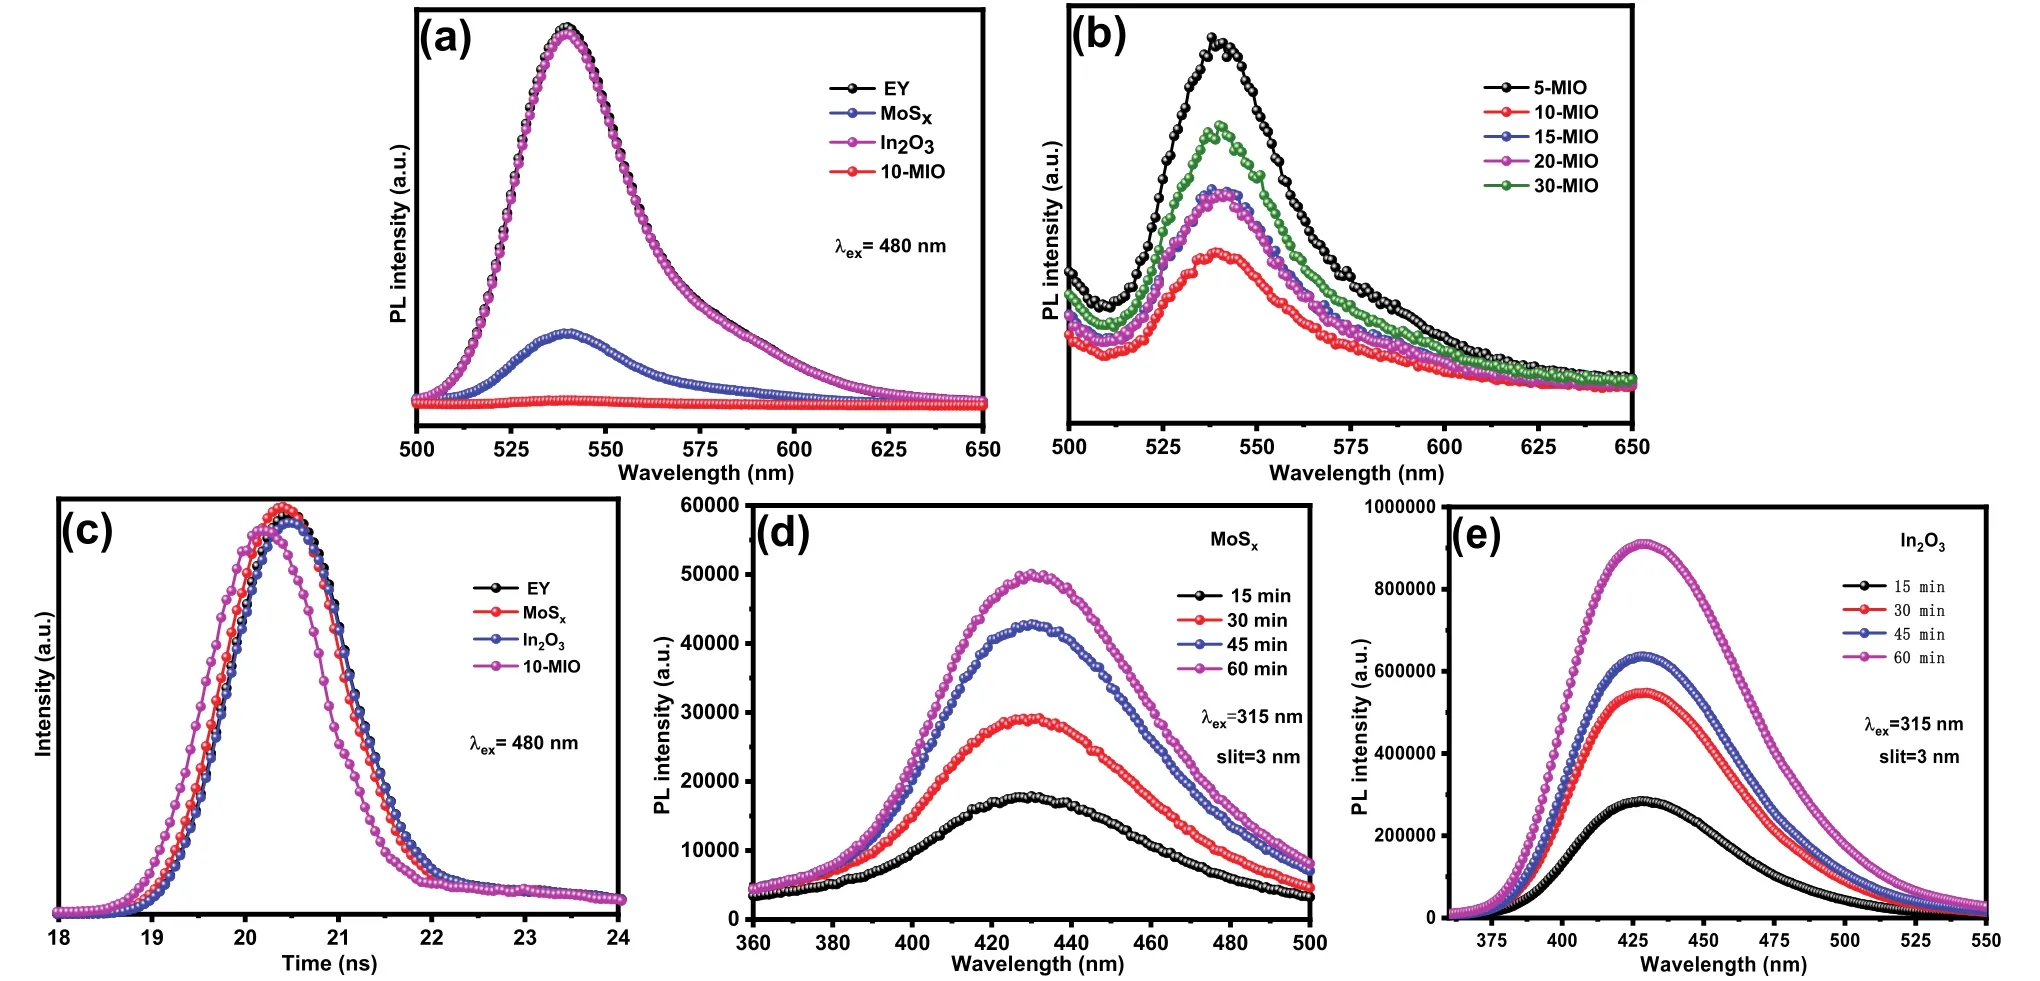
Fig.8 (a, b) PL spectra and (c) time-resolved fluorescence spectra of EY, MoSx, In2O3 and 10-MIO;(d, e) fluorescence intensity of the fluorescent species produced by different samples after 60 min.
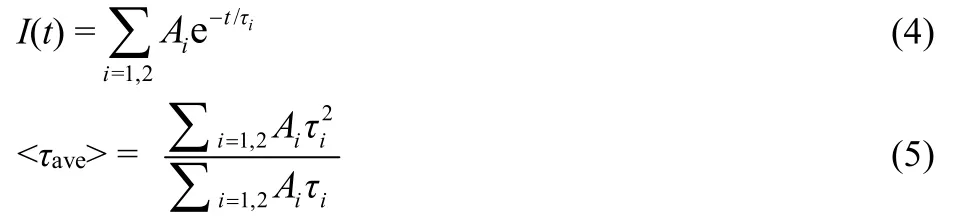
The average lifetimes of MoSx, In2O3and 10-MIO are 0.11,0.15 and 0.02 ns, respectively.Among them, the lifetime value of In2O3is close to that of EY aqueous solution, which is consistent with the fluorescence intensity in the steady-state spectrum.Theτ1 andτ2 are emission lifetimes,Ais the corresponding amplitude.The average lifetime of 10-MIO with the best hydrogen evolution performance is significantly shortened, proving that the S-scheme heterojunction accelerates the carrier transport.Among them, the small proportion ofτ2 belongs to non-radiative energy transfer, which can be speculated to play an important role in the energy transfer process44,45.As the load space of MoSxnanospheres, In2O3particles can promote the transfer of non-radiative energy and provide a non-radiative transfer path for electrons from In2O3to MoSx, which leads to the shortening of fluorescence lifetime and the quenching of PL fluorescence intensity46,47.
The oxidation ability of MoSxand In2O3were investigated by hydroxyl radical test.Terephthalic acid was used as a probe to react with free radicals to generate 2-hydroxyterephthalic acid,which is expressed in the form of fluorescence.The fluorescence intensity of the catalyst in the prepared solution (0.05 mol·L-1TA, 0.02 mol·L-1NaOH) in a certain period of time correspondsto the level of oxidation capacity48.In Fig.8d, e, the fluorescence intensity of In2O3is stronger than that of MoSxat 15-60 min.According to the above results, it can be concluded that In2O3has stronger oxidation ability.According to the following reaction mechanism, the oxidation potential of MoSx(1.68 eV) is lower than that of OH-/OH· (1.99 V) and H2O/·OH (2.34 V)39.
3.8 Electrochemical characterization
Photoelectrochemical experiments confirmed the effective improvement of the electrochemical performance of the composites.In Fig.9a, 10-MIO shows a significantly improved light response curve through the switch control of the light source.The optimal photoresponse curves of the composite photocatalyst indicate that the separation and transfer efficiencies in 10-MIO are effectively improved due to the close contact of the materials and the construction of the heterojunction.As shown in Fig.9b, 10-MIO has the smallest resistance radius, further indicating the transfer behavior of carriers49.Similarly, the overpotential of the material decreases,and the current density increases fastest due to the rapid transfer of electrons in 10-MIO (In Fig.9c).Electrochemical characterization results combined with fluorescence spectroscopy confirmed the carrier transfer behavior inside the material.
3.9 Photocatalytic mechanism over MoSx/In2O3
From this, the reaction mechanism of MoSx/In2O3as shown in Fig.10 is presumed.The whole catalytic system was carried out in TEOA solution, and the dye sensitization was used to broaden the response range of the catalyst to make it more favorable for the reaction.The conduction band and valence band positions of MoSxand In2O3are roughly obtained according to Mott-Schottky and ultraviolet diffuse reflection test, and it is found that the band position satisfies the S-scheme heterojunction50.In addition, the EY molecule transforms from the ground state to EY1*, and then becomes the excited state EY3*through the intersystem transition under the excitation of simulated light51.EY3*is reduced and quenched into EY-·by TEOA, which has strong reducing ability.Among them, a part of the electrons of EY-·are injected into the conduction band of MoSxand In2O3,and the other part of the electrons return to the ground state in a short time.Thus, the introduction of the EY dye sensitizer can promote the progress of the reaction.In addition, the electrons in the valence band of the photocatalyst migrate to the conduction band.The potential energy difference and the interaction between materials push the electrons in the conduction band of In2O3to recombine with the holes in the valence band of MoSx,and retain the electrons in the conduction band of MoSxfor the reduction reaction52.The transfer path of electrons can be confirmed by XPS and hydroxyl radical results53.Meanwhile,the holes in the valence band of In2O3can be oxidized by TEOA.
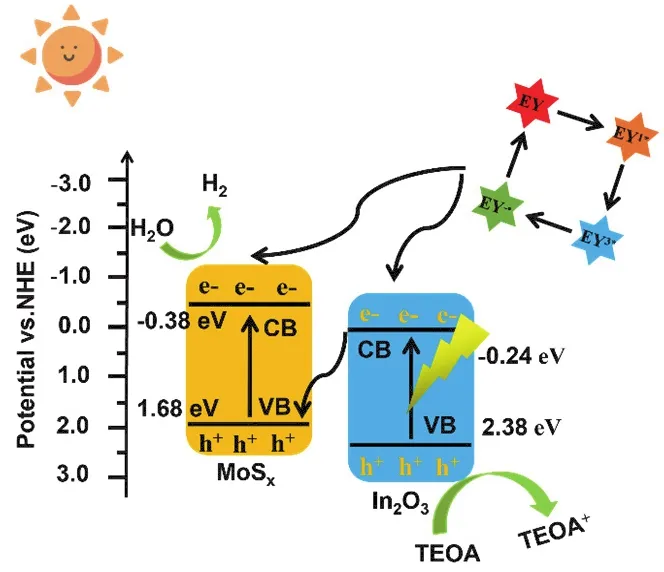
Fig.10 S-scheme heterojunctions mechanism.
4 Conclusions
In summary, the MoSx/In2O3with good hydrogen evolution performance was prepared by a facile hydrothermal method.By changing the content of In2O3in the composite catalyst, the optimized hydrogen evolution amount reached 335.21 μmol in 5 h.The successful construction of the three-dimensional nanoflower structure provides a special channel for electron transport, and the stacking of nanosheets is also conducive to the adsorption of EY.In addition, the S-scheme heterojunction constructed between In2O3and MoSxgreatly improves the weakness of low carrier separation efficiency in MoSxand In2O3.The improvement of the light absorption properties and the regulation of the carriers of the composites are the reasons for the improved hydrogen evolution activity of the materials.This study provides a new direction for improving the performance of molybdenum-based metal sulfides in the field of photocatalytic hydrogen evolution.