Surface Modification of AH36 Steel Using ENi-P-nano TiO2 Composite Coatings Through ANN-Based Modelling and Prediction
2022-10-12AnthoniSagayaSelvanDineshThakurSeemanandMaheshNaik
R Anthoni Sagaya Selvan,Dinesh G.Thakur,M.Seeman and Mahesh Naik
Abstract This study aims to analyse and forecast the significance of input process parameters to obtain a better ENi-P-TiO2 coated surface using artificial neural networks(ANN).By varying the four process parameters with the Taguchi L9 design,fortyfive numbers of AH36 steel specimens are coated with ENi-P-TiO2composites, and their microhardness values are determined.The ANN model was formulated using the input and output data obtained from the 45 specimens.The optimal design was developed based on mean squared error (MSE) and R2 values. The experimentally measured values were compared with their predicted values to determine the ANN model’s predictability. The efficiency of the ANN model is evaluated with an R2 value of 0.959 and an MSE value of 34.563 4.The authors have concluded that the developed model is suitable for designing and predicting ENi-P-TiO2 composite coatings to avoid extensive experimentation with economic production. Scanning Electron Microscope (SEM) and X-ray diffraction analysis (XRD) are also utilised to compare the base metal and optimal coated surface.
Keywords AH36 steel; ENi-P-nanoTiO2 composite coatings; Artificial neural networks; Taguchi DOE; Microhardness;Mean squared error
1 Introduction
Naval and merchant vessels operate in highly corrosive weather conditions, subjecting the ship structure and its components to linear and angular motions which simulate near design loading conditions. Due to its high yield strength and increased fatigue life, marine-grade AH36 steel is preferred for shipbuilding over traditional mild steel. This steel is used to fabricate structural components and sea suction tubes for high-capacity pumps, propulsion systems,air conditioning systems,and waterjet inlet ducts.The ship and components are alternately subjected to hydrodynamic slamming due to the vessel’s up and down motion,rapid entry and exit through wave crests,and operation against erosive sand particles. It results in the gradual deterioration of the vessel’s underwater components(Igi et al. 2005;Anthoni et al. 2022). So fabricating the entire marine component with the ideal properties is prohibitively expensive.Instead,heat treatment,surface modification,and alloying have been used to hide flaws and improve surface properties. Surface modification by deposition is the most practical and economical option when all of these processes are considered due to their uniformity. Coatings would also improve hardness, reduce friction, increase wear resistance, and resist corrosion (Fotovvati et al. 2019).The electroless coating has garnered considerable attention among the various surface coating processes due to its numerous unique advantages,including a less expensive process (Wen et al. 1999), the ability to deposit over complex shapes and dimensions, and adhere to non-conductive surfaces(Pancrecious et al.2018).
Numerous researches have been conducted to investigate the various combinations of TiO2. However, the search for ways to improve the quality of electroless coatings was never limited to the addition of a second phase.Additionally, maximizing the benefits of nanoparticles in the electrolyte depends on their dispersion stability in the bath during the deposition process.As a result, surfactants are considered necessary in the bath to fabricate high-performance coatings against corrosive and wear environments. Choosing a suitable surfactant is crucial for a better deposition with decent nanoparticle distribution and no agglomeration.Surfactants also improve the wettability and electrostatic attraction of the nanoparticles, increasing their stability(Ger and Hwang 2002).The effects of surfactants(anionic/cationic) on electroless deposits to improve mechanical and tribological properties have been studied in several studies.Surface properties are evaluated by comparing microhardness measurements of the various coated surfaces.It is a cost-effective method for determining and evaluating a material’s overall mechanical properties. It is a nondestructive, rapid method for determining the compatibility of semifinished, assembled, and intermediate components/surfaces with the designed parameters (Zhang et al.2011). Its precision, repeatability, and reciprocity with indentation geometry define microhardness measurement.The microhardness is determined by the indenter’s diagonal length and the sensor’s measurable ranges. Establishing the exact locus intender impression requires better lighting, optimum resolution through precise calibration,and a superior image. Improper lighting and magnification caused errors(Vander Voort and Fowler 2012).Indentation size effects also play a role in changing test results on a material surface over a range of loads (Gerberich et al.2002).Additionally,the relationship between the input process factors and the resulting output is multifaceted and complex, making exact analytical expressions impossible to deduce.Finally,determining the microhardness of fabricated thin deposits is a time-consuming, expensive, and highly skilled procedure (Shozib et al. 2021). Previously,the influence of process parameters was demonstrated and their relationship to achieving optimal output parameters such as microhardness, deposition rate, and coating thickness using DOE(Gadhari and Sahoo 2015;Muraliraja et al.2014).
Machine Learning (ML) based design and production is gaining popularity in manufacturing due to its adaptability and efficacy. Moreover, Artificial Intelligence (AI) algorithms rely heavily on material properties, necessitating the connection between input parameter attributes and their target properties. (Swetlana et al. 2020). It can perform multipurpose optimisation and prediction tasks with massive datasets and many independent variables (Golnaraghi et al.2019).Machine learning is based on the fundamental concept of learning the effective patterns from the input data,and it can generate a rigorous model through mapping. Using machine learning approaches, higher orders of magnitude can be gained in predicting any material property by employing high-dimensional data. It is capable of deducing unknown primary characteristics such as hardness (Wen et al. 2019), thermal conductivity (Juneja et al.2019),and glass transition temperature in the field of material science (Jha et al. 2019). Previously, ML algorithms efficiently utilised and accurately predicted material hardness, halving experiment time and cost (Liu et al.2017). A recent review found a significant increase in adopting Artificial Neural Networks (ANNs) in electroless coatings and adopted the ANN model to predict electroless plating rate and phosphorous content (Yating et al. 2008).Using ANN simulation, the researchers successfully designed and reported a low-constituent high-efficiency bath(Beygi et al.2012).Using a dual hidden layer network,the researchers have succeeded in predicting phosphorus content in an electroless bath (Vaghefi and Vaghefi 2011).Similarly, the phosphorus content of coatings is estimated and reported using a particle swarm optimization model(Zou et al. 2020). Recent research has compared the accuracy of four artificial intelligence models for predicting microhardness in coatings. On the other hand, the process of choosing the number of neurons in each layer and tuning its hyperparameters is not explored and reported (Shozib et al.2021).However,few recent studies have begun to investigate and demonstrate the significance of optimal hyperparameters.By comparing the test results of default hyperparameters with those of tuned hyperparameters (Mantovani et al. 2015), the authors have proved the earlier findings that proposed that tuning hyperparameters is far better than picking an algorithm (Lavesson and Davidsson 2006).Even though the previous research emphasised individual hyperparameters and their interactions with the ANOVA framework, The approach was limited by its inability to identify the primary tuning parameter (Van Rijn and Hutter 2018). However, it is demonstrated unequivocally that hyperparameter tuning could significantly improve the overall performance of ANN algorithms (Probst et al.2019).
This research investigates the novel deposition of ENi-P-nano TiO2on the marine grade AH36 steel to improve its hardness and performance against the marine environment using Taguchi L9 orthogonal design. In electroless coating,the quality and performance of ENi-P coatings depend upon various process parameters. Hence, improving the substrate hardness relies on the contribution of process parameters like bath pH, temperature, weight concentration of nano TiO2, and C14-SB surfactants. However, obtaining higher microhardness on the fabricated coatings can only be achieved through extensive experimentation with various parameter combinations.Hence fabrication of optimal coated surfaces through newer combinations without knowing their output values through the trial and error method is not recommended due to its time consuming and higher manufacturing cost. In such a situation, an ANN-based algorithm is proposed to be used to fabricate the electroless coatings. Therefore, this optimal ANN based prediction of microhardness on Taguchi designed ENi-P-TiO2hopefully will contribute to a deeper understanding of the significance of each input parameter towards achieving the targeted mechanical property. In addition, the authors have tuned the hyperparameters with Python-specific coding and formulated the optimal hidden layer parameters with respect to the least Mean Squared Error (MSE) values, which have not been previously reported in similar studies. As a result, the accuracy of the developed ANN model was finally validated using experimental results. Also, the chemical composition of identified samples was probed through Energy Dispersive Spectroscopy(EDAX)and X-Ray Diffraction(XRD)analysis.
2 Materials and methodology
2.1 Base metal
The base material was marine grade AH36 steel, which conforms to the ASTM A131 standard.The substrate’s elemental composition and mechanical parameters are listed in Table 1 and Table 2.

Table 1 Elemental analysis data of AH36
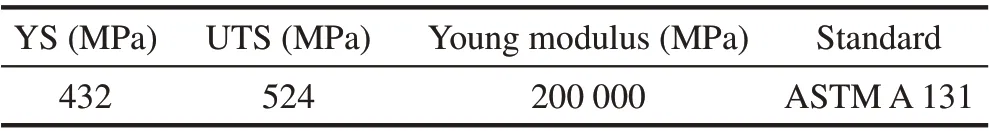
Table 2 Mechanical properties of AH36
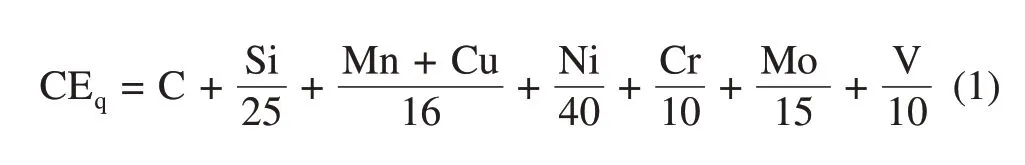
According to Duren(1990),the substrate’s carbon equivalent content(CE)is deduced.
All the specimens were prepared with the dimension of 25 mm × 25 mm × 5.85 mm from a single steel plate that had been officially certified for shipbuilding by the Indian Register of Shipping. The samples were ground and polished up to 2 000 grit SiC sheets.The glossy substrates are subjected to a pre-treatment process that includes 10 minutes of ultrasonic cleansing with acetone, 2 minutes of immersion in ethanol, and 1-minute soaking in a 10% sulphuric acid for picking.Then,the samples are thoroughly cleaned with DM water in between the pre-treatment activities and before dipping the substrate in the deposition process.
2.2 Bath preparation and deposition
Table 3 lists the chemical composition of the ENi-P bath. NiCl2·6H2O and NaH2PO2·H2O are used as nickel sources and reducing agents in the Electroless electrolyte.The complexing element is C6H5Na5O7·2H2O. Additionally, buffering agents such as ammonium chloride (NH4Cl)and ammonia (NH3) were used to maintain a constant pH in the deposition bath throughout the deposition process.The ENi-P matrix was co-deposited with nano TiO2powder (Make: Sigma Aldrich, Size-70 nm). In the electroless bath,zwitterionic surfactant 3-(N,N-Dimethylmyristylammonio) propanesulfonate, (C14-SB surfactant) propane sulfonate is mixed to minimize surface tension between the bath and nano TiO2for enhanced particle absorption into the coated surface. Nano TiO2and surfactant slurry are agitated for 20 minutes using ultrasonic dispersion before the full bath is stirred at 100 r/min for the deposition period to minimise the agglomeration of nano TiO2particles(Gadhari and Sahoo 2016). The 45 specimens are coated with different ENi-P-TiO2composites per Taguchi L9 orthogonal model combinations with five sets of replication to obtain accurate ANN training and testing data.In addition,the previously reported optimised bath loading of 0.5 dm2/L is used to accommodate the specimen size of 25 mm ×25 mm × 5.85 mm (Taheri 2003). The nano TiO2powders were weighed before adding to each electroless bath usingan electronic digital scale with 0.000 1 g accuracy.
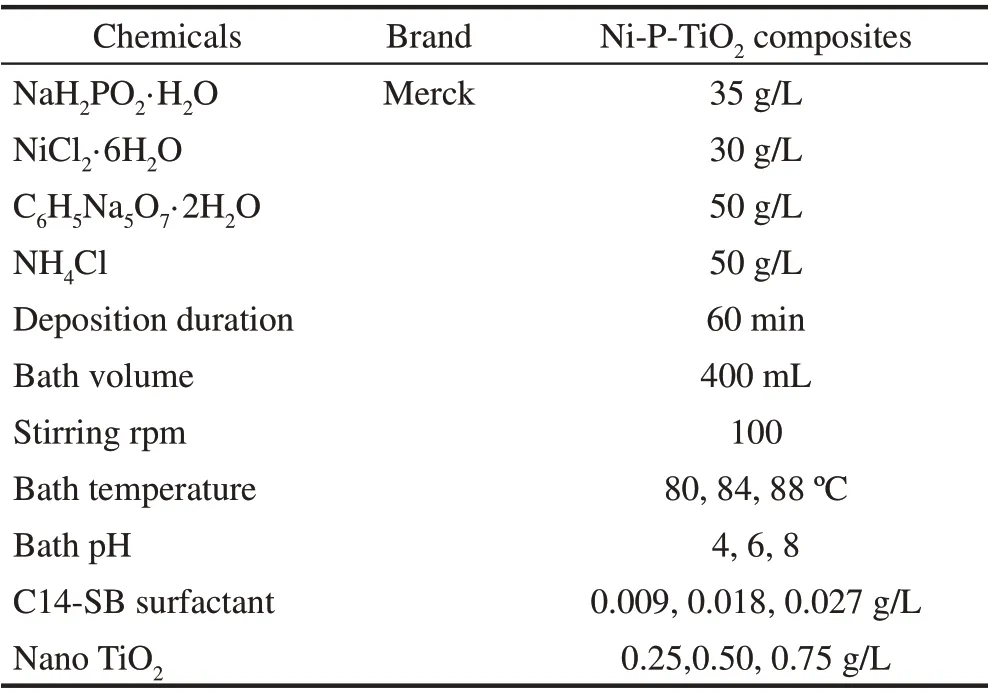
Table 3 Bath constituents and their parameters
2.3 Measurement of microhardness
Vicker hardness tester (Make: M/s Shimadzu (Asia Pacific) Pvt Ltd. Singapore, Model: HMV-2T) is utilised to gauge the microhardness of each coating. All indentation was performed with a 200 g force load at 50 µm/s and 10 second dwell time. Furthermore, all indentation was observed above 1/10th of the coating thickness, indicating that the base metal had no contribution(Bückle 1959).The average values of 5 readings from each coating are considered for the specimen’s microhardness value and tabulated in Table 3.
2.4 Experimental design and datasets
Figure 1 depicts the schematic diagram of an adopted neural network. The model comprises three layers, 1) input layer where input data is passed through,2)hidden layer with three layers and nodes, and 3) output layer. Each node in the layers gets an input signal from various previous neurons,multiples with assigned weights and bias,and applies some activation function. In ANN, the number of hidden layers and nodes in each layer plays a significant role in determining the ANN’s performance. The hidden layer size and quantity selection solely depend on the designer’s expertise and the nature of the problem (Srinivasa Pai et al. 2008). Normalising input data between 0 to 1 is considered the primary function in modelling the neural network. Determination of output data is regarded as the last step in the ANN.The former activity is for magnifying sensitivity to achieve network accuracy. The latter determines the actual desired values and absolute simulation errors (Beygi et al. 2012). Finally, the error signal is estimated and backpropagated from the output layer to obtain low loss or error signals to adjust the weights and biases.Backpropagation with gradient descent or Adam optimisers is currently being used to train neural networks in prediction analysis and other applications (Srinivasa Pai et al.2008).
The simulation study on input process parameters and their response (Microhardness) was performed using Python software and an ANN in a TensorFlow environment. Furthermore,the desired response parameter is to attain maximal coating hardness from the experiment.As a result, the ANN model is trained and tested using the microhardness values obtained through the experimental design shown in Table 3. Finally, the ANN model predicts an unknown microhardness value for proposed coatings designed using various newer combinations of the input parameters used to train the network.
The initial experimental data sets are used to train the model to understand the ANN architecture process. The correlation-based ANN model architecture is comprised of four critical steps. 1) Data acquisition, 2) Conceptualization and composition of the relevant ANN model,3)Weights and biases setting, and 4) Model training and validation.Backpropagation Neural Networks (BPNNs) were used in this simulation to predict and synthesise an optimal electroless ENi-P-TiO2deposit on marine grade AH36.
The neural network began the training process with random weights and continuously adjusted the weights to achieve the minor loss function from the training set.Additionally, the validation function optimises the ANN architecture by adjusting the activation function, the training function, the number of hidden layers, and the number of neurons in each hidden layer.Finally,the test set evaluates the trained model’s performance and effectiveness. The ANN hyperparameters are chosen to minimise the mean square error.A network with an input layer with four variables,single output,and three hidden layers are selected as a suitable model for this prediction analysis.
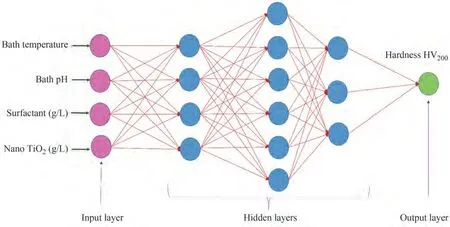
Figure 1 ANN model architecture
Table 4 summarises the raw data. First, it is utilised to train and evaluate the ANN simulative model to predict the proposed coating combinations target value (microhardness).Then,using the optimal values of nickel source,reducing agents,bath loading,and stabilising agents determined by prior research, the coating parameters were finalised(Taheri 2003).
2.5 Bath composition analysis
Still,the process behind the electroless deposition occurring in the hypophosphite bath is not thoroughly understood. However, the arguments between the proposed mechanism and the atomic hydrogen and electrochemical mechanism were mainly accepted.Electroless Nickel coating occurs in microwells, altering anodic cathodic polarity on the substrate surface, conforming to the electrochemical mechanism.The relevant anodic and cathodic reactions are illustrated as follows:

From the above equations,nickel deposition is generally accompanied by evolving of hydrogen ions (H+), molecular hydrogen (H2), and the oxidation of hypophosphite to phosphate (Agarwala and Agarwala 2003; Mallory 1990;Reidel 1991). In an electroless deposition, the predominant properties of the coated layers are dependent on electroless bath compositions (Sahoo and Das 2011). However,because the process’s influential variables are non-linear and exhibit complex effects during the coating process, a reliable neural networks analysis model in the electroless deposition as a function of bath composition parameters is required. The four newer combinations with the optimal nickel source, reducing agents, and stabilisers are determined based on previous findings by various authors and are maintained constant throughout the deposition process for all combinations. This experimental cum simulation study was determined to identify the contribution effect of very rarely studied zwitterionic surfactant and nano TiO2powder in the composite electroless bath.
Previously,the ANN model was used to predict the plating rate based on the nickel source, reducing agent, and complexing agent composition of the bath. However, in this study, the bath temperature was set between 80 and 90 ℃,and the pH range was set between 4 and 8 to achieve the combined benefits of maximum deposition and increased phosphorous content, as demonstrated by previous findings (Reidel 1991). Additionally, previous research established that nickel concentration and the Ni++/H2PO2-ratio were the significant factors for a higher deposition rate.Consequently, the ratio was set to an optimal value of 0.45, and the nickel chloride concentration in the bath was adjusted to 30 g/L for the best deposition rate, as determined by a previous report(Taheri 2003).
2.6 Process parameter and ANN model
According to Table 4, the optimal bath composition for maximum microhardness in the ENi-P composite surface coated with the bath temperature of 80 ℃,pH 8,0.027 g/L zwitterionic surfactants 0.75 g/L nano TiO2. A neural network architecture was used to model the ENi-P-TiO2composite deposition as a function of electroless process parameters. The four process parameters are fed to the ANN input neuron as input data, and the corresponding microhardness values of each sample were taken as a single output parameter.The measured hardness and the corresponding input parameters are used to train the ANN model to device the neural network to facilitate prediction analysis.Figure 1 displays the conceived ANN architecture to predict microhardness for ENi-P-nano TiO2coatings. Figure 2 reveals the comparable regression graphs between predictedand tested values distinctly.According to Table 4,the optimal bath composition for maximum microhardness in the ENi composite surface coated with the bath temperature of 80 ℃, pH 8, 0.027 g/L zwitterionic surfactants 0.75 g/L nano TiO2was identified as the optimal process parameter composition.An ANN architecture was used to model the deposition of ENi-P-TiO2composites as a function of four electroless process parameters and shown in Table 5.When the four process parameters are fed into the ANN input neuron,the microhardness values of each sample are taken as one output parameter.The measured microhardness and the corresponding input parameters are used to train the ANN model and simulate the design to facilitate prediction analysis.As shown in Figure 1, the proposed artificial neural network architecture is used to predict microhardness for ENi-P-nano TiO2coatings.
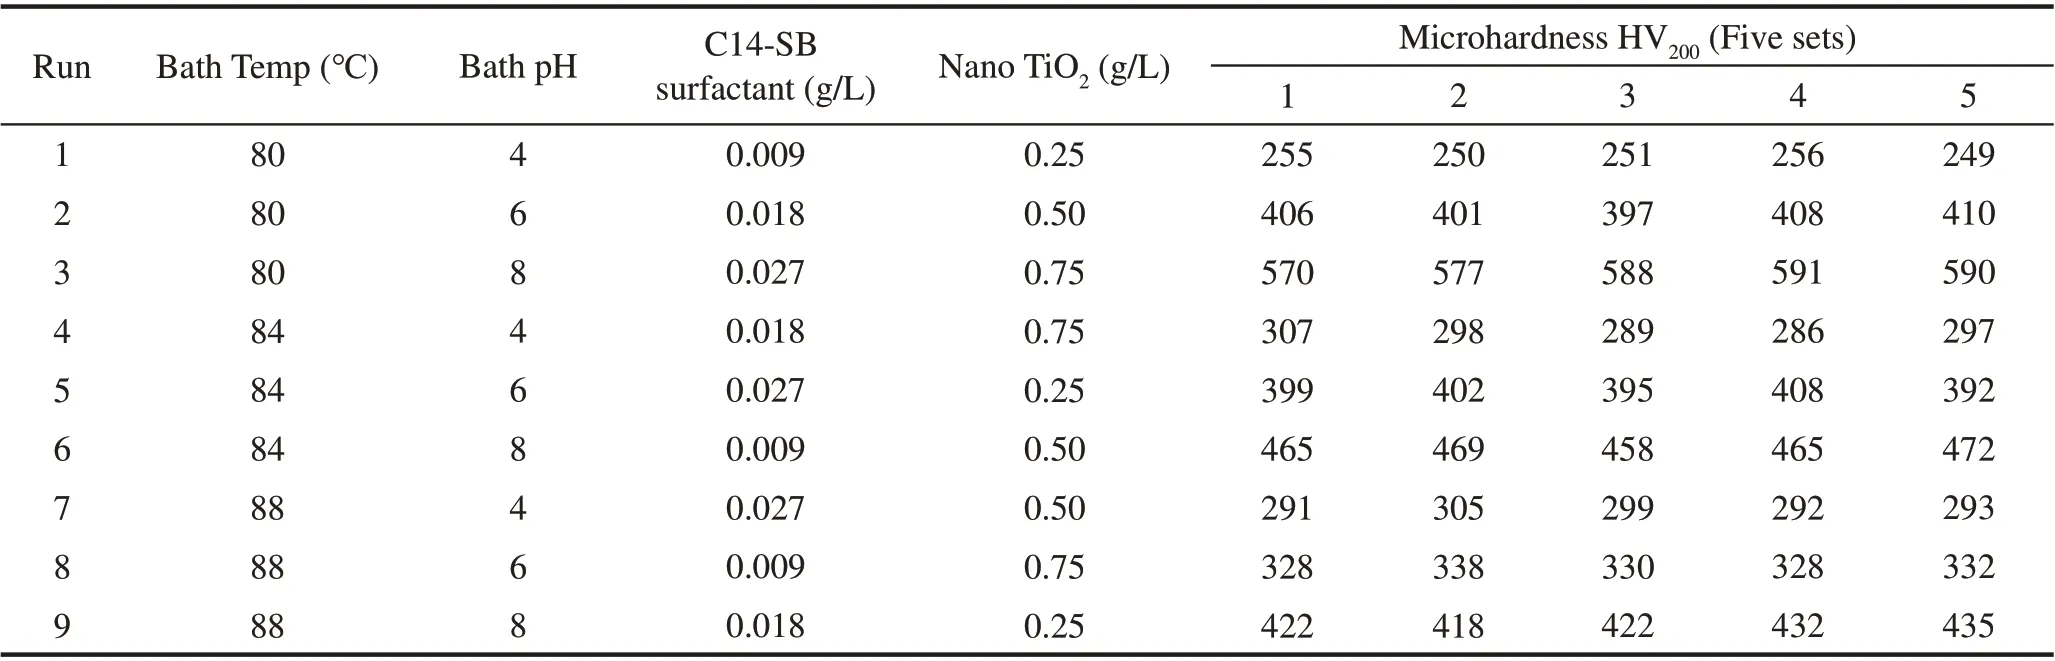
Table 4 Design of experiments and datasets

Figure 2 Model loss vs.epoch

Table 5 ANN model specifications
An artificial neural network was developed to predict the microhardness of ENi-P-TiO2coatings using the Python programming language and the Keras library. The ReLU function is used as an activation function in this ANN architecture. The equation depicts functions based on the ReLU algorithm.

2.7 Hyperparameter tuning
The various primary parameters required for the formulation of ML algorithms are deduced through training.Furthermore, unique ML algorithms are constructed so that the initialization of the learning process necessitates the input of a few primary parameters. These parameters are called hyperparameters (Mantovani et al. 2015). The optimal hyperparameters typically determine the learning performances of the majority of algorithms. As a result, the hyperparameters must be fine-tuned to achieve a better learning process.However,tuning is a costly computational process that exaggerates as the search space expands.
The various ANN hyperparameters configuration were analysed separately,and the Keras tuner identified the optimal combination. The optimised parameters are then used in the formulated ANN network to improve prediction capability. Finally, the predicted microhardness values from the trained ANN model are compared to the experimental results to validate and assess the accuracy of the ANN model developed for this prediction analysis.
2.8 Evaluation of ANN model
Model accuracy evaluation is necessary for machine learning models’ configuration to determine their production capability.In regression studies,the mean squared error andR2(correlation coefficient)are used to estimate the prediction error rate and model’s effectiveness.The MSE represents the difference between the original and predicted values as determined by the data set’s average square difference. TheR2value indicates how close the measured values are to the predicted values.Members denote its percentages with a value between 0 and 1.The greater the value ofR2,the more predictive capability the model does have.
3 Results and discussions
3.1 Effectiveness of ANN model
In the current implementation of the ANN model, 25%of the derived data set is used for testing and 75%for training. When the loss of test data increases, the model is designed to cease further interaction to avoid overfitting the data. Due to overfitting, the current ANN model process required 500 epochs before it was decided to stop training due to increasing test data loss. The loss progression over time is depicted in Figure 2 for both test and training data.The mean square error of the loss and the mean absolute error of the tuned ANN model are 34.563 4 and 4.45, respectively,for testing and training data.
The effectiveness of the developed ANN model was determined using the built-in simulation. Figure 3 compares test and predicted values for randomly selected(25%)data sets. The trend line between the test and predicted values demonstrates unequivocally superior effectiveness of the formulated ANN model.

Figure 3 Test vs.prediction values of ANN model
3.2 Confirmation test
Conformational experimentation was used to validate the effectiveness of the formulated ANN prediction model with a newer set of input parameters. Hence, the newer combination suggested by the Taguchi DOE was utilized to analyse the effectiveness of the ANN model for unknown input parameters.Accordingly,Table 6 summarises the proposed parameters and their levels for prediction analysis.A new Taguchi L9 orthogonal array was designed to monitor bath temperature change. The intermediate intervals of bath pH, the weight of surfactant concentration,and TiO2were simulated using an ANN model,and minimal variation in their microhardness values was observed.However, when the bath temperature was varied by two degrees between 80°and 88°,a significant change in the microhardness value was observed.As a result,only the bath temperature is considered in the confirmation test simulation.

Table 6 Process parameters and levels for confirmational test
The substrates for confirmation test specimens are fabricated from AH36 steel with the same heat number.Therefore,all of the chemicals used in the initial deposition and validation coating are of the same make and batch, and the experimental conditions are identical. Table 7 compares the microhardness predicted by the ANN model to the microhardness values measured on experimental validation samples.
The ANN model proficiency was assessed based onR2and MSE values (Golnaraghi et al. 2019), as summarised in Table 7 for the tuned ANN model.In addition,the comparison of predicted and experimental microhardness values reveals that it is best suited for predicting hardness values of ENi-P-nano TiO2composites coatings. In addition,Figure 4 depicts the comparison of regression graphs between predicted and tested values in greater detail, along with itsR2value and Regression formula. It is clear from the calculatedR2value of 0.959 that the proposed ANN prediction model can accurately predict the microhardness of ENi-P-TiO2coatings fabricated on AH36 steel for the newer coating designed using a newer combination of the four input process factors discussed in this work. However,prediction is restricted to the minimum and maximum values of the four input variables.

Figure 4 Graph between test vs.predicted microhardness values

Table 7 Comparison of microhardness values predicted vs.measured
3.3 Theeffectsofelectrolessbathprocessparameters
In this study,the effects and contributions of process parameters and their significant contributions to enhancing the hardness of the coated surface were investigated.As a result of the information compared to Table 7,the contribution effect of input parameters on microhardness is understandable.At the same time, to comprehend the effects of bath temperature on the microhardness of the coating, it is necessary to compare the deviation between predicted and achieved microhardness values of the designed coatings.As a result,the achieved microhardness value for Run 3 in Table 7 is 559 HV200,which is lower than the predicted value of 572 HV200. Except for the bath temperature, all other input parameters such as bath pH, surfactant weight addition, and nano TiO2are identical (i.e., bath pH 8, surfactant and TiO2concentrations are 0.27 g/L,0.75 g/L,respectively). However, the microhardness value for Run No. 3 in Table 7 is lower than the microhardness value for the coating synthesised at 80 ℃with identical remaining bath combinations and previously used for ANN model training and tabulated in Table 4.
Furthermore, the maximum microhardness value is obtained at 80 ℃,indicating that bath temperature is a determinant factor in achieving significantly greater microhardness in ENi-P-TiO2composite coatings.It can be easily observed in Figure 5, which is consistent with previous findings (Beygi et al. 2012). The experimental validation data are tabulated in Table 6, and the graphical representation of bath pH vs. microhardness is depicted in Figure 6. The higher microhardness value is observed on coatings synthesised at bath pH 8 only from both representations.

Figure 5 Effect of temperature vs.microhardness

Figure 6 Effect of bath pH vs.microhardness
When the microhardness values of specimens fabricated with pH 4 and 6 are compared, the Run No. 3, 6, and 9 from the pH 8 set have the highest microhardness, i.e.,559 HV200and 505 HV200,428 HV200,respectively,than the run fabricated with pH 4 and 6. Simultaneously, the optimal microhardness value obtained for the composite coatings and used in the training of the ANN model is pH 8.Thus, the experimental and predicted data fully support the current findings regarding electroless bath pH, which is also critical in achieving the microhardness value in ENi-P-TiO2coatings. Typically, alkaline baths reduce the phosphorous content of the coating. However, due to the coating forming a single phase, the maximum bath hardness can be achieved with a low phosphorous weight content. Additionally, an EDAX micrograph of the coatings was used to evaluate and confirm these findings, consistent with the earlier findings(Duncan 1996).
The following findings are concerned with adding zwitterionic surfactant in the electroless bath. The data mentioned in Figure 7 suggests that the highest microhardness value achieved in experimental runs 3,6 and 9 are fabricated with 0.027 g/L of C14-SB surfactants in the coatings.It is due to the fact that the addition of C14-SB surfactant improves the Nickel deposition along with the deposition of TiO2particles (Zhang and Somasundaran 2006). Therefore,from the experimental results,the maximum hardness of the coating is achieved with the addition of 0.027 g/L zwitterionic surfactants in the electroless bath, which corroborated with the previous findings(Muraliraja et al.2016).

Figure 7 Effect of C14-SB zwitterionic surfactant vs.microhardness
3.4 Morphological analysis and phase evolvement

Figure 8 SEM image and EDAX micrographs of the optimal ENi-P-TiO2 coating
Figure 8(a)reveals the SEM image of the optimal coating of Run No.3(Set No.4)from Table 3.The addition of the zwitterionic surfactant at its CMC level resulted in the formation of globules in the deposition.In addition,the deposition surface was observed with minimal surface cracks and better disbursing of TiO2in the ENi-P matrix.It is due to the formation of the monomer layer, which is inherent in both positive and negative head groups, enhancing the nickel deposition in the surfaces due to the combinative attractive and repulsive forces. Furthermore, the additional attractive force present in the negative head due to Sulphonic groups attracts more Ni particles towards the substrate, and a better Ni-P matrix is formed during the deposition process. Further, at the CMC level, the TiO2is also get deposited into the Ni-P matrix, which enhances the hardness of the coated surface on the optimal specimen.The same was corroborated with the earlier reports (Muraliraja and Elansezhian 2014). The EDAX micrographs shown in Figure 8(b) also reveal Ni, P, and TiO2content on the coated surface.
Figure 9 shows the phase and comparative analysis of the substrate (AH36) and the optimal ENi-P-TiO2coating surfaces based on XRD plots. The visible Fe7C and Fe3C peaks are from the AH36 steel substrate material from the combined XRD graph. Similarly, the reduced intensity of the identical phase peaks is visible on the optimal coated surface.The ENi-P-TiO2deposition over the base material surface causes a reduction in peak intensity from the available ferrous phases from the coated surface. Because only very thin(in microns)deposition is available,total diffraction of the base material surface is unavoidable. The ENi-P-TiO2surface also showed the presence of Ni,P,and TiO2phases, and the same can be corroborated by the available EDAX micrographs shown in Figure 8(b). However, individual phase peaks are not visible due to the overlapping of the amorphous surface and intermingling of the phases in the coated surface due to using C14-SB surfactant in the electroless bath.
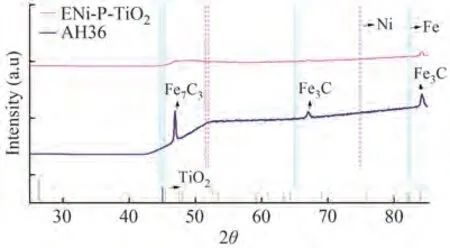
Figure 9 XRD plots of substrate AH36 and optimal ENi-P-TiO2 coating
4 Conclusions
The various process variables determine the coated surface’s elemental composition and mechanical properties in the electroless coating.Additionally, the design and identification of optimal surfaces fabricated with electroless Ni-P-nano TiO2coatings on AH36 steel surfaces require many fabrication and analytical experiments. This paper examined the viability of using an ANN-based prediction model to achieve optimal ENi-P-TiO2coating at a low cost. Furthermore, the authors also discussed hyperparameters and utilised a separate algorithm to determine optimal values.Observing the results of this study,it is evident that the input process factors have contributed to a significant effect on the hardness of coated surfaces.
Furthermore, this study enables us to predict the hardness of the newer Ni-P-nano TiO2coatings by employing the ANN-based prediction model, and the most cost-effective design can be manufactured economically and more efficiently. Nevertheless, the performance of ANN-based prediction models can be improved by providing additional details as input variables other than the discussed input process factors,such as the elemental composition of phosphorous, nickel in future research. The authors also suggested that future ANN-based prediction modelling could include the formulation of multi-input and multi-outputbased models to achieve a more accurate prediction model for electroless coating in the surface modification field.
AcknowledgementR.Anthoni Sagaya Selvan, one of the authors,would like to express gratitude to DIG Aedavalli Amarender Reddy,Chief Staff Officer (Tech), CGC (Eastern Seabaord), Indian Coast Guard,Visakhapatnam,India.Without his motivation,nurturing,and active participation in all aspects of the author’s life, it would not have been possible to successfully complete this study.
杂志排行

Journal of Marine Science and Application的其它文章
- Numerical Investigation of the Effect of Surface Roughness on the Viscous Resistance Components of Surface Ships
- Deconvolved Beamforming Using the Chebyshev Weighting Method
- Optimization of Gas Turbine Exhaust Volute Flow Loss
- Overview of Moving Particle Semi-implicit Techniques for Hydrodynamic Problems in Ocean Engineering
- Numerical and Experimental Investigation of the Aero-Hydrodynamic Effect on the Behavior of a High-Speed Catamaran in Calm Water
- A Quick and Practical Approach for Concept-design of Submerged Thin-walled Stiffened Cylinders