喹啉-2-甲醛缩4-氟苯基氨基硫脲Cd(Ⅱ)/Fe(Ⅲ)配合物的合成、晶体结构和DNA结合性质
2022-09-16李晓红吴现为吴伟娜
李晓红 吴现为 王 元 吴伟娜*,
(1河南理工大学化学化工学院,焦作 454000)(2河南理工大学建筑与艺术设计学院环境设计系,焦作 454000)
Schiff bases have been widely used in biological,medical,agricultural,industrial,and even architectural fields as anti-rust agents[1-5].Particularly,as one type of Schiff bases,thiosemicarbazones(TSCs)and their metal complexes have attracted much attention due to their wide range of pharmacological effects,such as antibacterial,antiviral,antifungal,and,most intriguingly,antitumor activity[6-7].Several TSCs derived from quinolin-2-aldehyde acted as not only iron chelators but also topoisomerase Ⅱαcatalytic inhibitors,thus exhibiting broad antiproliferative activity in a panel of human tumor cells[8-12].
On the other hand,the biological activities of TSC-metal complexes would be largely enhanced when compared with TSCs only due to the metal-ligand synergism effect[13-14].As part of our ongoing work on metal-TSCs[15],the Cd(Ⅱ) and Fe(Ⅲ) complexes with 4-fluorophenyl-N-(quinolin-2-ylmethylene)thiosemicarbazide(HL,Scheme 1)have been synthesized and structural determined by single-crystal X-ray diffraction.In addition,the interactions between the compounds and ct-DNA have been studied by an ethidium bromide(EB)fluorescence probe.
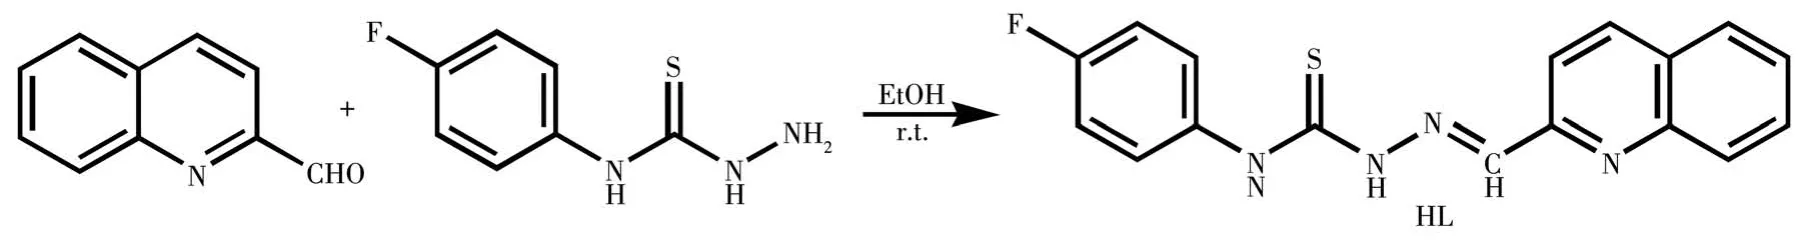
Scheme 1 Reaction scheme for the synthesis of HL
1 Experimental
1.1 Materials and measurements
Solvents and starting materials for syntheses were purchased commercially and used as received.Elemental analyses were carried out on an Elemental Vario EL analyzer.1H NMR spectrum of HL was acquired with Bruker AV400 NMR instrument in DMSO-d6solution with TMS as internal standard.The IR spectra(ν=4 000-400 cm-1)were determined by the KBr pressed disc method on a Bruker V70 FT-IR spectrophotometer.The interactions between the compounds and ct-DNA are measured using the literature method[15]via emission spectra on a Varian CARY Eclipse spectrophotometer.
1.2 Preparations of HL,(H2L)NO3,1,and 2
The TSC ligand HL was produced according to the literature method[16-17],and its structure was confirmed by NMR spectral data.1H NMR(400 MHz,DMSO-d6):δ9.67(d,1H,NH),9.32(d,1H,NH),9.19(1H)/9.05(2H)/8.67(1H)/8.36-8.24(2H)for quinoline-H,8.05-7.99(m,1H,CH=N),7.47(2H)and 7.14(2H)for phenyl-H.FT-IR(cm-1):νC=N1 603,νN=C(quinoline)1 538,νC—S826.
(H2L)NO3,1,and 2 were generated by the reaction of HL(5 mmol)with equimolar of Al(NO3)3,Cd(NO3)2,and Fe(NO3)3in methanol(10 mL)solution,respectively.Crystals of(H2L)NO3,1,and 2 suitable for X-ray diffraction analysis were obtained by evaporating the corresponding reaction solutions at room temperature.
(H2L)NO3:yellow blocks. Anal. Calcd. for C17H14N5O3FS(%):C 52.71;H 3.64;N 18.08.Found(%):C 52.54;H 3.86;N 17.95.FT-IR(cm-1):νC=N1 637,νN=C(quinoline)1 547,ν(NO3)1 384,νC—S832.
1:yellow blocks.Anal.Calcd.for C34H24N10O6F2S2Cd2(%):C 41.02;H 2.43;N 14.07.Found(%):C 41.21;H 2.24;N 13.96.FT-IR(cm-1):νC=N1 623,νN=C(quinoline)1 553,ν1(NO3)1 477,ν4(NO3)1 291,νC—S833.
2:black blocks.Anal.Calcd.for C37H36N9O6F2S2Fe(%):C 51.63;H 4.22;N 14.65.Found(%):C 51.83;H 4.09;N 14.38.FT-IR(cm-1):νC=N1 642,νN=C(quinoline)1 549,ν(NO3)1 384,νC—S829.
1.3 X-ray crystallography
The X-ray diffraction measurement for(H2L)NO3,1,and 2 was performed on a Bruker SMART APEX Ⅱ CCD diffractometer equipped with graphite monochromatized MoKαradiation(λ=0.071 073 nm)by usingφωscan mode.Semi-empirical absorption correction was applied to the intensity data using the SADABS program.The structures were solved by direct methods and refined by full-matrix least-squares onF2using the SHELXTL-97 program.All non-hydrogen atoms were refined anisotropically.All H atoms were positioned geometrically and refined using a riding model.SQUEEZE procedure was applied to deal with the existence of the voids of complex 2.Details of the crystal parameters,data collection,and refinements for(H2L)NO3,1,and 2 are summarized in Table 1.

Table 1 Selected crystallographic data for(H2L)NO3,1,and 2
CCDC:2095715,(H2L)NO3;2095723,1;2095725,2.
2 Results and discussion
2.1 Crystal structures description
The asymmetric units of(H2L)NO3,1,and 2 are shown in Fig.1.Selected bond distances and angles are listed in Table 2.(H2L)NO3was prepared by mixing HL with Al(NO3)3,which is easily hydrolyzed to generate nitric acid.In the structure of(H2L)NO3(Fig.1a),the quinoline N atom is protonated to reach charge balance,and the length of the C—S bond is 0.166 7(2)nm,which is much shorter than those of the C—S bonds in complexes 1(0.177 8(7)nm)and 2(0.174 0(4)or 0.174 4(5)nm),respectively.This fact indicates that the ligand HL has thiolated and deprotonated in both complexes[15,18].

Fig.1 Asymmetric unit of(H2L)NO3(a),1(b),and 2(c)with 30% thermal ellipsoids
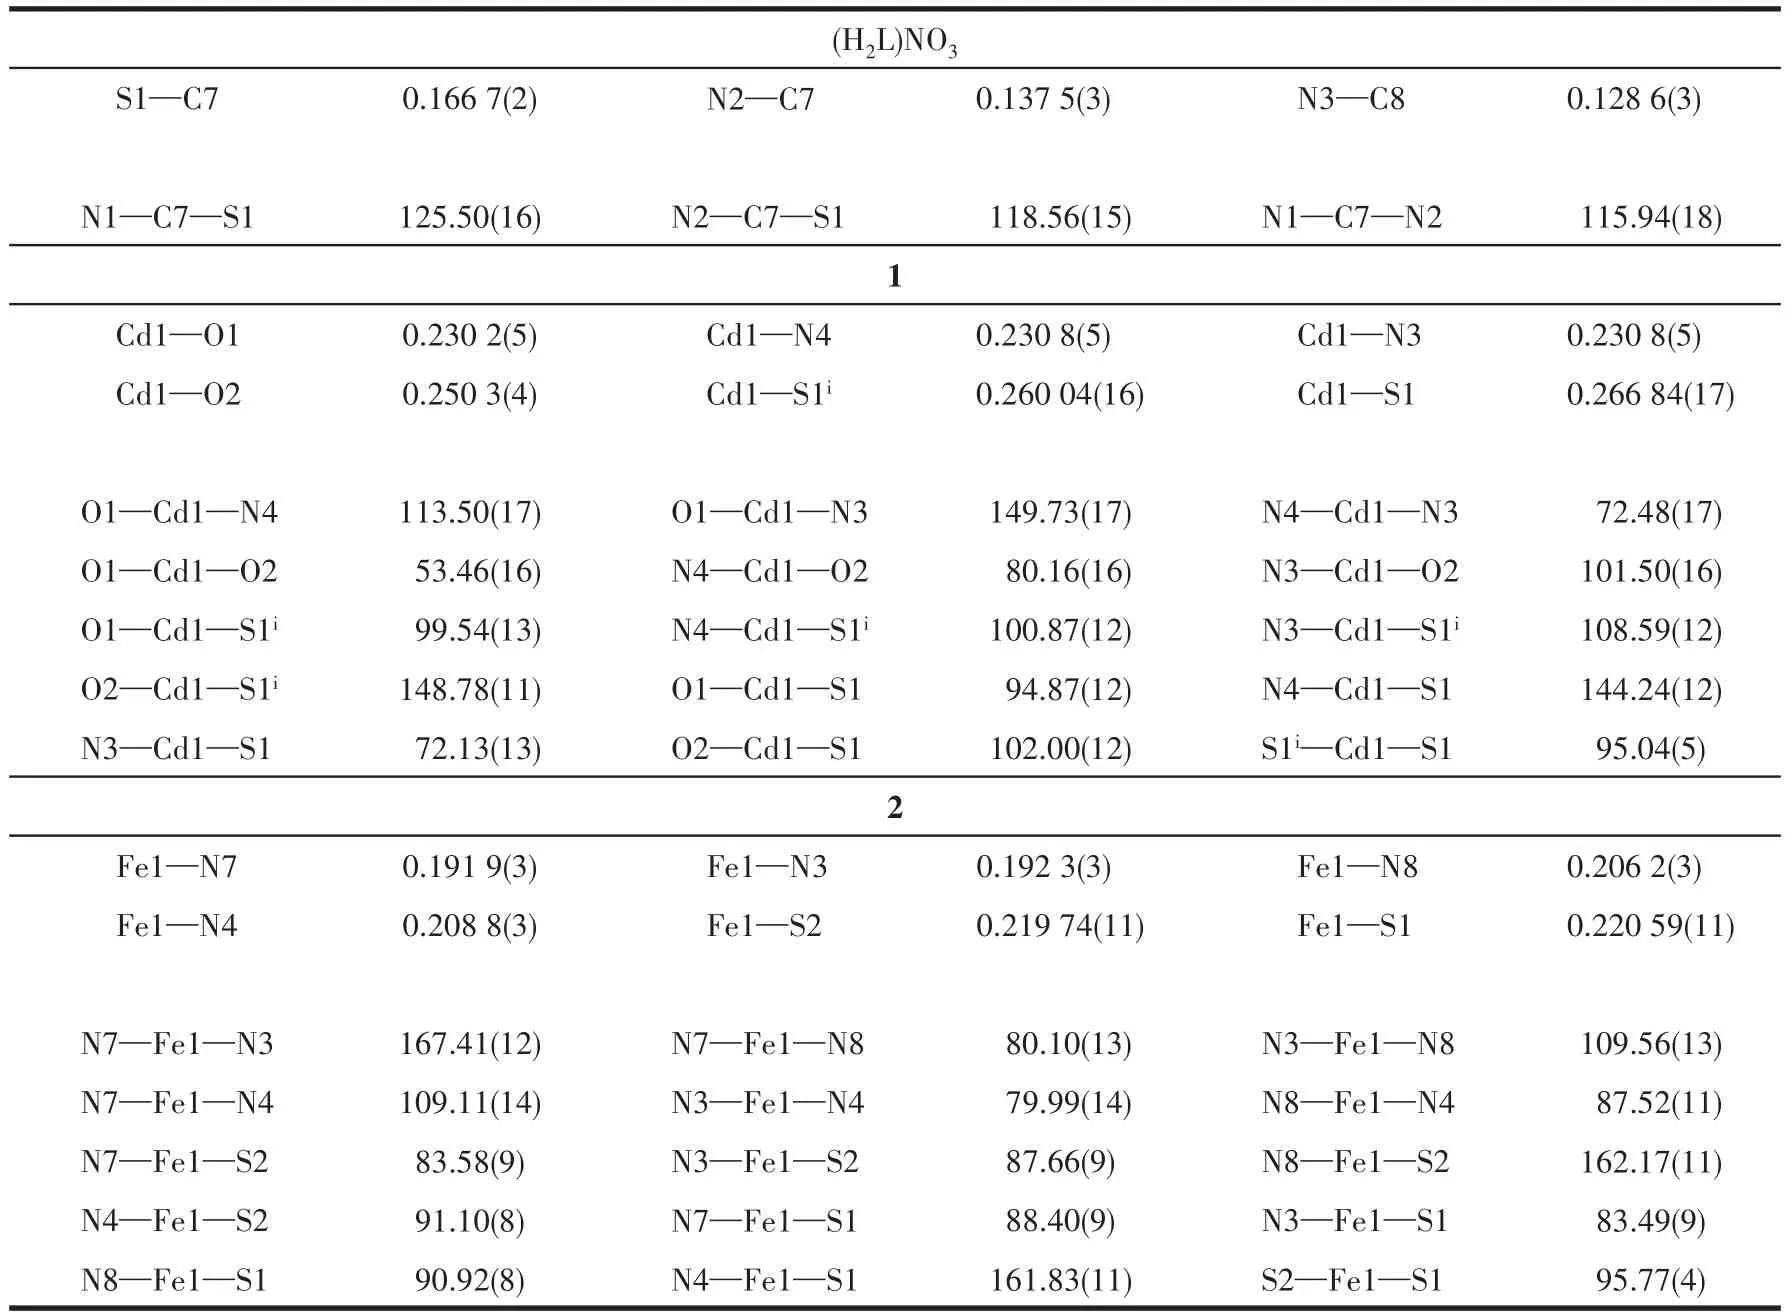
Table 2 Selected bond lengths(nm)and angles(°)for(H2L)NO3,1,and 2
As shown in Fig.1b,complex 1 is binuclear with the Cd1-Cd1idistance of 0.355 84(2)nm(Symmetry code:i-x,2-y,-z).Each Cd(Ⅱ) ion is surrounded by one independent anionic ligand L-with a[N2S]donor set,one bidentate nitrate anion,and anotherμ2-bridged S atom from the adjacent thiosemicarbazone ligand,thus providing a distorted octahedron geometry.The distances of six coordination bonds(0.230 2(5)-0.266 84(17)nm)are in the normal range[15,18].
By contrast,in the mononuclear complex 2,Fe(Ⅲ)also adopts a distorted octahedron geometry,while is coordinated with two tridentate anionic TSC ligands.Fe—N and Fe—S bond lengths are 0.1919(3)-0.2088(3)and 0.219 74(11)/0.220 59(11)nm,respectively,which are comparable with those found in the reported complexes with similar donor sets[15,18].In the crystal,free nitrate anion and three crystal methanol molecules are highly disordered,which were confirmed by elemental analysis and thermogravimetric analysis(Fig.S1,Supporting information), and then dealt with the SQUEEZE procedure.
2.2 UV-Vis and IR spectra
The UV-Vis absorption spectra of HL,(H2L)NO3,1,and 2 in 10 μmol·L-1CH3OH solution were measured at room temperature in Fig.2.The typical absorption peaks of HL and(H2L)NO3atca.289 nm(εHL=12 437 L·mol-1·cm-1,ε(H2L)NO3=18 974 L·mol-1·cm-1)and 338 nm(εHL=12 290 L·mol-1·cm-1,ε(H2L)NO3=27 592 L·mol-1·cm-1)were observed,which could be attributed to theπ-π*transitions of benzene and quinoline ring[19],respectively.In the spectrum of complex 1,such two peaks merged at 294 nm(ε1=15 011 L·mol-1·cm-1).However,in the case of complex 2,the former peak disappeared,and the latter had an obvious hypochromic effect.In addition,the peak at 440 nm(εHL=7 704 L·mol-1·cm-1,ε(H2L)NO3=2 754 L·mol-1·cm-1)in the spectra of HL and(H2L)NO3may be originated from then-π*transition of C=N moiety in the ligand[20],which displayed hyperchromic effect after metal binding(ε1=17 889 L·mol-1·cm-1,ε2=9 174 L·mol-1·cm-1).These facts reveal that the quinoline and imine N atoms take part in the coordination.

Fig.2 Partial UV-Vis(a)and IR(b)spectra of HL,(H2L)NO3,1,and 2
The infrared spectral bands most useful for determining the mode of coordination of the TSC ligand are theνC=N,νN=C(quinoline),andνC—Svibrations.Such three bonds of the free TSC were found at 1 603,1 538,and 826 cm-1,while they shifted to lower frequencies in 1 and 2,clearly indicating the coordination of imine nitrogen,quinoline nitrogen,and sulfur atoms[18].In addition,the intense absorption band at 1 384 cm-1in the spectra of(H2L)NO3and complex 2 indicates the existence of free nitrate groups in both compounds[21].The general pattern of the IR spectroscopy of complex 1 supports the normal coordination of the bidentate nitrate group[15].All results are in accordance with the crystal structure study.
2.3 EB-DNA binding study by fluorescence spectrum
It is well known that EB can intercalate nonspecifically into DNA,leading to strong emissions.Competitive binding of other drugs to DNA and EB will result in displacement of bound EB and thus decrease the fluorescence intensity[22].Fig.3 demonstrates the effects of the ligand and complexes on the fluorescence spectra of the EB-DNA system.The results show that the fluorescence intensities of EB bound to ct-DNA at about 600 nm gradually decreased along with the increasing concentration of the tested compounds,revealing that some EB molecules are released into solution after the exchange with the compounds.The quenching of EB bound to DNA by the compounds is in agreement with the linear Stern-Volmer equation:I0/I=1+Ksqr[23],whereI0andIrepresent the fluorescence intensities in the absence and presence of quencher,respectively,Ksqis the linear Stern-Volmer quenching constant,ris the ratio of the concentration of quencher and DNA.In the quenching plots ofI0/Iversusr,Ksqvalues are given by the slopes.TheKsqvalue of the free ligand HL was 0.126,while those of complexes 1 and 2 were 0.356 and 3.313,respectively,indicating that interactions of both complexes with DNA are stronger than that of the ligand HL.As previously reported,this phenomenon could be explained by the higher rigidity of the complexes[14].In addition,mononuclear complex 2 exhibited a much higher quenching constant than dinuclear complex 1,probably due to the existence of Fe(Ⅲ),which has been proved to play an important role in biological systems[9-12]and thus leading to higher metal-ligand synergism effect.
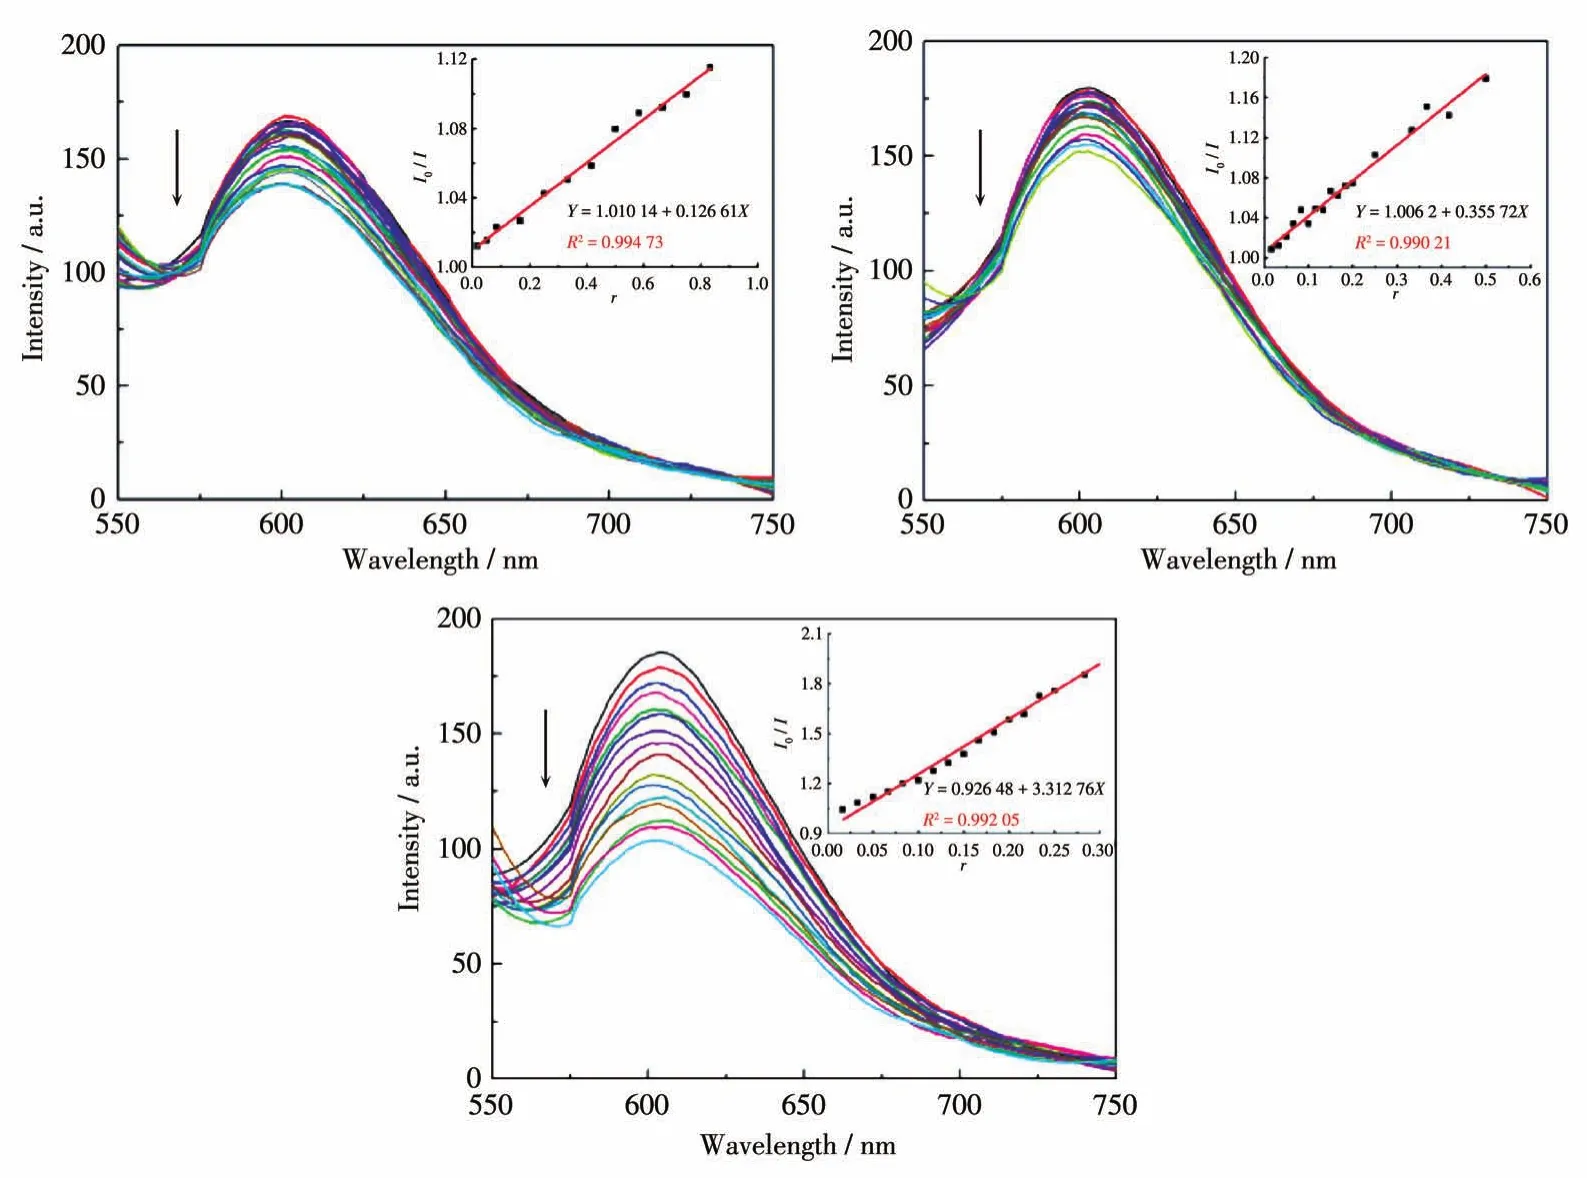
Fig.3 Emission spectra of EB-DNA system in the presence of HL(a),1(b),and 2(c),respectively
2.4 UV-Vis spectrum studies on interactions of the complexes with DNA
UV-Vis spectrum titration is one of the simplest methods for the detection of DNA binding mode.As exhibited in Fig.4a-4c,with the addition of DNA,the maximum absorption peak of each compound at 258 nm had a red shift(2 nm),and the absorbance was enhanced remarkably,corresponding to the hyperchromic effect to a certain extent.This phenomenon may suggest that the binding of three compounds to DNA can result in the aggregation of molecules in solutions and the disruption of the interaction between molecules.To quantitatively compare the binding capacity of the compounds,the titration experiments on the UVVis spectrum were performed according to the change of the absorbance with the DNA concentration,and the binding constant of three compounds to DNA was determined according to the Benesi-Hildebrand equation[24]:A0/(A-A0)=εG/(εH-G-εG)+[εG/(εH-G-εG)][1/(KbcDNA)].Under the experimental conditions,the binding constantsKbof HL,1,and 2 to ct-DNA were 1.18×104,1.34×104,and 9.9×10⁴L·mol-1,respectively.The sequence ofKband the binding ability of HL,1,and 2 to DNA was 2≫1>HL(Fig.4d)[25].Combining with the fluorescent titration result,we speculated that the binding mode of complex 2 is intercalation,while HL and complex 1 may interact with ct-DNA by outside groove binding mode[26].

Fig.4 UV-Vis spectra of(a)HL,(b)1,and(c)2 in the presence of increased amounts of ct-DNA;(d)Determination of binding constant
2.5 Viscosity measurements
To further investigate the binding mode and binding strength of HL,1,and 2 with DNA,the DNA viscosity changing upon the addition of compounds was studied at 25 ℃.The relative viscosityηwas calculated through the equation:η=(t-t0)/t0,wheret0andtrepresent the flow time of the DNA solution in the absence and presence of the tested compound through the capillary,respectively.As shown in Fig.5,the result exhibited that the relative viscosity of DNA remarkably increased after adding complex 2,while no significant viscosity change occurred in the case of HL and complex 1.This fact suggests that complex 2 may partially insert into DNA,while HL and complex 1 are likely to interact with DNA by outside groove binding mode.The results are in agreement with the absorption and fluorescence spectral observation and explain the structural differences causing the differences in DNA bindings.

Fig.5 Effect of increasing amounts of the compounds on the relative viscosity of DNA at 25℃
2.6 MTT assay
The cytotoxicity of these compounds towards the cell line was evaluated using the MTT method,which has been done to test the ability of HL,1,and 2 to inhibit cell growth and induce cell death in HeLa cells.The IC50values of HL,1,and 2,calculated by graphing analysis of dose-response curves,were 58.31,46.59,and 38.56 μmol·L-1,respectively.It could be observed that complex 2 exhibited a strong anti-proliferative effect on HeLa cells and was more sensitive than HL and complex 1.
3 Conclusions
Cd(Ⅱ) and Fe(Ⅲ) complexes 1 and 2 based on 4-fluorophenyl-N-(quinolin-2-ylmethylene)thiosemicar-bazide(HL)have been synthesized and characterized by single-crystal X-ray crystallography.In both complexes,the metal ions are chelated with the thiosemicarbazone ligand in a tridentate anionic form.Moreover,the fluorescence spectra show that the interactions of complexes to DNA are much stronger than that of the free ligand.The spectra and viscosity measurements indicate that 2 can bind with ct-DNA through intercalation mode,while HL and 1 may interact with ct-DNA by outside groove binding mode.Also,the binding affinity of 2 with ct-DNA is much stronger than that of HL and 1.In addition,complex 2 has the strongest ability to inhibit the proliferation of HeLa tumor cells among the three compounds.Further research is needed to better determine the relationship between structures and activities.
Supporting information is available at http://www.wjhxxb.cn
