Simulation of a helicon plasma source in a magnetoplasma rocket engine
2022-08-01ZhenyuYANG杨振宇WeiFAN范威JianguoWEI魏建国andXianweiHAN韩先伟
Zhenyu YANG(杨振宇),Wei FAN(范威),Jianguo WEI(魏建国)and Xianwei HAN(韩先伟)
Shaanxi Key Laboratory of Plasma Physics and Applied Technology,Xi’an 710100,People’s Republic of China
Abstract The helicon plasma source,which generates high thrust and high impulse,is of vital importance for magnetoplasma rocket engines.In this work,a multi-component,two-dimensional,axisymmetric fluid model coupled with an electromagnetic field was developed to model the helicon discharge.The simulation results demonstrate that:(i)the discharge mode changes twice—each conversion is accompanied by a plasma density jump and an electron temperature peak in the discharge;(ii)when the input current increases,the plasma density increases,and ionization occurs faster;(iii)the background magnetic field clearly enhances the discharge;(iv)the plasma density may be smaller if the discharge has not entered the wave mode.
Keywords:space propulsion,MPRE,helicon plasma source,discharge mode conversion
1.Introduction
Unlike other radio-frequency(RF)plasma sources,helicon plasma sources depend on the excitation of bounded whistle waves to generate high-density plasmas at low pressures and RF powers[1].Due to the effective absorption of RF power,the plasma density in a helicon source is as much as an order of magnitude higher than that in other plasma generators at a given power.Because of this advantage,helicon sources are widely used in semiconductor processing and space propulsion[2–4].
The magnetoplasma rocket engine(MPRE)originates from the concept of the variable specific impulse magnetoplasma engine(VASIMR),which is a type of electromagnetic thruster.The MPRE consists of three stages,which are shown in figure 1.The helicon source is the first stage,where the working medium is ionized;the second stage uses ion cyclotron resonance heating(ICRH)to heat the ions by hundreds of eV using RF waves;and the third stage is a magnetic nozzle,where the heated plasma naturally accelerates in the expanding magnetic field and leaves the device,producing thrust[5].As a result of the use of these techniques,MPRE has the characteristics of high thrust,high specific impulse,and high efficiency and can be used in deep space exploration and other missions[6].According to the operating principles of the MPRE,the helicon plasma source is the chamber where a high-density plasma is created,so it is the basis of the thrust generated by the MPRE.
Ever since Boswell first reported the high densities produced by helicon discharges in 1970[7],helicon plasma sources have been extensively studied,both experimentally and theoretically.Research mainly focused on the confirmation of the wave mode excited in the plasma and the mechanism responsible for the high power absorption efficiency.At first,Landau damping was thought to be the mechanism of power absorption,as proposed by F F Chen[8].However,subsequent experiments showed that Landau-accelerated electrons are too sparse to explain the ionization efficiency and the Landau damping hypothesis was ruled out by F F Chen and D D Blackwell[9,10].There are two wave branches in the solution of the helicon dispersion relation[11]:one is the helicon wave and the other is called the Trivelpiece–Gould wave(TG wave)[12].Research showed that the power absorption can be more appropriately explained by the strong damping of the TG wave[13–16].Another unique phenomenon in helicon discharges is that the plasma density jumps at a certain power,accompanied by a change of discharge mode[17,18].F F Chen thought this was due to the nonmonotonic variation of the plasma impedance[19],while S H Kin used the concept of the mode conversion surface(MCS)to explain the mode conversion[20].In the field of helicon discharge simulation,D Arnush studied the coupling of helicon waves and TG waves using the HELIC software[21],and X Yang analyzed the phenomenon of the density peak in the weak magnetic field using the COMSOL software[22].
The characteristics of helicon discharge in MPRE determine the plasma flux,which is of vital importance to the thrust and specific impulse.Analyses of the physical processes of helicon discharge are instructive for MPRE development.However,it is impossible to make direct measurements of the plasma and electromagnetic field in the discharge chamber due to the limitation of the engine structure.Therefore,numerical simulation has become an effective method for studying helicon discharges.
In this work,a multi-component,two-dimensional,axisymmetric fluid model coupled with an electromagnetic field was developed to simulate the helicon discharge.The simulation was performed using different input currents and background magnetic fields to analyze the process of discharge mode conversion and the density jump.This paper is organized as follows:in section 2,the governing equations of the model are given;the simulation model setup is described in section 3;in section 4,the results are presented and discussed;and in section 5,this study is concluded.
2.Governing equations
The simulation model includes the motions of electrons,ions,and atoms and the interactions of the electrostatic field and the electromagnetic field.In this section,we discuss the governing equations of the electromagnetic field,electrons,ions,neutral atoms,and the electrostatic field in the cylindrical coordinate system(r,θ,z).
2.1.Electromagnetic field
The electromagnetic field is obtained through the solution of the Maxwell equations(1),(2)together with current equation(3).
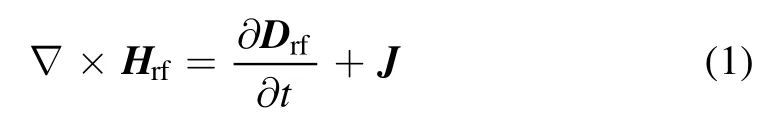
where the subscript rf refers to the fields which are excited by the RF input;H is the magnetic field intensity;B is the magnetic induction intensity;E is the electric field;D is the electric displacement;J is the plasma current density;e,ne,andmeare the elementary charge,the electron density,and the electron mass,respectively;νenis the collision frequency between electrons and neutral atoms;and B0is the background magnetic field along thezaxis.In magnetized plasma,the solutions of equations(1)–(3)are divided into two independent branches:the transverse magnetic(TM)mode and the transverse electric(TE)mode,the equations of which are shown in(4)and(5).

where the subscript rf is omitted for simplicity.After the electric field and the current density field have been obtained,the power density deposited in the plasma is calculated using equation(6).

2.2.Electrons
The drift–diffusion hypothesis is used to describe the electron motion[23].Equation(7)is the continuity equation and equation(8)is the energy equation.

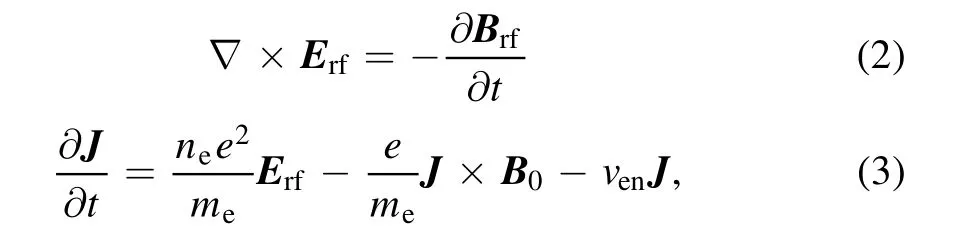
where Γeis the electron flux;nnis the number density of neutral atoms;KionandKexcare the ionization rate and the excitation rate,respectively;Teis the electron temperature;qeis the energy flux,εionand εexcare the threshold energies of ionization and excitation,respectively;and Esis the electrostatic field.The electron flux and energy flux are given by the following equations.
in which μeis the electron mobility,Deis the diffusion coefficient,μe=e/meνen,andDe=kBTe/meνen.In this model,the ionization and excitation collisions of electrons are considered,and the reaction rate is calculated usingKj=vthσj,wherevthand σjare the thermal velocity of electrons and the collision section of different kinds of collision,j.In addition,νen=vthσeffnn,where σeffis the effective collision section between electrons and atoms.In the MPRE,with a working medium of Ar,the collision sections obtained from Morgan’s database are weighted by a Maxwell distribution and the reaction rates of different electron temperatures are shown in figure 2.In the simulation,σeffis set to 1.0×10⁻¹⁹m-2[22],andKionandKexcare set according to the local electron temperature.
2.3.Heavy particles
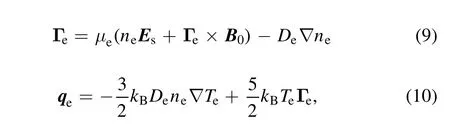
The ionic model consists of the continuity equation,the momentum equation,and the energy equation,as shown below:
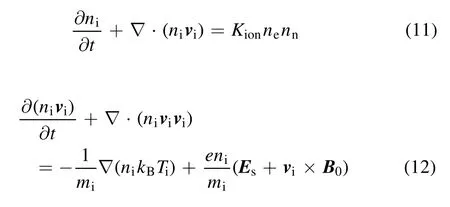

whereni,mi,vi,andTiare the ionic density,mass,drift velocity,and temperature,respectively.Here,it is assumed that the ionization only generates Ar+,and ion collisions are neglected.
As a result of the low pressure in the discharge chamber and the low temperature of the atoms,the atomic temperature of the model is assumed to be constant and the viscosity is omitted.Therefore,the atomic model only includes the continuity equation(14)and the momentum equation(15).
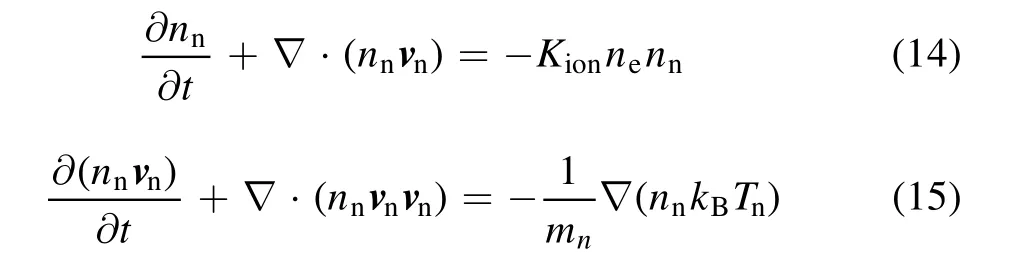
Here,mn,vn,andTnare the atomic mass,velocity,and temperature,respectively.
2.4.Electrostatic field
The semi-implicit Poisson equation is solved to obtain the electrostatic field[23].

whereVis the potential,and Δtis the time step.In this equation,in contrast to the Poisson equation,the divergence of the charged particle flux is added to predict the potential of the next step,which has proven effective when the time step size is increased.The electric field is the negative gradient of the potential Es=-∇V.
3.Simulation model setup
The numerical methods and the initialization of the computation model are introduced in this section.
3.1.Numerical methods
The alternating direction implicit finite difference time domain(ADI-FDTD)method is adopted to solve equations(3)–(5),in which the update of the electromagnetic field per time step is divided into two separate steps and the implicit direction is alternated[24].In ADI-FDTD,the time step can break through the limitation of the Courant–Friedrichs–Lewy(CFL)condition and thereby reduce the computational cost.The space discretizations of the TM mode and the TE mode are shown in figure 3,in which the components of the current density are all placed at grid points.In the time direction,discretization is implicitly performed in thezdirection in first half-step and subsequently in therdirection.
The electron density and temperature are discretized by the central difference,and a staggered grid is adopted,as shown in figure 4.Equations(7)and(8)are time integrated by the implicit scheme.
The equations of the heavy particles are solved by the fluxcorrected transport(FCT)algorithm[25],which has been proven to be an accurate and easy-to-use algorithm for the solution of nonlinear and time-dependent continuity equations of the type occurring in fluid dynamics,plasma dynamics,and magneto hydrodynamics.The time integration is completed with a splitstep approach,in which the integrations of thezandrdirections are alternated.The details of the FCT algorithm and the test code can be seen in[25].The Poisson equation(16)is solved by the five-point difference scheme.
3.2.Initialization
Figure 5 shows the computational domain.The whole domain is an axisymmetric cylinder with a radius ofrendand a length ofzend-zstart.The plasma is in a cylindrical chamber whose radius isrpand whose length iszp2-zp1;outside the plasma is vacuum.The helicon discharge antenna is a single ring which is placed at(zc1,rc1),and the ICRH antenna is placed at(zc2,rc2).The input current density is calculated using equation(17).The ICRH is beyond the scope of this work,but will be discussed in the future.
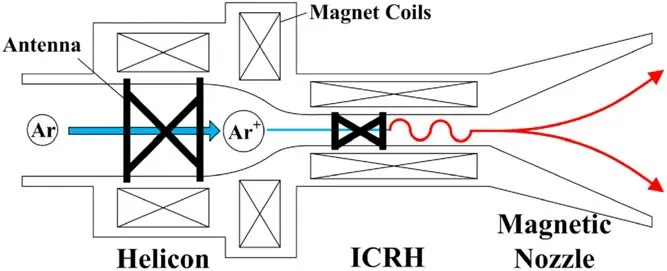
Figure 1.Schematic of MPRE.
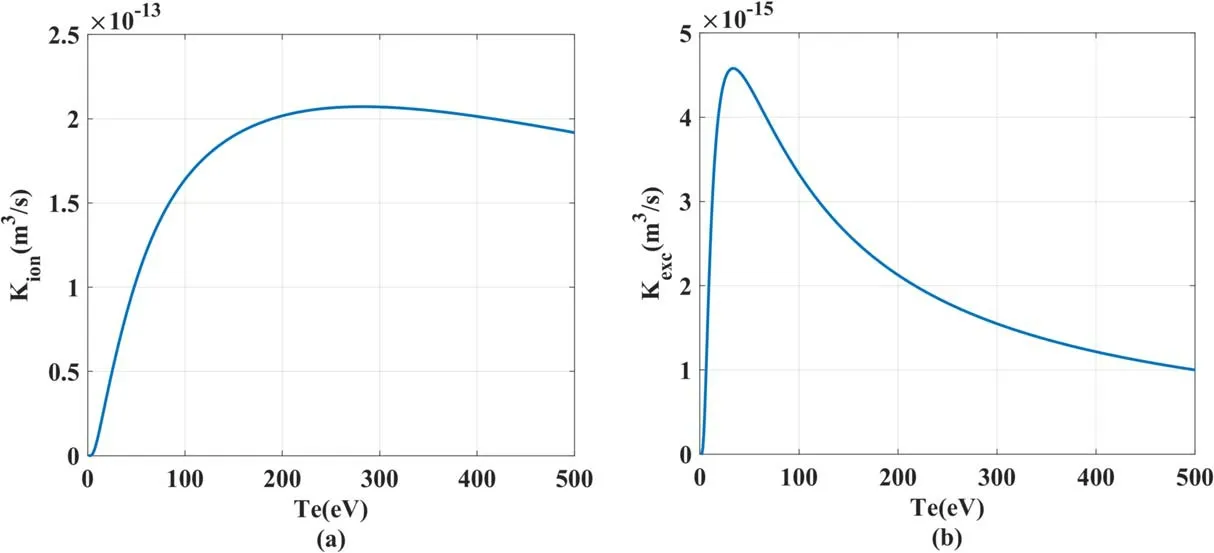
Figure 2.Reaction rates of different electron temperatures:(a)ionization,(b)excitation.

Figure 3.The space discretization of the electromagnetic field:(a)TM mode,(b)TE mode.

Figure 4.The space discretization of the electron equations.

Figure 5.Schematic of the computational domain.

where Δzand Δrare the grid sizes in thezandrdirections,respectively,andfrfis the input frequency,which is set to 13.56 MHz.The geometric parameters are shown in table 1.
For the electromagnetic field,the MUR condition[26]is adopted atrend,while the perfect conductor condition is adopted atzstartandzend.A Dirichlet boundary is adopted at the wall for the electron density,and a Neumann boundary is adopted for the electron temperature.The boundary condition given in equation(18)is adopted for the heavy particles.The potential at the boundary is set to zero.A symmetric boundary is adopted for all variables at the axis.

Table 1.Geometric parameters of the simulation model.

Figure 6 shows the profile of the background magnetic field,with the single-loop helicon antenna merged in a uniform magnetic field and a magnetic induction intensity of 0.1 T.At the initial moment,ne=ni=1.0×10¹⁶m-3,Te=2 eV,Ti=Tn=300 K,and the atomic density is set according to the discharge pressure.The program is coded in Fortran,the numerical data is stored for every RF cycle,and the computation time is set to 1000 RF cycles.
4.Results and discussion
4.1.Discharge mode conversion
Figure 7 shows that there are three distinct modes of operation in the helicon discharge:the capacitive mode(E mode),the inductive mode(H mode),and the wave mode(W mode).The W mode can be divided into several modes of different orders,known as W1,W2,W3….The discharge undergoes conversions from E to H and from H to W1,and the conversions to the higher-order wave modes are accompanied by plasma density jumps.In the simulation,there is no capacitive mode,since the wall voltage is set to 0 V;as a result,only the H mode and the wave modes of different orders appear in the discharge process.
First,the background pressure is set to 1.24 Pa,and the input current is 700 A.Figure 8 shows the maximum electron density and electron temperature during the discharge.It can be seen that the electron density gradually increases under the influence of the RF input and reaches 1.45×10²⁰m-3,which is much larger than the typical values for other kinds of plasma source.In addition,the electron temperature is about 3 eV,which is consistent with the general situation in cold plasma.Second,figure 8(a)shows that there are two obvious inflection points in the electron density profile,where the electron density increases dramatically and the magnitude jumps to a higher order in a few RF cycles at the inflection points.It can be inferred that the first inflection point corresponds to the moment when the discharge mode converts from H to W1and the second occurs at the time of the conversion from W1to W2.Figure 8(b)shows that each conversion corresponds to an electron temperature peak,and the ionization rate also increases significantly with electron temperature,causing a sudden increase in density.
In the study of helicon discharges,the deposited wave power is the main research interest.Figure 9 shows the distribution of deposited power density in the plasma at different moments,whereTis the number of RF cycles in the simulation.At the 20th cycle,with the discharge in H mode,the deposited power is concentrated at a point close to the antenna and is similar to that of an inductively coupled plasma(ICP).At the 32nd cycle,with the discharge in the W1mode,the deposited power is concentrated in a thin layer near the periphery.In figure 9(c),the deposited power appears to detach from the periphery,and it gradually moves inward in figure 9(d).At the 47th cycle,the deposited power is mainly concentrated near the axis and the magnitude reaches 108W m-3.The penetration of the deposited power during mode conversion makes the electron temperature increase dramatically;the ionization rate then increases,and the plasma density jumps to a higher order of magnitude.

Figure 6.The profile of the background magnetic field along the axis.
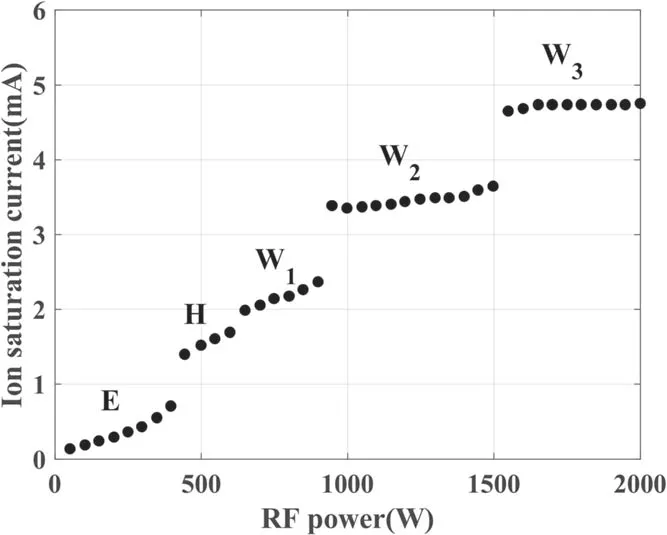
Figure 7.Mode conversion of the helicon discharge[27].
The concept of the MCS can explain the jump in the deposited power during mode conversion[20].There are two wave branches in the solution of the helicon dispersion relation:one is the helicon wave and the other is the TG wave.The helicon wave is fast and weakly damped while the TG wave is slow and strongly damped.Thus,the helicon wave can enter the plasma column and heat the plasma core,but the TG wave is concentrated in a thin layer near the plasma edge,and the wave energy is deposited in this layer,which can be seen in figure 9(b).When the plasma density is low,these two branches are separated from each other.When the plasma density increases to the MCS,these two kinds of wave couple with each other,which means the wave can penetrate the plasma and be strongly damped,so the deposited power penetrates the plasma core,as shown in figures 9(c)–(d).In figure 9(e),the waves are able to heat the plasma core,causing the electron temperature to peak.
To show the conversion of the electromagnetic wave,the electric field amplitudes of three components in therdirection atz=zc1are shown in figure 10;the results are processed using spline interpolation.The figure indicates thatEzis basically zero at three moments,Eθchanges a little,reaching a maximum at the plasma edge and becoming zero at the axis,and it is the change ofErthat causes the mode conversion.At the 20th cycle,Eris almost 0,onlyEθis present in the plasma column,and the external magnetic field has little influence on the electromagnetic field structure,which is basically same as that of an ICP.In figure 10(b),Eroscillates strongly near the edge and decays to zero at one or two wavelengths,matching the characteristics of a TG wave[13],and the TG wave plays the major role in the W1mode.WhenT=43,multiple wave nodes and antinodes are present in the radial direction,which implies that the wave number becomes smaller and the wave becomes faster.In addition,the amplitude increases by an order of magnitude.These two features confirm that the wave has penetrated the plasma,and that helicon wave heating accounts for the main part of the deposited power in the W2mode.In figure 10(d),Erreaches its maximum near the axis,and the electromagnetic field is able to heat the plasma core.
4.2.Discharges at different input currents
Keeping the other input parameters unchanged,the input current was set to 300 A,500 A,700 A,and 900 A.Figure 11 shows the maximum electron density during discharges at different input currents.In general,the plasma density increases with the input current.When the input current increases from 300 to 900 A,the density increases from 3.09×10¹⁹to 1.72×10²⁰m-3,which can meet the requirement for the engine to generate high thrust.
Figure 12 shows the evolution of the maximum electron density and the temperature during discharges at input currents of 300 A and 700 A.The figure shows that the plasma evolutions are similar during discharges at different input currents.There are two obvious inflection points in the density profile and two peaks in the temperature profile,corresponding to the inflection points in the profiles at different input currents.However,the discharge is much slower with an input current of 300 A.When the input current is 700 A,the discharge mode converts from H to W1at about the 30th RF cycle and converts from W1to W2at about the 45th RF cycle.When the input current is 300 A,there is a long process of electron multiplication;the discharge mode does not change until the 300th RF cycle,and it converts to the W2mode at about the 500th RF cycle.In addition,the temperature peaks are also smaller.

Figure 8.Maximum electron density and electron temperature during discharge:(a)maximum electron density,(b)maximum electron temperature.

Figure 9.Distribution of deposited power density at different moments.(a) T=20,(b) T=32,(c) T=43,(d) T=44,and(e) T=47.
It is worth noting that the electron density is basically the same when the mode converts,even at different input currents.The discharge mode first converts when the density is about 2×10¹⁶m-3and it converts for the second time when the density is about(2–3)×1018m-3.If the background magnetic field of the helicon discharge remains constant,the plasma density at the MCS remains unchanged.The power deposited in the plasma increases with the input current,so the ionization rate of Ar also becomes larger,which means that the plasma can reach the MCS earlier.This is why the discharge mode converts earlier for a higher input current.
4.3.Discharges in different magnetic fields
We discuss the results of using different magnetic fields with a series of input currents by taking magnetic field values of 0.01 T and 0 T(ICP).The electron densities for different magnetic fields and input currents are shown in figure 13.If the input current is too small,it is found that the ionization is extremely slow.This is due to the restriction of radial transport by the magnetic field when the magnetic induction strength is 0.1 T,and it takes a very long time for the discharge to reach a steady state;therefore cases involving small input currents were not examined.
In helicon discharge experiments,as the input power generally increases,the mode of operation changes,and the luminous intensity of the plasma increases significantly,which indicates that the plasma density has jumped to a higher order of magnitude[28].Density jumps also appear in the simulation.Figure 13 shows that the electron density jumps twice as the input current increases forB=0.01 T,first at about 20 A and then at about 40 A.The evolutions of electron density and temperature at different input currents whenB=0.01 T are plotted in figure 14.In figure 14(b),the electron temperatures are 2.58 eV and 3.23 eV at the 1000th cycle,whenIrf=20 A and 50 A,respectively.It was seen in many completed simulations that the electron temperature peaks only appear when the electron temperature is relatively high.At the 1000th cycle,the electron temperature is very close to that of the steady state;however,the electron peak has not appeared.The discharge mode does not change,even if the simulation continues,so a simulation time of 1000 RF cycles is sufficient.
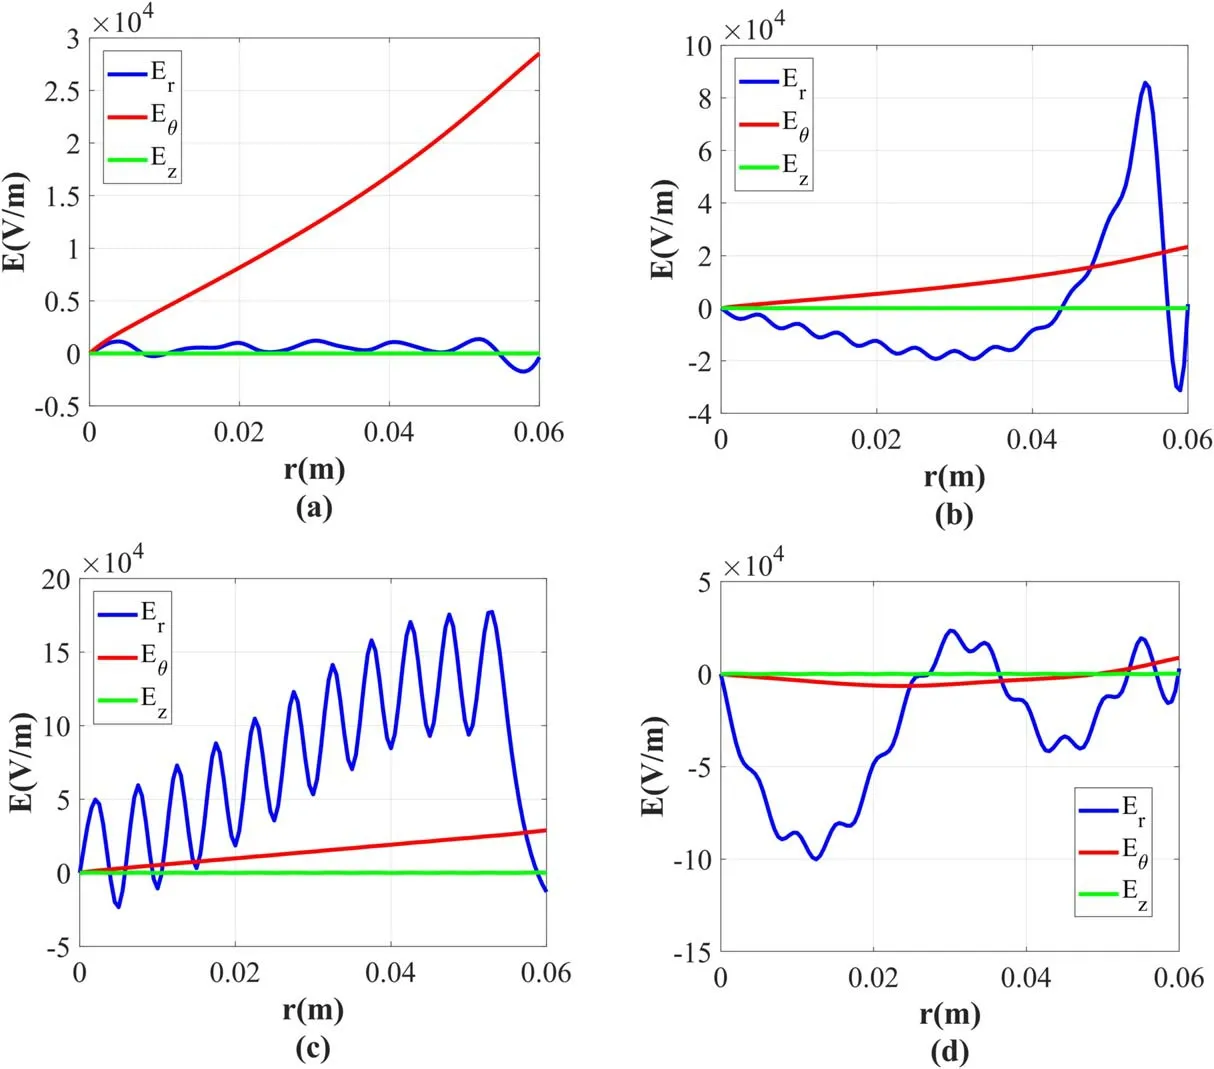
Figure 10.Amplitudes of the electric field components in the r direction at z=zc1.(a) T=20,(b) T=32,(c) T=43,and(d) T=47.
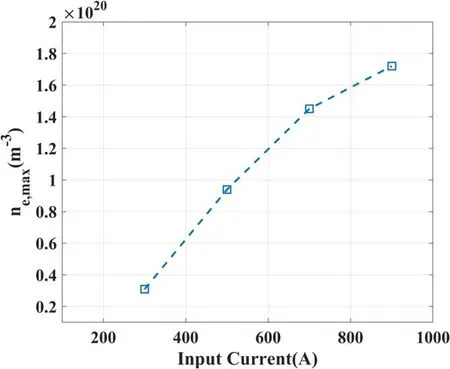
Figure 11.Maximum electron densities of different input currents.

Figure 12.Maximum electron density and electron temperature during discharge:(a)electron density,(b)electron temperature.

Figure 13.Electron densities for different magnetic fields and input currents.
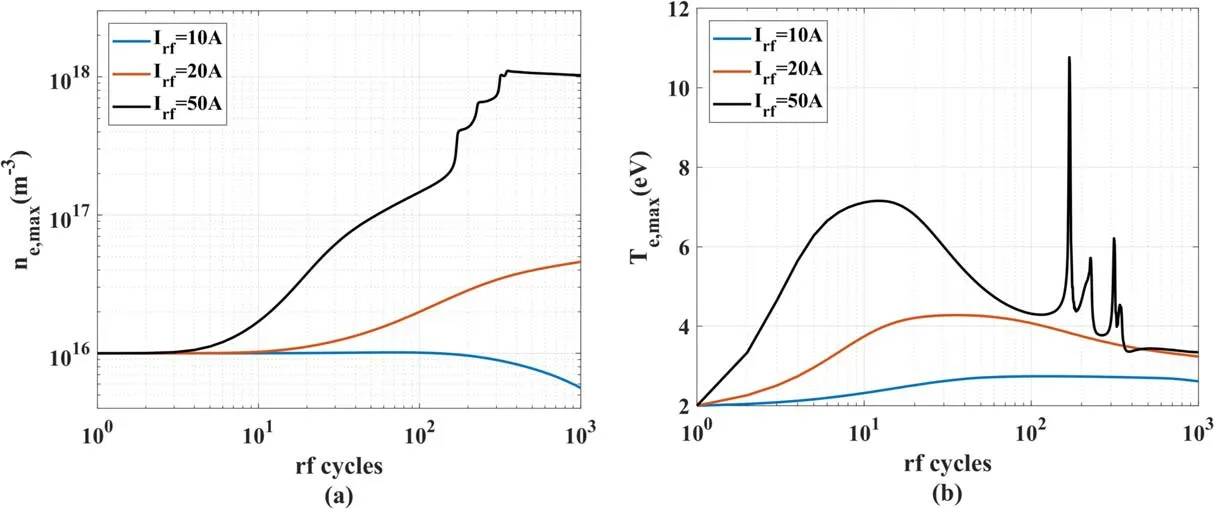
Figure 14.Electron density and temperature evolutions at different input currents when B=0.01 T:(a)electron density,(b)electron temperature.
The evolution of the plasma when the input current is 50 A is similar to that shown in figure 7.The second temperature peak is followed by a series of small peaks,indicating that the helicon mode is fluctuating,but in general,the electron temperature decreases over time and finally becomes steady.However,the other two cases in figure 14 are very different.When the input current is 20 A,there is only one wide temperature peak and the density profile has only one inflection point.When the input current is decreased to 10 A,the profiles are approximately convex and the plasma density gradually decreases with time.These results show that the mode conversion is accompanied by a density jump and a temperature peak,which can be signs that prove the discharge mode has changed.The above results show that the unique phenomena of mode conversions and density jumps in helicon plasma sources can be seen in simulations,which verifies that the model is an effective tool for the study of helicon discharges.
The enhancement of the magnetic field due to helicon discharge is also shown in figure 13.For example,if the input current is 700 A,the plasma densities are 1.45×10²⁰m-3,4.09×1019m-3,and 8.56×10¹⁸m-3for discharges ofB=0.1 T,B=0.01 T,and an ICP,respectively.The plasma densities are 16.94 and 4.78 times higher than that of the ICP.However,it should be noted that if the discharge does not converted to the W mode,the density may be smaller than in the case without a magnetic field.The effect of the magnetic field also agrees with experimental results[28].
5.Conclusions
In this paper,a multi-component,two-dimensional,axisymmetric fluid model coupled with an electromagnetic field was developed to model helicon discharges.This model includes the motions of electrons,ions,and atoms and the interactions with the electrostatic field and the electromagnetic field.Discharges were simulated at different input currents and for different background magnetic fields.The unique phenomenon characteristic of helicon plasma sources can be seen in the simulation results,which verifies that this model is an effective tool for the study of helicon discharges.
First,the input current is set to 700 A and the magnetic field is set to 0.1 T.With continuous ionization,the waves are able to penetrate the plasma after the plasma density reaches the MCS.As a result,the electromagnetic field is able to heat the plasma core,the deposited power increases dramatically,and inflection points and temperature peaks appear.
The input current is then changed while keeping the magnetic field constant.The results show that the plasma density and the ionization rate decrease with the input current and the moment when the discharge mode converts is postponed.
Finally,the discharge is simulated at 0 T,0.01 T,and 0.1 T with a series of input currents.It is found that the discharge mode conversion is always accompanied by a plasma density jump and a temperature peak.Therefore,the density jump can be used a sign which indicates the conversion of the discharge mode.In addition,the magnetic field strongly enhances the discharge,and the plasma density is an order of magnitude higher than that in an ICP.However,the plasma density may be smaller if the discharge has not entered the wave mode.
Acknowledgments
This work is supported by the Shaanxi Key Laboratory of Plasma Physics and Applied Technology.
ORCID iDs
杂志排行

Plasma Science and Technology的其它文章
- Characteristics of plasma in a novel laserassisted pulsed plasma thruster
- The effect of anode axial position on the performance of a miniaturized cylindrical Hall thruster with a cusp-type magnetic field
- Investigation into the thermal effect of the LIPS-200 ion thruster plume
- Early experimental investigation of the C12A7 hollow cathode fed on iodine
- Numerical study of the effect of aft-loaded magnetic field on multiple ionizations in Hall thruster
- Numerical simulation of the start-up process of a miniature ion thruster