Effects of heterogeneous adoption thresholds on contact-limited social contagions
2022-06-29DanDanZhao赵丹丹WangXinPeng彭王鑫HaoPeng彭浩andWeiWang王伟
Dan-Dan Zhao(赵丹丹) Wang-Xin Peng(彭王鑫) Hao Peng(彭浩) and Wei Wang(王伟)
1College of Mathematics and Computer Science,Zhejiang Normal University,Jinhua 321004,China
2College of Information,Zhejiang Guangsha Vocational and Technical University of Construction,Dongyang 322100,China
3Shanghai Key Laboratory of Integrated Administration Technologies for Information Security,Shanghai 200240,China
4School of Public Health and Management,Chongqing Medical University,Chongqing 400016,China
Keywords: social contagions,threshold distribution,heterogeneous adoption thresholds,limited contact
1. I ntroduction
Complex networks are embodied in fields of nature, society, science and technology.[1–9]A real complex system can be abstracted as a network, and then complex properties of the system, such as structure, robustness, function,as well as dynamical processes that occur on networks, can be investigated.[10–23]According to different characteristics of spreading objects, the spreading dynamics on complex networks can be generally divided into two categories: one is the dynamics of biological contagions with independent infection probabilities of any two contacts,such as the epidemic spreading and the spreading of computer viruses,[24–30]the other is the dynamics of social contagions with social reinforcement effect, including rumor diffusion, information spreading, behavior spreading, innovation adoption, and so on.[31–38]It is generally believed that social contagion is the expansion and application of biological contagion,and it is the research basis of social-biological coupling contagion.[39–43]
For the convenience of description,what is transmitted in social contagions is called “behavior”, and behavior spreading is an essential form of social contagions. The social reinforcement effect described in the classic linear threshold model is memoryless, where the adoption threshold is the number or proportion of neighbors in the adopted state.[44,45]Considering the non-Markovian nature of social contagions,many non-Markovian models with memory characteristic have been proposed in recent years.[33,46–55]The research on social contagions with the reinforcement effect based on nonredundant information memory is receiving extensive attention from researchers. Based on the fact that the amount of information that an individual can provide is finite, the nonredundant information transmission method that only allows once successful information transmission between a pair of individuals is adopted. Each individual can remember the non-redundant behavior information passed to him/her by all his/her neighbors.[46]To avoid risks, the probability of behavior adoption when the behavior information is received again depends on the number of previously received behavior information, and before the adoption threshold is exceeded,the more the same behavior information received before, the greater the probability of adopting the behavior.[56]
In numerous literature, the adoption threshold of individuals is usually set to the same static threshold. However, heterogeneity is a topic of great interest for reflecting the ubiquitous inter-individual differences in real social systems.[47,52–55,57,58]In some binary propagation threshold models,the adoption threshold in the population has two static values: equal to 1 and greater than 1, reflecting the high and low willingness to adopt the behavior.[47,52]Furthermore,some researchers set the adoption threshold of individuals to obey a certain probability distribution, which is more appropriate and reasonable than the binary threshold model to reflect the heterogeneity of adoption thresholds. For instance,Karampourniotiset al.[53]observed the non-monotonic variation of cascade size by changing the standard deviation of the threshold distribution obeying a truncated normal distribution and found that there is a specific standard deviation to optimize the spreading when the initiator set is given. Penget al.[54]proposed a heterogeneous propagation threshold model,in which the adoption threshold is positively correlated with degree and a parameter obeying the Gaussian distribution. It can be found that increasing the mean of the adoption threshold distribution will inhibit social contagions.In contrast,how the standard deviation of the adoption threshold distribution affects the changing trend of the outbreak threshold and phase transition is related to the mean adoption threshold and the heterogeneity of the degree distribution. The adoption thresholds of distinct real-world social systems may follow different distribution forms, which is one of the differences in social systems. In addition, in some studies, the setting that individuals can contact all their neighbors is not reasonable enough,and individuals’time,energy and other resources are often limited.[59–63]In contact-limited social contagions,limited contact ability leads to heterogeneity in the practical information transmission probability,and this heterogeneity increases with the increase of degree distribution heterogeneity. For this reason, Wanget al.developed a heterogeneous edge-based compartmental (HEBC) theory. They found that when the network structure heterogeneity exceeds a certain critical value, the growth pattern of the final adoption size on the information transmission probability changes from being continuous to being discontinuous as the limited contact capacity increases.[62]Furthermore, Zhuet al.reported that the crossover phenomenon in the growth pattern of contactlimited social contagions can arise by adequately adjusting the adoption threshold, average degree, or initial seed ratio.[63]Considering both the limited contact capacity and the adoption thresholds obeying a certain distribution, there is still a lack of research on the impact of different distribution forms of heterogeneous adoption thresholds on contact-limited social contagions.
This paper compares the time evolutions,the final behavior adoption size, the outbreak threshold, and the phase transition under the four threshold distribution forms: the Gaussian distribution, log-normal distribution, exponential distribution, and power-law distribution. Notably, the above distributions occupy an important position in both theoretical research and practical application. According to probability theory, when the adoption thresholds obey different probability distribution forms, even if the mean and standard deviation are the same, the distribution shapes of the probability density functions are also different. Through extensive numerical simulations on the Erd¨os–R´enyi (ER) networks and the scale-free(SF)networks,we find that the spreading process of social contagions has a hierarchical characteristic. To be specific, there are three spreading stages, individuals with large degrees and small adoption thresholds adopt the behavior first,and the adoption threshold(degree)of adopted individuals in the second stage generally increases(decreases). In addition,different threshold distributions cause different spreading processes. Further, we investigate how the standard deviation of the threshold distribution affects the steady state of contactlimited social contagions on ER networks. It is shown that as the standard deviation of different threshold distributions increases, there is a change from a discontinuous first-order phase transition to a continuous second-order phase transition for some threshold distributions, and the final adoption size and outbreak threshold will change and finally tend to be stable. On the SF networks, when the adoption thresholds obey the Gaussian distribution,for the case where the standard deviation of the threshold distribution is relatively small, it is found that the behavior adoption can explode only if the degree exponent of SF networks is moderate. Similar qualitative results are also shown from theoretical predictions based on heterogeneous edge-based compartmental theory.
The rest of this paper is arranged as follows: In Section 2, we describe the dynamics of contact-limited social contagions considering heterogeneous adoption threshold. In Section 3,we develop the heterogeneous edge-based compartmental (HEBC) theory to analyze the mechanism of social contagions qualitatively. In Section 4, extensive numerical simulations and theoretical predictions are performed. In Section 5,conclusions are drawn.
2. Heterogeneous contact-limited threshold model
In the human population,there is a universally recognized fact that individuals often have limited resources(such as time and energy), and some personal characteristics of individuals are also different. The former may limit contact capacity,the latter may cause the heterogeneity of adoption thresholds,both of which will significantly affect the dynamics of social contagions. The proposed heterogeneous contact-limited threshold model is based on the generalized non-Markovian susceptibleadopted-recovered(SAR)model,and it considers both the limited contact capacity and the adoption threshold obeying a certain distribution. In the SAR model, it is specified that there are three possible states in the population according to whether the individual participates in the spreading and has adopted the behavior,namely,susceptible state(S state),adopted state(A state),and recovered state(R state).
In the initial stage, a tiny percentage (Q0) of individuals are randomly selected to be in A state (seeds). The remaining individuals are in S state, and these S-state individuals do not initially get any behavioral information from the seeds (i.e.,m=0). At each time step, each A-state individualjwith degreek′attempts to transmit the behavioral information to his/her neighbors with a certain probability. If a random S-state individualiwith degreekreceives the information from individualj,his/her cumulative number of informationmiwill increase one (i.e.,mi=mi+1), which causes the non-Markovian effects. Moreover,individualiwill not receive the same behavioral information from individualj(i.e.,the non-redundant information transmission). Whenmi ≥Ti(threshold of individuali),individualiadopts the behavior. In addition,all A-state individuals try to recover with probabilityγ. If all A-state individuals have become R-state individuals,the dynamics of social contagion terminates. R-state individuals refer to individuals who have adopted the behavior but do not participate in transmitting the behavioral information.
Firstly, in view of the differences in the willingness of individuals to accept the behavior, the heterogeneity of the adoption threshold is considered in the proposed heterogeneous contact-limited threshold model. Precisely,the random variableβrepresenting the adoption threshold distribution(threshold distribution for short)and the degreekjointly determine the adoption thresholdT,i.e.,T=βk. In other words,in the proposed model,not all individuals have the same threshold, but each individual has its own specific threshold, which reflects the heterogeneity of individuals. An S-state individualiwith degreekdoes not adopt the behavior unless the amount of information about the behavior it receives from different neighbors is equal to or greater than its adoption threshold(i.e.,). In the numerical simulations, the value ofβis discrete and the interval is set asε=10-4. In this paper,we consider the four probability distributions of the threshold distributionβ, namely Gaussian distribution, log-normal distribution,exponential distribution and power-law distribution.The basic functional forms of the four threshold distributions are as follows:
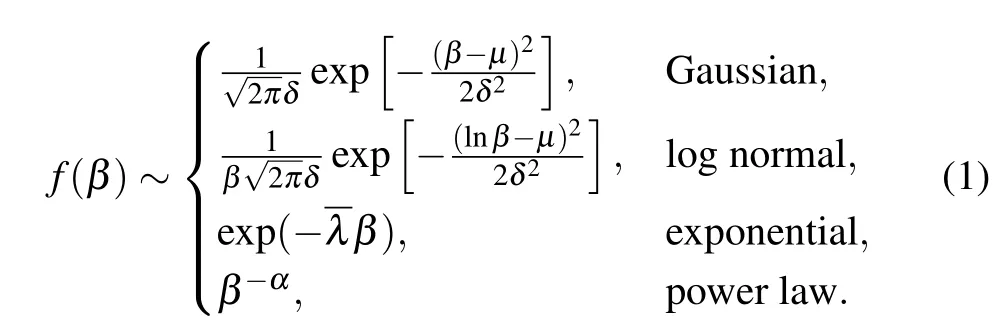
Since the adoption thresholdTcannot be greater than the degreek,the threshold distributionβlies in the range 0≤β ≤1,otherwise susceptible individuals will never adopt the behavior. In the above threshold distributions, the meanMand the standard deviationΔare two very important parameters. Obviously,different threshold distributions have differentMandΔ. For Gaussian threshold distribution,the meanM=μ,and the standard deviationΔ=δ. Differently, the mean of the log-normal threshold distribution isM=exp(μ+δ2/2), and its standard deviation isΔ=[exp(δ2)-1]exp(2μ+δ2). In particular, the mean and standard deviation of the exponential threshold distribution is the same, which isM=Δ=λ.Whenβpossesses a power-law distribution,which is a highly skewed distribution, there is no explicit expression for the mean and standard deviation.
In addition,in contact-limited social contagions,it is not always possible for the A-state individual to select his/her every edge to transmit the behavioral information, that is, the number of accessible edges of the A-state individual is limited. Therefore, combined with the above threshold heterogeneity, a heterogeneous contact-limited threshold model is proposed in this paper. In contact-limited propagation, an Astate individualjwith degreek′that has adopted the behavior will randomly chooseH(k′)edges from all its edges(i.e.,unpreferential contact process) to transmit the behavioral information to its adjacent individuals,whereH(k′)represents the contact capacity of individualjand the actual value ofH(k′)does not exceedk′. In other words, the probability that each edge of individualjis selected isH(k′)/k′. The information transmission probability(transmission probability for short)of the selected edge isλ,and the effective information transmission probability can be obtained asλH(k′)/k′. Fixed the degree distributionp(k)and the meanMand standard deviationΔof the threshold distribution,then we can compare and analyze the impact of different forms of threshold distribution on contact-limited social contagions.
3. Theoretical analysis
In the proposed model, the dynamical heterogeneity of the contagion system is mainly reflected in two aspects.Firstly, an individual’s adoption threshold depends on its degree and other personal characteristics. Thus the adoption threshold usually varies from individual to individual. Secondly, considering that the contact ability of A-state individuals is restricted,the A-state neighbors connected to different edges of S-state individuals may have different degrees,which leads to the heterogeneity of the effective transmission probability of the edges. Note that the two kinds of dynamical heterogeneity are closely related to the network structure heterogeneity. Given the above-mentioned dynamical heterogeneity and the dynamical correlations caused by social reinforcement, here our goal is to describe the contact-limited social contagions with heterogeneous adoption thresholds through HEBC theory.
For a random individualiwith degreek,itskneighbor individuals usually have different degrees. We denoteπk′(t) as the probability that a neighborjwith degreek′has not transmitted the information to individualialong the edges between it andiuntil timet. Considering all possible values of degreek′, the probability that individualihas not received an information until timetis
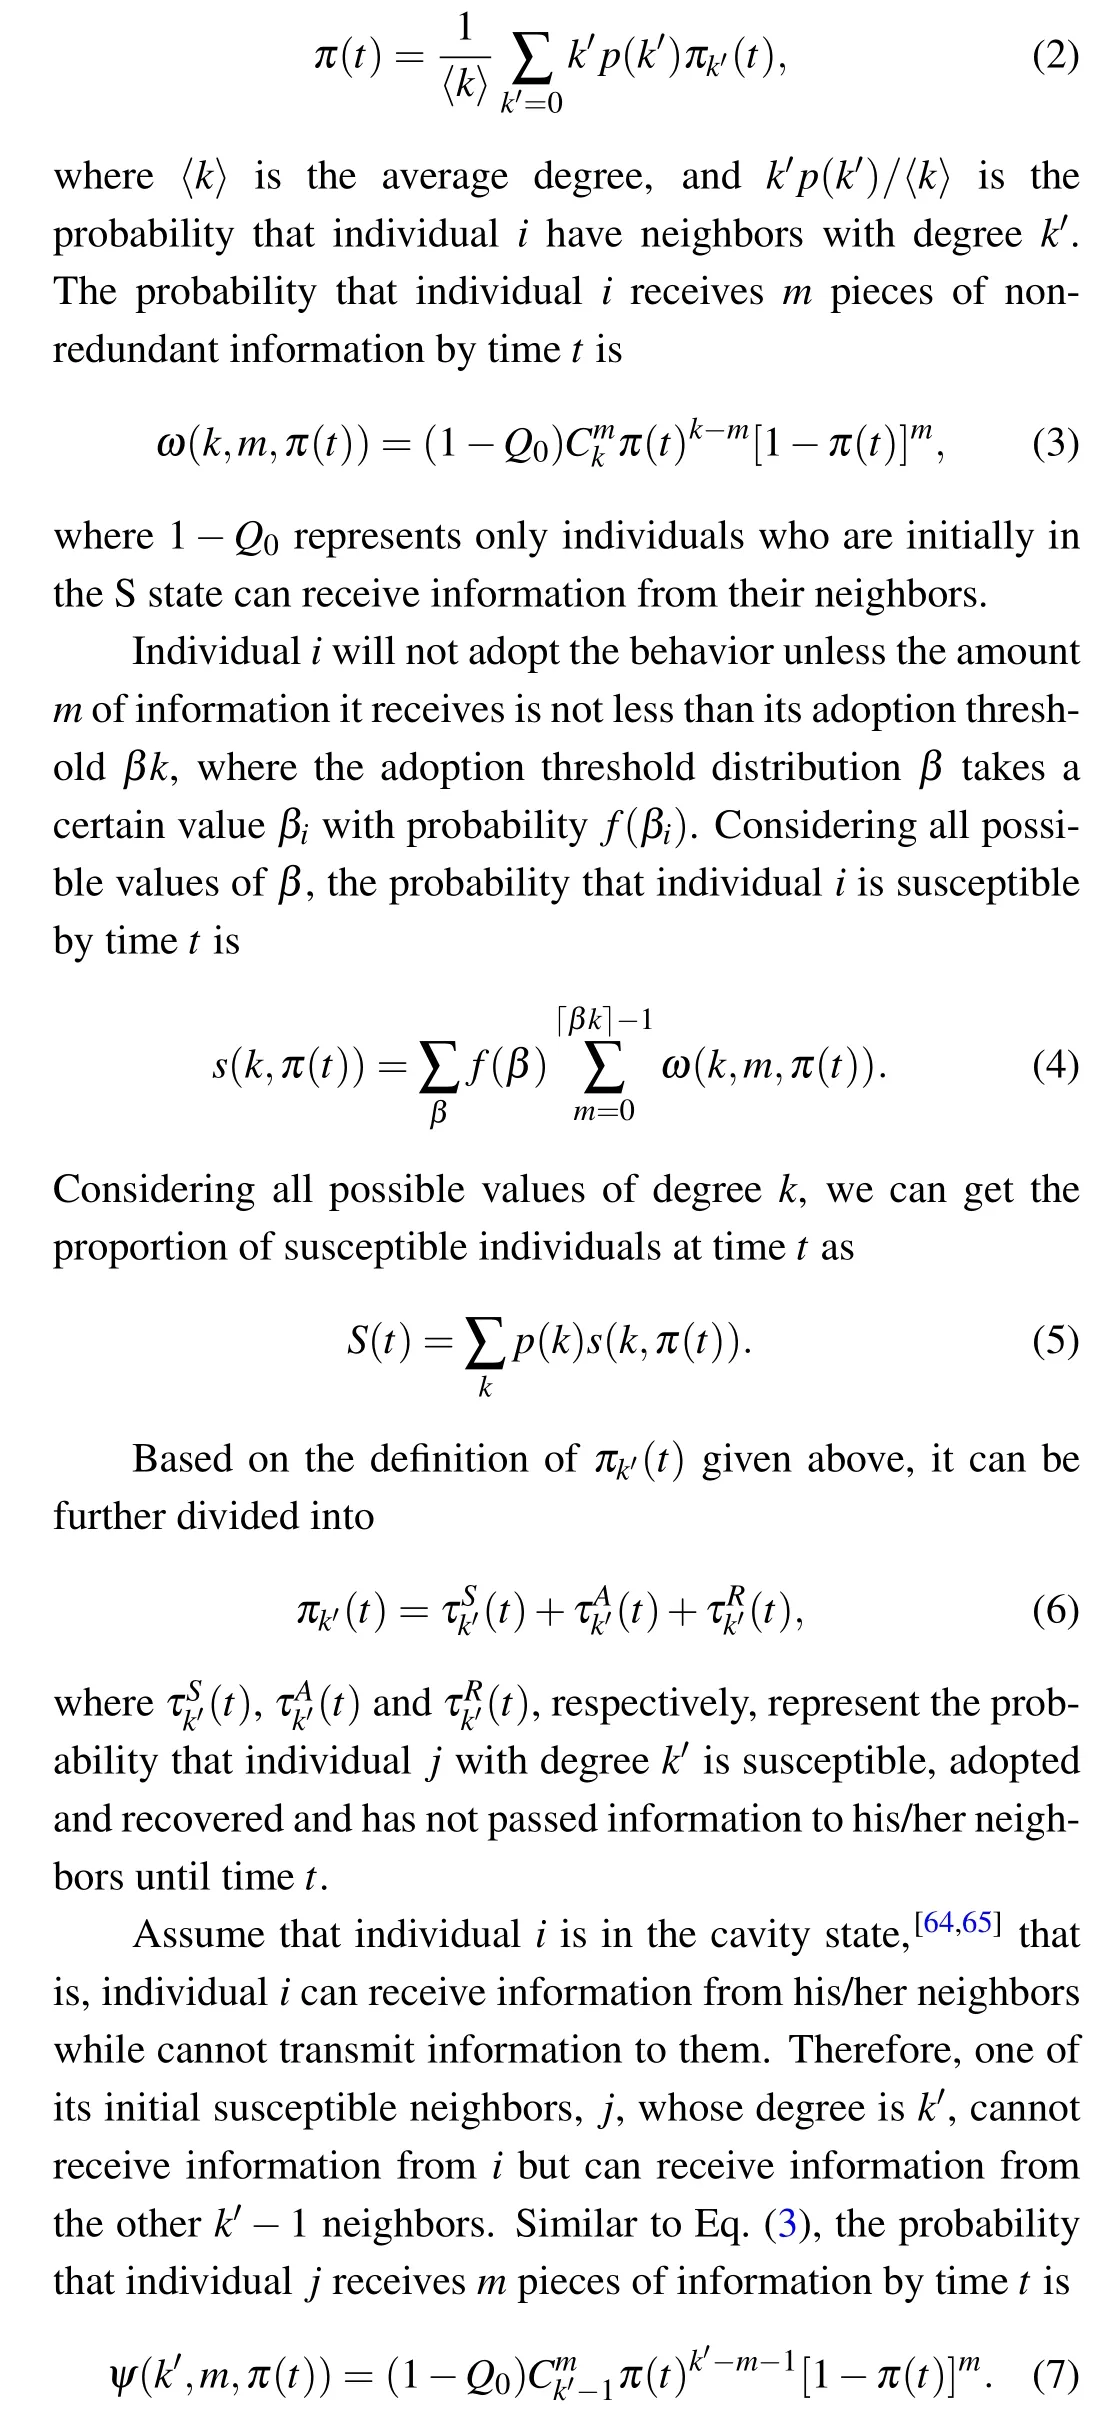
For a given threshold distribution functionf(β),the following two kinds of individuals may exist in the network: (i)activists with adoption thresholdTk=1; (ii) bigots with adoption thresholdTk >1. More specifically,for individualjwith degreek′,the probability of being an activist is
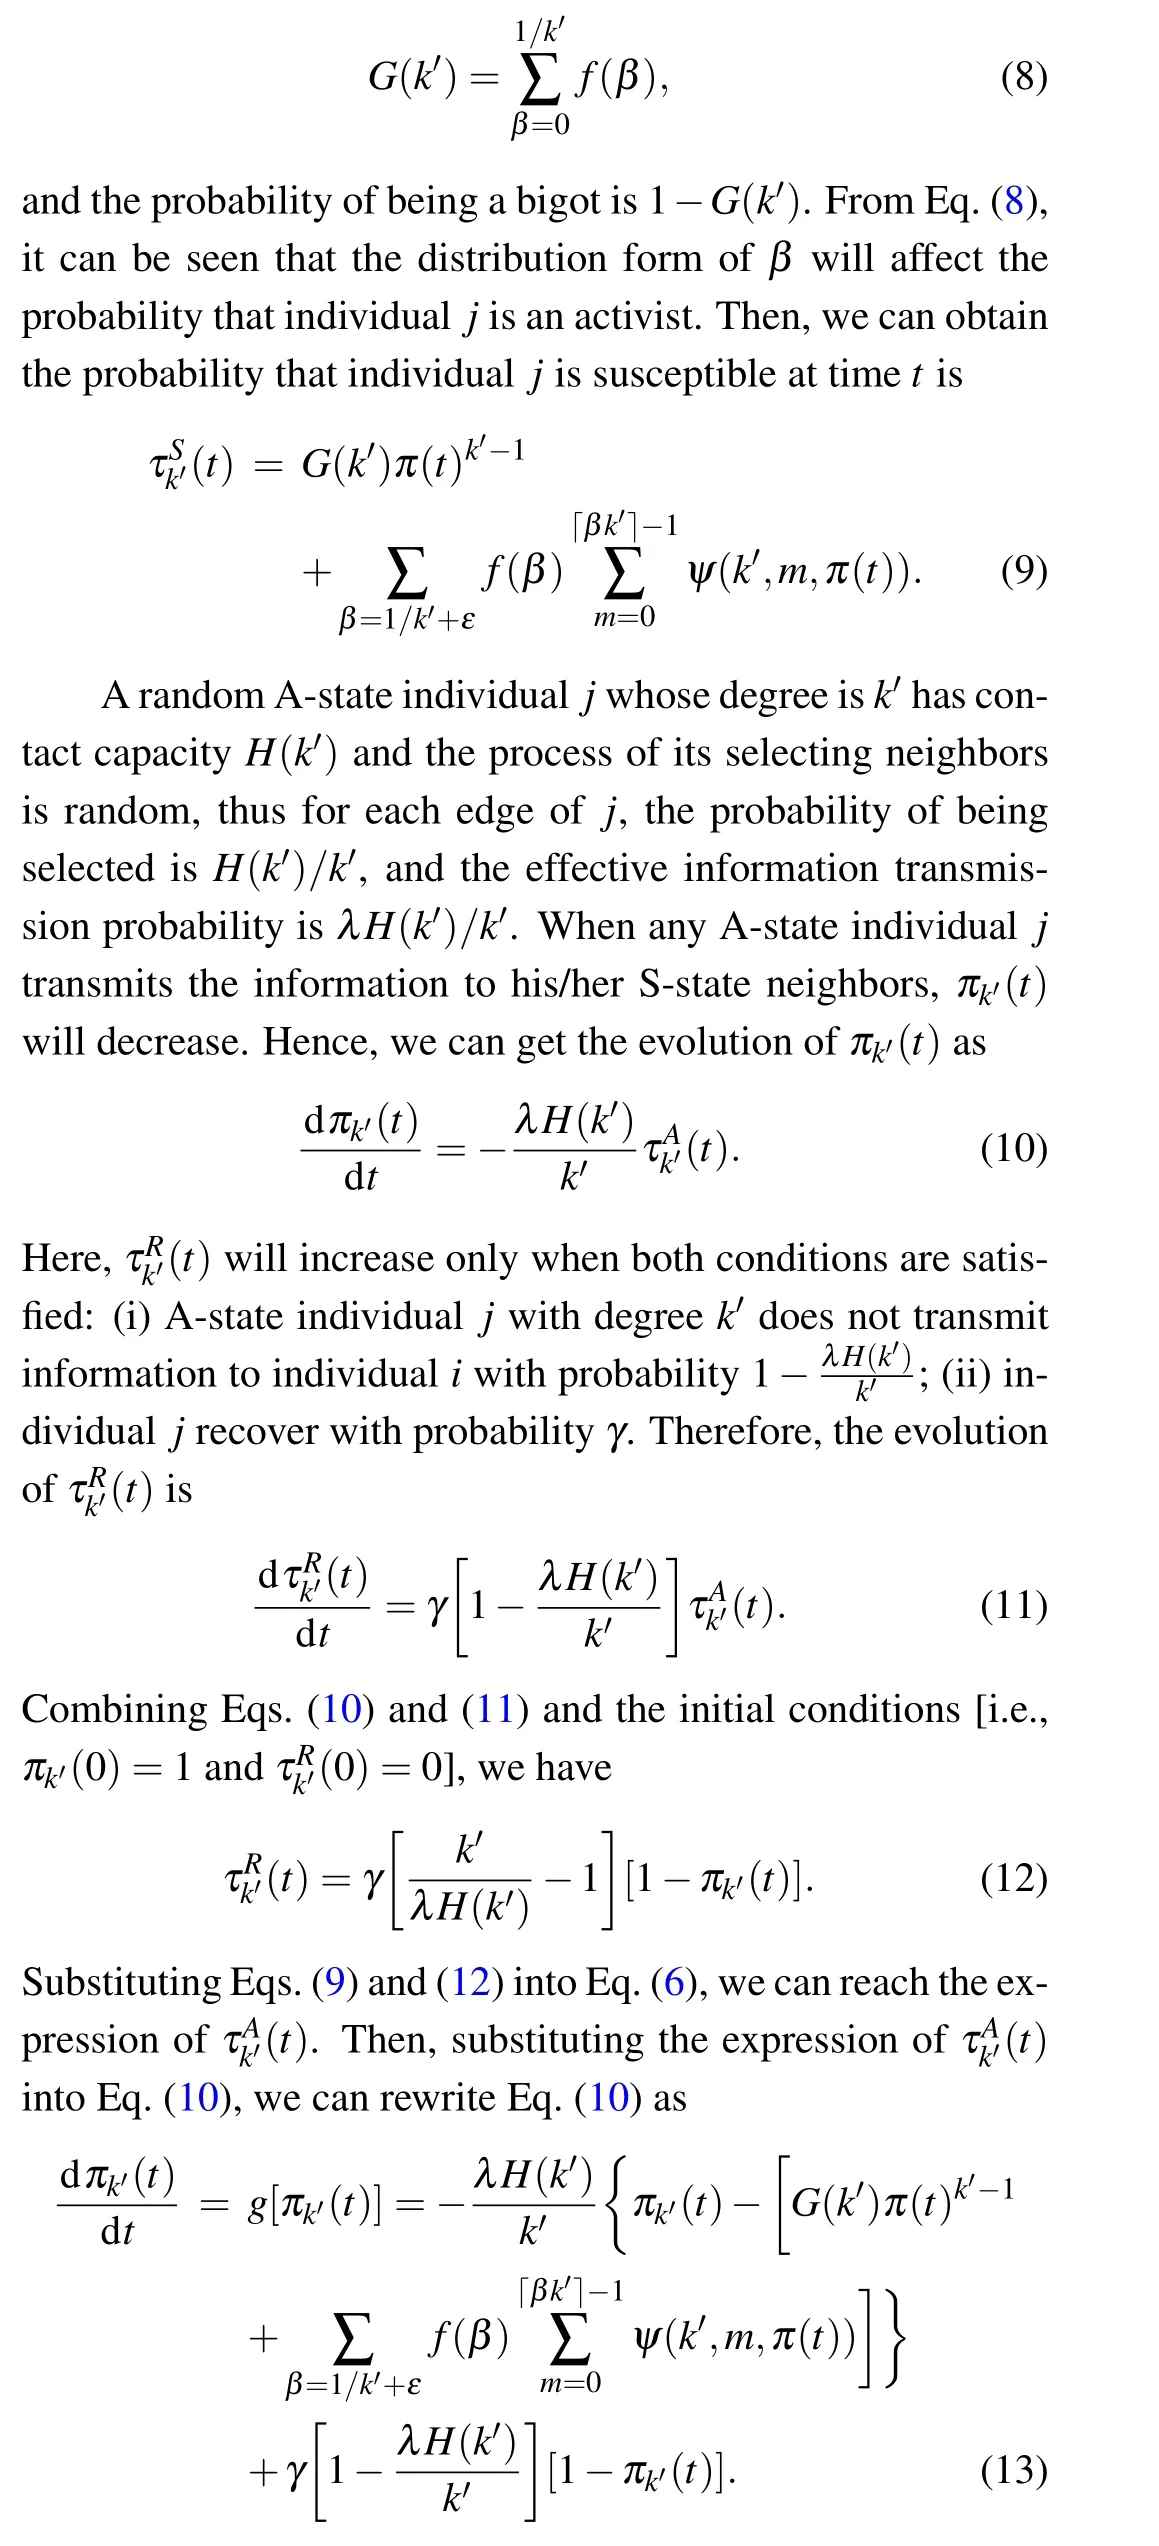
LetS(t),A(t) andR(t) denote the proportions of individuals who are susceptible, adopted and recovered at timet,respectively. When the social contagion ceases,there are only S-state individuals and R-state individuals in the system, andR(∞)represents the final adoption size. We can also give the evolution equations ofA(t) andR(t) according to the model description in Section 2,
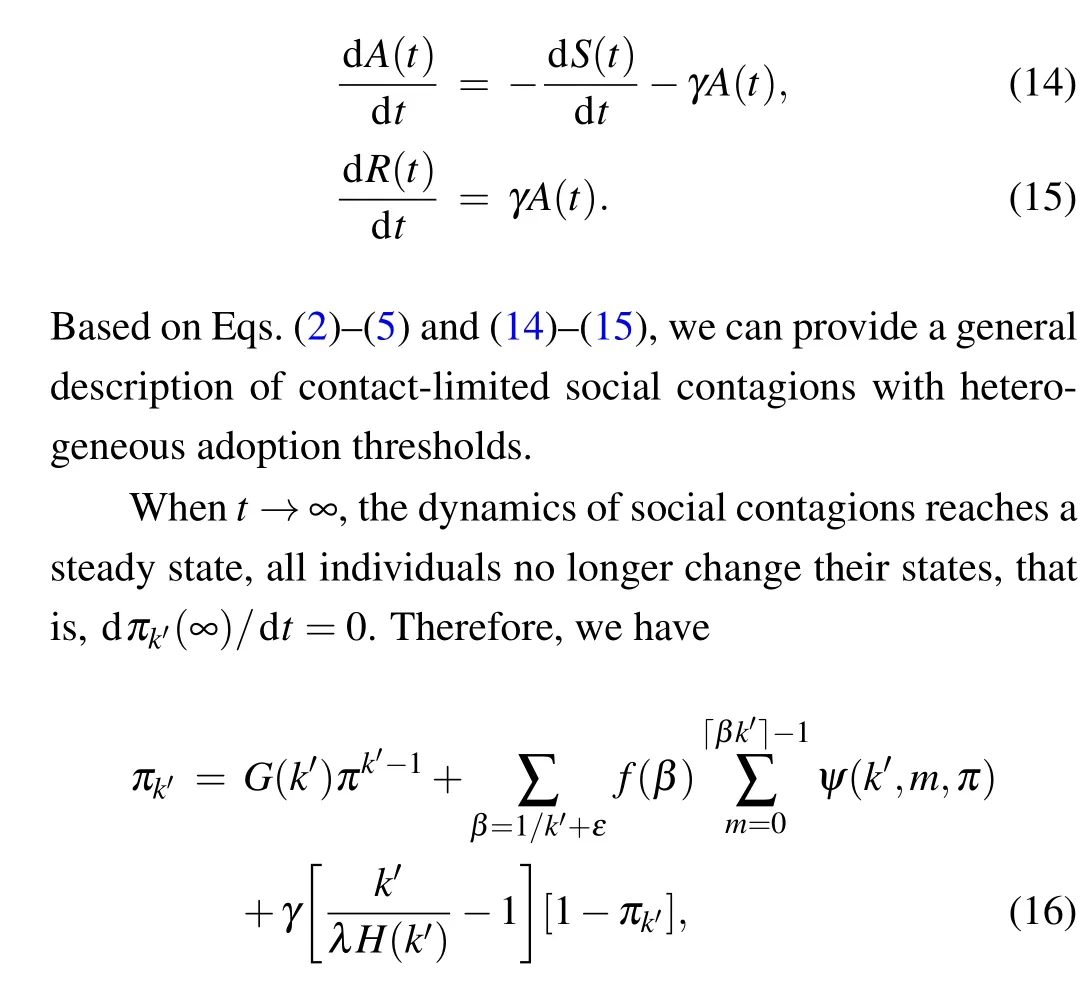
whereπk′representsπk′(∞) andπrepresentsπ(∞) , and the same in the following. By numerically iterating Eqs. (7)and (16), we can obtain the value ofπk′. Then, by utilizing Eqs.(2)–(5),the values ofS(∞)andR(∞)=1-S(∞)can be obtained.
In addition toR(∞), the outbreak thresholdλc(i.e., the critical information transmission probability)is also an essential measure of the steady-state of propagation. However, the nonlinearity of Eqs. (7) and (16) makes it impossible to obtain an explicit analytical solution ofλc. In general, the linear stability analysis method is used to describe the system dynamics near the critical point. Assume that thendegrees of the social system arek′1,k′2,...,k′n, individuals with the same degreek′lare assigned a variableπk′l(l= 1,2,...,n),that is, the social system is described bynvariables. According to the linear stability analysis method, in the system withnvariables described by Eq. (13), thesenvariables remain unchanged at the critical point (πk⋆1,πk⋆2,...,πk⋆n), thus we haveg[πk⋆l]=0(l=1,2,...,n). The point near the critical point can be expressed asπk′1=πk⋆1+ν1,πk′2=πk⋆2+ν2,...,πk′n=πk⋆n+νn, whereν1,ν2, ...,νnare all small quantities.Consideringnvariablesπk′1,πk′2,...,πk′n, performing Taylor expansion on the right-hand side of Eq. (13) at the critical point (πk⋆1,πk⋆2,...,πk⋆n), and ignoring the second-order terms and smaller higher-order infinitesimals,we obtain
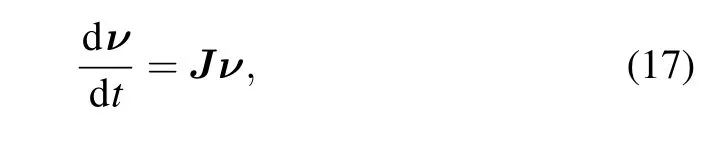
wherevis ann-element vector(ν1,ν2,...,νn),Jis a Jacobian matrix,
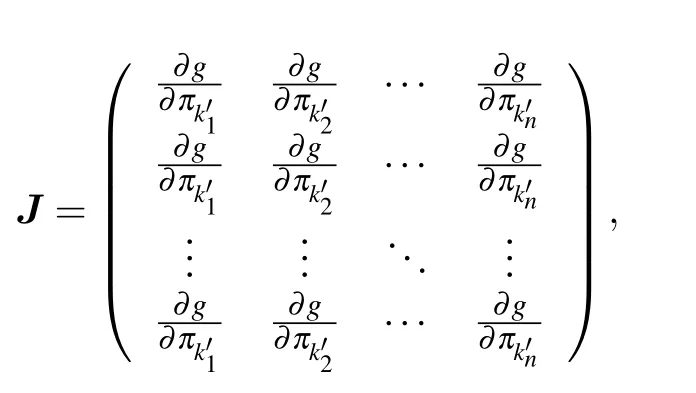
where all derivatives take the value at the critical point.
4. Simulation and analysis
First,we study the hierarchical phenomena of the spreading process of contact-limited social contagions. The socalled hierarchical nature of the spreading process is that some individuals adopt the behavior first,and some individuals adopt the behavior later.Figure 1 shows the time evolutions of contact-limited social contagions with adoption thresholds obeying a Gaussian distribution. The total number of time stepstall(convergence time) at the end of the spreading reflects the spreading efficiency. Specifically, the larger thetallis,the weaker the spreading efficiency is. In order to measure the diversity of the attributeχof newly adopted individuals,the inverse participation ratioDχ(t)[68]is used as the diversity measure,which is defined as
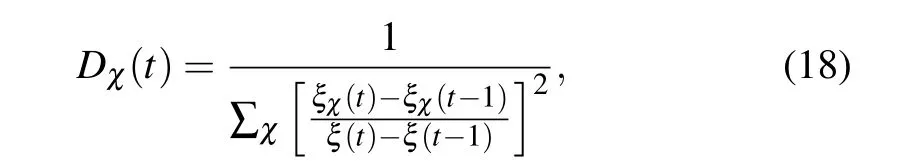
where the attributeχ ∈{k,T,β}withk,Tandβrepresenting the degree, adoption threshold and threshold distribution,respectively, andξ(t) (ξχ(t)) is the number of A-state individuals (A-state individuals with attributeχ) at timet. The larger theDχ(t), the larger the number of distinct communities divided according to the value of attributeχ. In particular,Dχ(t)=1 indicates that the newly A-state individuals have the same attributeχ.
As shown in Fig. 1, the three regions (regions I, II and III)divided by three different colors represent the three stages of the spreading process. The time step at whichnA(t) and〈TA(t)〉reach the peak value is the basis of dividing the propagation stage. In the I stage,nA(t) increases with timetand reaches the peak (whent=11), the value of〈kA(t)〉is large(around 10)and changes little with timet,the value of〈TA(t)〉(〈βA(t)〉) increases with timetand is less than 1 (less than 0.1). In the II stage,nA(t) decreases to a minimum value as timetincreases, and the value of〈TA(t)〉(〈βA(t)〉) increases to a peak value (big value) as timetincreases, and the value of〈kA(t)〉decreases compared with that of the I stage. In addition,the values ofDk(t),DT(t)andDβ(t)increase to a peak value and then decrease in the II stage. In the III stage, the value ofnA(t)is minimal, and the value of〈kA(t)〉continues to decrease compared with that of the II stage,〈βA(t)〉continues to increase with timet, and the value of〈TA(t)〉slightly decreases compared with the peak value.
The newly A-state individuals of the three stages have a big difference in the degree and adoption threshold,reflecting the hierarchical characteristics of the social contagion process with unbiased contacts. In general, in the I stage, many individuals with high degrees and small adoption thresholds adopt the behavior first. In the II stage, compared with the I stage,some individuals with more minor degrees(large in fact)and relatively large adoption thresholds adopt the behavior. Finally,in the III stage,a few individuals with large degrees and large adoption thresholds(〈kA(t)〉is about 6,〈TA(t)〉is about 1.5) adopt the behavior. In this way, the behavior is progressively spread over the network.
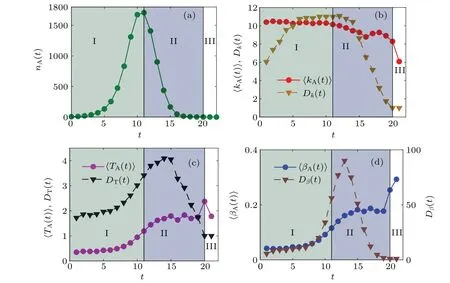
Fig.1. For Gaussian threshold distribution,the time evolutions of contact-limited social contagions on the ER networks. (a)The number nA(t),(b) average degree 〈kA(t)〉, degree diversity Dk(t), (c) average adoption threshold 〈TA(t)〉, adoption threshold diversity DT(t), (d) average threshold distribution〈βA(t)〉and threshold distribution diversity Dβ(t)of newly A-state individuals versus time steps t. Other parameters are set as M=0.1,Δ =0.1 and λ =0.6.
Next,we study how different threshold distribution forms affect the hierarchy of the spreading process. Figure 2 shows the time evolutions of contact-limited social contagions under four different threshold distribution forms(Gaussian distribution, log-normal distribution, exponential distribution, and power-law distribution). From Fig.2,we see that the spreading efficiency under the Gaussian threshold distribution is weakest(i.e.,tallis largest),and the propagation efficiency under the other three threshold distributions is relatively strong,among which the propagation efficiency under the powerlaw threshold distribution is the strongest. For the propagation rate, as shown in Fig. 2(a), the spreading rate under the power-law threshold distribution is faster (i.e.,nA(t) is larger (smaller) whentis small (large)), the slowest is under the Gaussian distribution, and the spreading rate under lognormal distribution and exponential distribution is very close.As shown in Figs. 2(b), 2(c) and 2(d), in the I and II stage,the〈kA(t)〉,〈TA(t)〉and〈βA(t)〉under these four threshold distributions are all close,〈kA(t)〉decreases slightly around〈k〉=10 and〈TA(t)〉(〈βA(t)〉)increases from a value less than 0.1(1)to about 0.2(2). While in the III stage,the〈kA(t)〉under the exponential threshold distribution increases withtto a relatively large value(close to 14),and the〈βA(t)〉under lognormal distribution and power law distribution decreases withtto a smaller value. Contrastively,whenβobeys exponential distribution and Gaussian distribution,〈βA(t)〉increases withtto a larger value(about 0.28). In addition,for any threshold distribution here,Dk(t)andDβ(t)increase to a relatively large value astincreases in stage I,because the number of newly Astate individualsnA(t)increases withtin stage I,while in the vicinity of stage II and stage III,Dk(t)andDβ(t)decrease to a relatively small value astincreases[see Figs.2(e),2(f),and 2(g)].
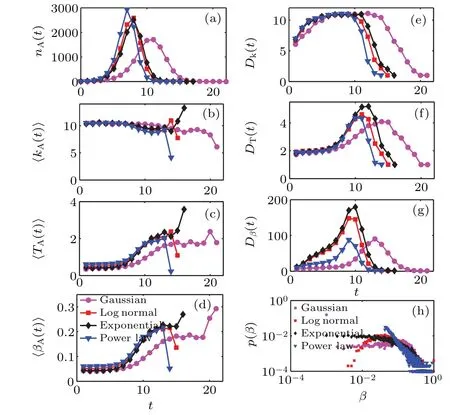
Fig.2. Effects of threshold distribution forms on the hierarchy of the spreading process of contact-limited social contagions on the ER networks. (a)The number nA(t), (b)mean degree〈kA(t)〉, (c)average adoption threshold〈TA(t)〉,(d)average threshold distribution〈βA(t)〉,(e)degree diversity Dk(t),(f)adoption threshold diversity DT(t)and(g)threshold distribution diversity Dβ(t)of newly A-state individuals versus time t for the Gaussian threshold distribution(purple circles),log-normal threshold distribution(red squares),exponential threshold distribution(black diamonds)and power law threshold distribution (blue down triangles). (h) The probability distribution diagram of threshold β under the four threshold distribution forms. Other parameters are set as M=0.1,Δ =0.1,and λ =0.6.
In brief, when the network and the mean and standard deviation of the threshold distribution are fixed, the probability distribution ofβis very different under different distributions. As shown in Fig. 2(h), when the threshold distributionβobeys the Gaussian distribution, the threshold distribution is relatively uniform; whenβobeys the power-law distribution, there is almost no smallβ, and the probability thatβis between 0.1 and 1 is large. For the case thatβobeys the exponential distribution, the probability thatβis very small(between 0.001 and 0.01) is greater than the other three distributions. For the probability thatβ <0.01, the exponential distribution>log-normal distribution. For the probability thatβis between 0.01 and 0.1, the log-normal distribution>exponential distribution. It is known thatT=βk, so the distribution of adoption thresholdTis also very different, which leads to the difference in the spreading process under different threshold distributions. In addition, whenβobeys the exponential distribution,the individuals with the largest thresholds and degrees adopt the behavior in stage III,and whenβobeys the power-law distribution, the individuals with the most minor thresholds and degrees adopt the behavior in stage III.
Further, it is necessary to study the effects of the threshold distribution form on the final behavior adoption sizeR(∞)and outbreak thresholdλc(the critical information transmission probability) of contact-limited social contagions. According to Ref.[54],the influence of the standard deviation of the threshold distribution on social contagions depends on the size of the mean of the threshold distribution. Specifically,for some relatively large threshold distribution mean,the changes of the phase transition and outbreak threshold of the propagation system are more abundant. Therefore, in this article,we set the mean threshold distribution to be a relatively large value(i.e.,M=0.15)and observe the spreading results under different threshold distribution and standard deviations. From Fig.3,we can see that the theoretical predictions and simulation results ofR(∞)under the power-law threshold distribution are slightly biased whenΔ=0.1[see Fig.3(a)],and the consistency between them is relatively good in Figs.3(b)and 3(c).In addition,the peak value of of the relative varianceVRof the simulatedR(∞)can be used to estimate the simulated value ofλc[69][see Figs.3(d)–3(f)].VRis defined as
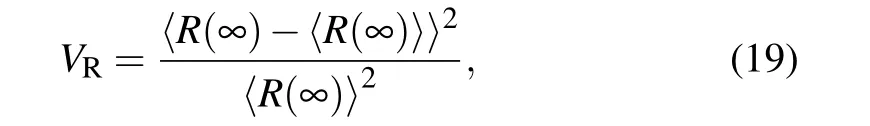
where〈···〉denotes ensemble averaging,and 103independent dynamical realizations in a fixed network are performed to obtainVR.
ForΔ=0.1, the inset of Fig. 3(a) shows that the probability distribution under the Gaussian or log-normal threshold distribution has prominent fat tails (i.e., the probability thatβ >0.1 is relatively large), and there are also quite a few individuals withβ ≤0.1. In contrast, theβof almost all individuals is roughly greater than or equal to 0.1 whenβobeys a power-law distribution. For the former, whenλincreases toλc,the individuals withβ ≤0.1 adopt the behavior almost simultaneously, making the growth form ofR(∞)–λshow a first-order phase transition. Then, asλcontinues to increase, the individuals withβ >0.1 also adopt the behavior successively,and the system presents a second-order phase transition. For the latter, only whenλincreases toλc, these individuals with largeβwill adopt the behavior in cascade,and the system presents a first-order phase transition. As the standard deviationΔincreases to 0.15 or 0.2 [see Fig. 3(b)or Fig. 3(c)], we find that the system exhibits a continuous second-order transition under different threshold distributions,which is because the probability distribution ofβbecomes more and more polarized with the increase ofΔ. The number of individuals with a particularly smallβand the number of individuals with a particularly largeβboth increase. In addition,asΔincreases,the relationship between theλcandR(∞)of different threshold distributions also changes. Obviously,asλincreases, for the power-law threshold distribution, theλcchanges from the largest to the smallest, and whenλ=1,R(∞) is smaller than 1 more obviously, and theλcunder the Gaussian threshold distribution is always larger than theλcunder the log-normal threshold distribution. We can explain the phenomena mentioned above as follows: Firstly,when the mean and standard deviation of the threshold distribution is the same,the probability thatβis particularly small(i.e.,β <0.1)is different for different threshold distribution forms. Individuals with very smallβcan quickly adopt the behavior to promote social contagions (i.e.,λcdecreases). Therefore, as the standard deviationΔincreases, when the probability thatβunder a certain threshold distribution is very small is larger,itsλcis smaller. In the same way, it can be stated that whenλ=1,R(∞) under the Gaussian threshold distribution is the largest. Secondly,individuals with a particularly largeβ(i.e.,β ≫0.1) usually have an extensive adoption threshold, and their contact capacity is limited. Therefore, whenλ=1, individuals whoseβis close to 1 may not be able to adopt the behavior,which leads toR(∞)less than 1.
Next, there is another very important phenomenon that the intersection ofR(∞)–λunder the exponential threshold distribution andR(∞)–λunder the log-normal threshold distribution when the standard deviationΔ=0.15 [see Fig. 3(b)].We note that whenλis relatively small, theR(∞) under the exponential threshold distribution is greater than theR(∞)under the log-normal threshold distribution, the situation is opposite whenλis large. This is because,under the exponential threshold distribution, there are many individuals whoseβis relatively very small,and these individuals can quickly adopt the behavior,prompting the social contagion whenλis small.However,the exponential threshold distribution has a lot of fat tails (i.e.,β ≫0.1), and the probability ofβnear 0.1 under the log-normal threshold distribution accounts for the majority. Its fat tails are less relative to the exponential threshold distribution [see the inset of Fig. 3(b)]. These individuals in the fat-tailed part(i.e.,individuals with a particularly largeβ)are challenging to adopt the behavior to suppress social contagion. Compared with the log-normal threshold distribution,the exponential threshold distribution has more fat tails,so itsR(∞)is smaller.
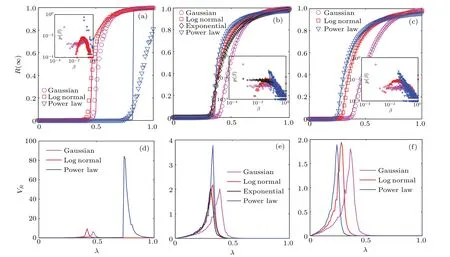
Fig. 3. The dynamics of contact-limited social contagions under different threshold forms on the ER networks. When the mean threshold distribution M=0.15,the final behavior adoption size R(∞)versus the information transmission probability λ for(a)Δ =0.1,(b)Δ =0.15 and(c)Δ =0.2. The corresponding relative variance VR versus λ for Δ =0.1,0.15,0.2 are presented in(d),(e)and(f),respectively. In(a),(b)and(c),different colored lines and points represent the theoretical and simulation results of R(∞)under different threshold distribution forms,respectively. The insets of(a),(b)and(c)show the corresponding probability distribution diagrams of threshold β.
It can be seen from Fig.3 that when the average threshold distributionM=0.15,the impact of different threshold distribution forms on contact-limited social contagions varies with the standard deviationΔof the threshold distribution. For the above situation, Fig. 4 shows the theoretical results ofR(∞)on the panelλ–Δin more detail. When the spreading can break out,asΔincreases,the outbreak thresholdλcdecreases rapidly first,then tends to be stable. More concretely,the stable value ofλcunder the Gaussian threshold distribution is the largest, and the stable value ofλcunder the power-law threshold distribution is the smallest. We can understand like this that whenΔis large(Δ >0.3),the number of individuals with a small adoption threshold under the power-law threshold distribution is the largest, which is very conducive to behavior adoption and leads to a relatively minimumλc. Similarly, the largest number of individuals with a large adoption threshold under the Gaussian threshold distribution leads to the largestλc. In addition, asΔincreases, the value ofR(∞)under the Gaussian threshold distribution shows a clear downward trend whenλapproaches 1[see Fig.4(a)],while for the log-normal threshold distribution and the power-law threshold distribution,whenλis close to 1,the value ofR(∞)is approximately 1[see Figs.4(a)and 4(b)]. We can realize that whenλis close to 1,what can affect the size ofR(∞)is the proportion of individuals with a substantial adoption threshold. That is to say, when adoption thresholds obey the log-normal distribution and the power-law distribution, asΔincreases, the number of individuals with a substantial adoption threshold does not change significantly,and it increases significantly under the Gaussian threshold distribution. Regarding the system phase transition, we can notice that with the increase ofΔ,there will be a crossover phenomenon under these three threshold distribution forms, from a discontinuous first-order phase transition to a continuous second-order phase transition.
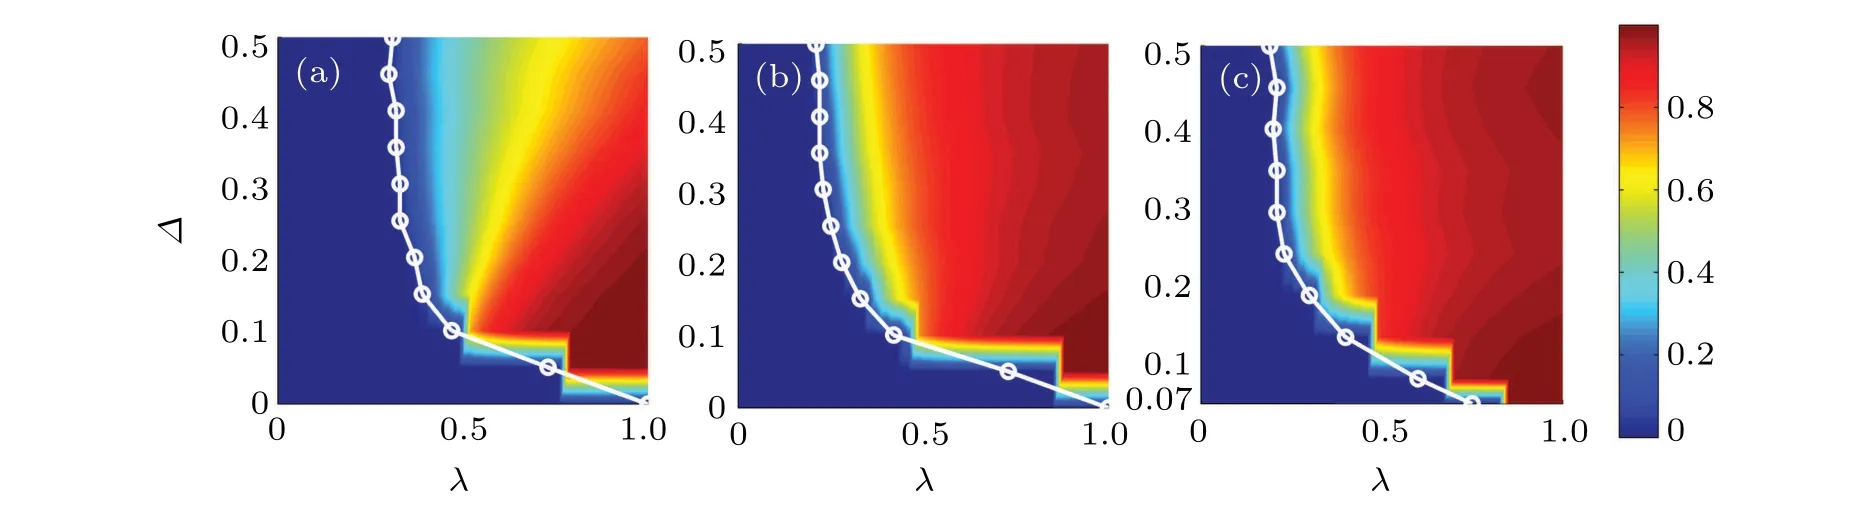
Fig.4. On the ER networks,the final behavior adoption size R(∞)versus the information transmission probability λ and the standard deviation of threshold distributions Δ. (a)Gaussian threshold distribution,(b)log-normal threshold distribution,and(c)power law threshold distribution,showing the theoretical predictions of R(∞) in the plane λ–δ, respectively. It is noted that the results for the power low case are not shown when Δ <0.07 in(c), because the standard deviation of the power low distribution will not be equal to 0. Other parameters are the mean of threshold distributions,M=0.15,γ =1.0,Q0=0.0005,c=8.
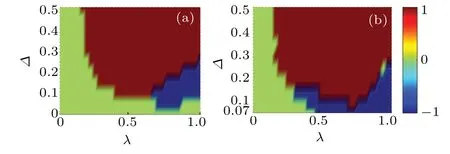
Fig. 5. On the ER networks, compared to the spreading results under Gaussian threshold distribution,the effects of log-normal threshold distribution and power law threshold distribution. In the plane λ–Δ, the color-coded values of (a) R(∞) under the log-normal threshold distribution minus R(∞)under the Gaussian threshold distribution,(b)R(∞)under the power law threshold distribution minus R(∞)under the Gaussian threshold distribution. We set 1 (red), 0 (green) and -1 (blue) to represent promoting, no affecting, and inhibiting effects, respectively.Other parameters are the mean of threshold distributions, M =0.15,γ =1.0,Q0=0.0005,c=8.
According to Fig. 4, Fig. 5 further shows the results of subtracting the theoretical value ofR(∞) under the Gaussian threshold distribution from the theoretical value ofR(∞) under the other two threshold distributions, respectively, when other parameters are the same. In order to show more intuitively, 1 and-1 are respectively used to indicate the cases
where the result of the subtraction is greater than 0 and less than 0. In this way,it can be seen that based on the final adoption size under the Gaussian threshold distribution, the promotion or suppression of the other two threshold distribution forms varies with the changes ofΔandλ. Compared Fig. 5 with Fig.4,it can be observed that the green area in Fig.5 corresponds to the local behavior adoption region in Fig. 4 (i.e.,when the spreading is over, there are very few adopted individuals). Moreover, the red area and blue area in Fig. 5 correspond to the global behavior adoption region in Fig.4(i.e.,the spreading can break out,and there is a certain percentage of adopted individuals). From the distribution characteristics of the blue area and the red area in Fig.5,it can be found that when the average adoption thresholdM=0.15 and other parameters are fixed, for the log-normal threshold distribution,when the value ofΔis small,and the value ofλis large(e.g.,0.1<Δ <0.2 and 0.7<λ ≤1),its propagation effect is not as good as the Gaussian threshold distribution[see Fig.5(a)];for the power-law threshold distribution,when the value ofΔis small(e.g.,0.07<Δ <0.2),it does not propagate as well as the case of the Gaussian threshold distribution[see Fig.5(b)].To explain the above phenomenon,the most fundamental reason is that under different standard deviations,the probability distribution diagrams of these types of threshold distributions are different. Compared with the Gaussian threshold distribution,the promotion or inhibition of the other two threshold distributions depends on the number of individuals with a relatively small adoption threshold whenλis small,and depends on the number of individuals with a relatively large adoption threshold whenλis large.
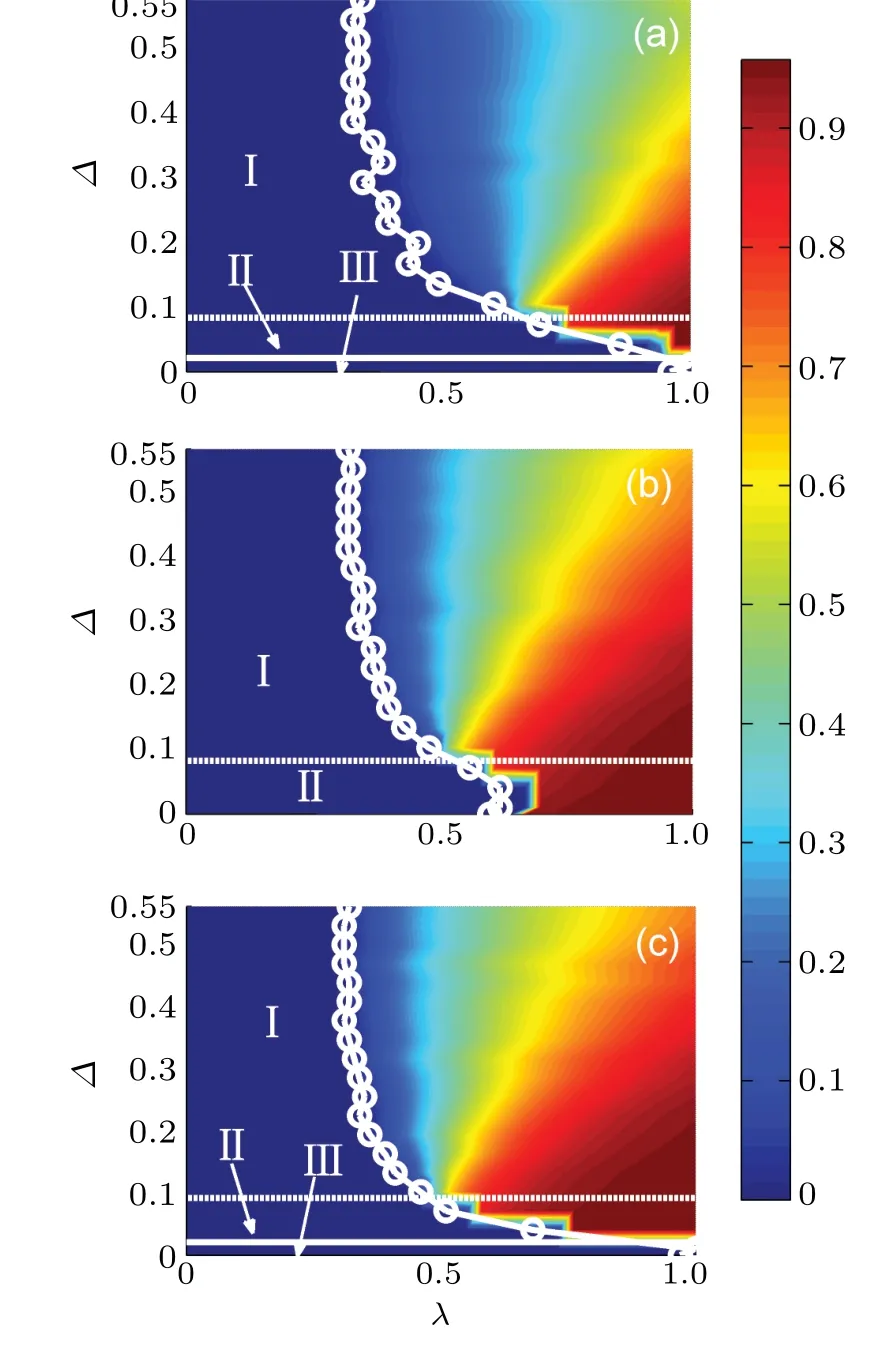
Fig.6.On the SF networks,the final behavior adoption size R(∞)under the Gaussian threshold distribution versus λ and Δ. The color-coded values of the theoretical R(∞) in the plane λ–Δ for (a) γD =2.1, (b)γD =3.0 and (c) γD =3.5. In region III, there is only local behavior adoption, and in region I (II), the grow pattern of the dependence of R(∞)on λ is continuous(discontinuous). The circles with straight lines in the figure represent the simulated values of the outbreak threshold λc. Other parameter is the mean of threshold distributions M =0.15,γ =1.0,Q0=0.0005,c=8.
Finally, on the SF networks with degree distributionp(k)=k-γD,we also perform lots of theoretical fittings to explores the influence of the heterogeneity of degree distribution on contact-limited social contagions with Gaussian threshold distribution. Figure 6 shows the theoretical predictions ofR(∞)versusΔandλ. It is known that the degree distribution heterogeneity of the SF network decreases as the power-law degree exponentγDincreases. According to the size ofR(∞)and the type of phase transition,Fig.6 can be divided into different regions. As shown in Fig.6,when the heterogeneity of the degree distribution is relatively substantial[e.g.,γD=2.1,see Fig.6(a)]and relatively weak[e.g.,γD=3.5,see Fig.6(c)],only when the standard deviationΔof the threshold distribution is greater than a critical pointΔS(see the horizontal white solid line), the behavior adoption can break out. However,when the heterogeneity of the degree distribution takes an intermediate value [e.g.,γD= 3.0, see Fig. 3(b)], there is no region III in Fig.3(b)(i.e.,global behavior adoption can occur for any value ofΔ). In general,an appropriate network structure heterogeneity promotes contact-limited social contagions.AsΔincreases,there is a crossover phenomenon between regions II and I: the growing pattern ofR(∞)versusλchanges from being discontinuous to being continuous (see the horizontal white dashed lines in Fig.6). For the case ofγD=3.0[see Fig. 6(b)], in region II, it can be noticed thatλchardly changes,while in region I,λcdecreases first and then tends to a stable value.For the case ofγD=2.1 or 3.5,there is only the latter kind of change mentioned above.
5. Conclusion
In summary, we have studied heterogeneous adoption thresholds on contact-limited social contagions. First,we propose a heterogeneous contact-limited threshold model to describe the dynamics of contact-limited social contagions with adoption thresholds obeying a certain distribution, in which four threshold distributions are considered, and each adopted individual can only contact a certain number of his/her neighbors at each moment.Then,we develop a heterogeneous edgebased compartmental theory to analyze the proposed model,and numerical simulations verify the correctness of the theoretical results. Through simulations on the ER networks, we find that the spreading process of social contagions can be divided into three stages, and the average degree and average adoption threshold of newly adopted individuals change with timet. Individuals with a high degree and a small adoption threshold adopt the behavior first. In addition, we find that when the mean of the adoption threshold distribution is fixed to a medium value (M=0.15), as the standard deviation of the threshold distribution increases, there will be a crossover phenomenon of growth forms under some threshold distributions. Finally,the results on the SF networks show that when the adoption thresholds obey a Gaussian distribution, and the standard deviation is very small, taking a moderate value for the network structure heterogeneity is conducive to the outbreak of contact-limited social contagions. This work just provides a starting point to understand the effects of heterogeneous adoption thresholds on contact-limited social contagions, a deeper understanding of how contact-limited social contagions on real social networks are affected by heterogeneous adoption thresholds still requires further efforts to discover.
Acknowledgements
Project supported by the National Natural Science Foundation of China (Grant Nos. 62072412, 61902359,61672467, and 61672468), the Social Development Project of Zhejiang Provincial Public Technology Research (Grant No.2016C33168),Zhejiang Provincial Natural Science Foundation of China (Grant No. LQ19F030010), and the Opening Project of Shanghai Key Laboratory of Integrated Administration Technologies for Information Security (Grant No.AGK2018001).
猜你喜欢
杂志排行

Chinese Physics B的其它文章
- Ergodic stationary distribution of a stochastic rumor propagation model with general incidence function
- Most probable transition paths in eutrophicated lake ecosystem under Gaussian white noise and periodic force
- Local sum uncertainty relations for angular momentum operators of bipartite permutation symmetric systems
- Quantum algorithm for neighborhood preserving embedding
- Vortex chains induced by anisotropic spin–orbit coupling and magnetic field in spin-2 Bose–Einstein condensates
- Short-wave infrared continuous-variable quantum key distribution over satellite-to-submarine channels