Effect of Carbonation and Drying-Wetting Cycles on Chloride Diffusion Behavior of Coral Aggregate Seawater Concrete
2022-02-28DABoLIYipengYUHongfaMAHaiyanCHENHaoyuDOUXuemeiandWUZhangyu
DA Bo ,LI Yipeng ,YU Hongfa ,MA Haiyan,CHEN Haoyu,DOU Xuemeiand WU Zhangyu
1) College of Harbour, Coastal and Offshore Engineering, Hohai University,Nanjing 210098,China
2) Department of Civil and Airport Engineering, Nanjing University of Aeronautics and Astronautics, Nanjing 210016,China
3) Key Laboratory of Coastal Disaster and Defence of Ministry of Education, Hohai University,Nanjing 210098,China
4) Nantong Institute of Marine and Offshore Engineering,Hohai University,Nantong 226300,China
5) CCCC Infrastructure Maintenance Group Company Limited, Beijing 100010,China
Abstract Based on seawater immersion,drying-wetting cycles,carbonation and drying-wetting cycles for coral aggregate seawater concrete (CASC) with different strength grades,the effect of carbonation and drying-wetting cycles on chloride diffusion behavior of CASC is studied.The results show that the free surface chloride concentration (Cs),free chloride diffusion coefficient (Df)and time-dependent index (m) of CASC in the drying-wetting cycles is obviously higher than that in seawater immersion.The Df and m of CASC of carbonation and drying-wetting cycles is higher than that in the drying-wetting cycles.Carbonation increases the Df and m of CASC,which is against CASC to resist chloride corrosion.The corrosion possibility of CASC structures in different exposed areas is as follows:splash zone (carbonation and drying-wetting cycles) >tidal zone (drying-wetting cycles) >underwater zone(seawater immersion).Besides,the chloride diffusion rate of C65-CASC is 17.8%– 63.4% higher than that of C65-ordinary aggregate concrete (OAC) in seawater immersion (underwater zone).Therefore,anti-corrosion measures should be adopted to improve the service life of CASC structure in the oceanic environment.
Key words coral aggregate seawater concrete;chloride diffusion;seawater immersion;drying-wetting cycles;carbonation and drying-wetting cycles
1 Introduction
Islands in the South China Sea are far away from the mainland,and there are no sandstones and freshwater.The application of coral aggregate seawater concrete(CASC) using coral,coral sand and seawater as primary raw materials is of great significance for the ocean engineering (Yuet al.,2017;Yanget al.,2018;Lyuet al.,2019;Maet al.,2019,2020).However,chloride corrosion,drying-wetting cycles and carbonation will significantly affect the concrete durability in the oceanic environment (Chenet al.,2008;Daet al.,2018;Liuet al.,2018;Wuet al.,2020).Therefore,studies on chloride diffusion behavior of CASC in the carbonation and drying-wetting cycles is of great importance on civil engineering.
Daet al.(2016a,2020) find that coral aggregates are a kind of naturally porous structural materials.CASC has chloride diffusion characteristics of high initial free chloride concentration (C0),high free surface chloride concentration (Cs) and high apparent chloride diffusion coefficients (Da),and itsC0(0.11%– 0.21%) is much higher than the chloride threshold concentration (Ccr) of common steel (about 0.05%),which leads to extremely severe corrosion,affecting the safety and durability of CASC structures.Realet al.(2018) studied on chloride diffusion behavior of lightweight aggregate concrete (LAC),and find that the chloride penetration at a certain depth were higher in LAC with lightweight aggregates of higher porosity.Bogaset al.(2019) found that when the same strength grade,the LAC can have similar better carbonation resistance performance than ordinary aggregate concrete (OAC) in the laboratory or oceanic environments.In the research of chloride diffusion behavior of OAC,Meijerset al.(2005) found that in the drying-wetting cycles,corrosion products continuously are produced in OAC,which leads to its destruction.Besides,the degradation rate of OAC in the drying-wetting cycles is much faster than that in seawater immersion.Yuet al.(2019) found that in the drying process,chloride salt enters the concrete due to the evaporation of H2O,resulting in crystallization pressure,destroys the crystallization zone of concrete.Therefore,the drying-wetting cycles accelerate the speed of chloride penetrating OAC.Jinet al.(2007) found that carbonation can increase the chloride concentration in OAC.The free chloride diffusion coefficient (Df) increase,and the growth rate ofDfincreases with the extension of exposure time (t).Zhanget al.(2011,2017) study on chloride diffusion properties in low-density (LD) and high-density (HD) calcium-silicate-hydrate,and a numerical method of directly achieving diffusivities is proposed.At present,researches on chloride diffusion behavior of concrete mainly focus on OAC and LAC.Therefore,for the highly porous characteristics of CASC and the real oceanic environment characteristics,this paper studies how carbonation and drying-wetting cycles influence chloride diffusion of CASC.
With the method of natural diffusion,the free chloride concentration (Cf),total chloride concentration (Ct) of CASC in seawater immersion,drying-wetting cycles and carbonation and drying-wetting cycles are systematically tested.The rule of chloride concentration is worked out.The chloride binding capacity (R),Cs,Dfand time-dependent index (m) of CASC with different strength are studied,compared with the durability parameters of OAC.The rule of chloride diffusion of CASC in the carbonation and drying-wetting cycles is summarized,which provides theoretical basis for the application of CASC in the ocean engineering.
2 Experiments
2.1 Raw Materials
The coral sands are from an island in the South China Sea,chloride concentration is 0.112%,apparent density is 2500 kg m-3,bulk density is 1115 kg m-3,porosity is 45.0% and fineness modulus is 2.9.The coral (Daet al.,2016b) is also from an island in the South China Sea,chloride concentration is 0.074%,apparent density is 2300 kg m-3,bulk density is 1000 kg m-3,porosity is 58.5%,cylinder compressive strength is 3.8 MPa,and the cylinder compress strength is tested according to Lightweight aggregates and its test methods Part 1:Test methods for lightweight aggregates (GB/T 17431.2-2010).Ordinary Portland cement P·II 52.5,Class I fly ash (FA),S95 grinding slag (SG) and JM-B naphthalene waterreducer are chosen.Seawater is prepared according to ASTM D1141-2003,in which the mass ratio of NaCl:Na2SO4:MgCl2·6H2O:KCl:CaCl2=24.5:4.1:11.1:0.7:1.2 Yuet al.(2019).
2.2 Experiment Scheme
Table 1 shows the mix proportion of CASC.Among them,W/B is the water-binder ratio.The test method according to Standard for test methods of long-term performance and durability of ordinary concrete (GB/T 50082-2009).The size of the sample is 100 mm × 100 mm× 100 mm,the curing age is 28 d,the curing temperature is(20 ± 3)℃,the relative humidity is (70 ± 10)%,and the CO2concentration is (20 ± 3)%.Variables include seawater immersion (P,simulates the underwater zone),drying-wetting cycles (PG,simulates the tidal zone) and drying-wetting-carbonation cycles (PT,simulates the splash zone).The exposure time of P is 0,30,78 and 120 d respectively.The cycle times of PG and PT are 2,4,6,8,10,12 and 14 respectively,and one cycle lasts 6 d.The cycle system of PG is immersion (2 d) → drying (2 d) →air-drying (2 d).The cycle system of PT is immersion (2 d)→ drying (2 d) → carbonation (2 d).Fig.1 shows the schematic diagram of cycle system.

Fig.1 Schematic diagram of cycle system.

Table 1 Mix proportion of CASC
2.3 Tests and Analysis Method
2.3.1 Powder collection
Collect powder from CASC samples at differentt.Drilling depth is 0–5,5–10,10–15,15–20,20–25,25–30,30–35,35–40,40–45 and 45–50 mm.Fig.2 is drilling locations of CASC powder.

Fig.2 Drilling locations of CASC powder.Note:1,2,3 and 4 in the figure are powder collection points.The minimum vertical distance between the collection points and the two sides is d1=d2=20 mm respectively.Drilling depth is h.
2.3.2 Chloride concentration and chloride binding capacity
According to Testing code of concrete for port and waterwog engineering (JTJ 270-1998),theCfandCtare tested by water-soluble and acid-soluble method respectively.Besides,according to theRdefined by Tanget al.(2008),and the relationship betweenCfandCtof concrete structures,Ris expressed as follows:

whereCtis the total chloride concentration (%);Cfis the free chloride concentration (%),whent=0 day,Cf=initial chloride concentration (C0);Cbis the binding chloride concentration (%);Ris the chloride binding capacity.TheRof concrete will not only reduceCs,but also reduceCf.WhenCfis lower thanCcr,steel bars will not rust.
2.3.3 Free surface chloride concentration and free chloride diffusion coefficient
TheCfat an average depth of 2.5,7.5,12.5,17.5,22.5,27.5,32.5,37.5,42.5 and 47.5 mm is measured,and theCsis obtained according to the chloride diffusion model(Yuet al.,2002;Daet al.,2016c).The three-dimensional chloride diffusion model of concrete as follows:

Therefore,the three-dimensional chloride diffusion homogeneous model of concrete is obtained as follows:

whereDais the apparent chloride diffusion coefficient;L1,L2andL3are the depths in the directions ofx,yandz,respectively.
According to Maageet al.(1996),theDfis expressed as follows:

TheDfreflects the chloride penetration rate of concrete.The higher theDfis,the faster the chloride concentration increases.
2.3.4 Time-dependent index of free chloridediffusion coefficient
Concrete hydration is a slow process.As the hydration goes on,the porous structure of concrete is gradually improved,and itsDfis slowly reduced.Thomaset al.(1999)found that the rule ofDfwithtis expressed as follows:

wheremis the time-dependent index ofDf;Ais a fitting parameter.
3 Results and Discussion
3.1 Seawater Immersion
3.1.1 Chloride concentration
Fig.3 shows the chloride concentration of CASC in seawater immersion.Among them,the concrete strength grade is C65,and thetis 0,30,78 and 120 d,respectively.It shows that theCfandCtof CASC increase with the extension oftand decrease gradually as the depth of diffusion grows,and tend to be stable at a certain depth.Besides,when the depth is 2.5 and 7.5 mm,Ctof C65P under 120 days’ exposure increases by 23.2% and 48.5%respectively compared with that under 30 days’ exposure.When the depth reaches 12.5 mm,the relative growth rate ofCfremains stable at 4.0%–10.4%.The main reasons are as follows:the chloride concentration increases gradually with the extension oft.However,as CASC hydrates,the internal pores structure of concrete is improved,which makes various ions silt up the pores of CASC,thus blocking the channel through which chloride diffuses,and then enhancing the capacity of against chloride diffusion.Therefore,with the extension oft,the growth rate of chloride concentration in CASC gradually slows down.

Fig.3 Chloride concentration of CASC in seawater immersion.C50P indicates that the concrete strength is C50 and the cycle system is seawater immersion (P).
3.1.2 Chloride binding capacity
According to the analysis,theRof C50P,C60P and C65P are 0.1967,0.2466 and 0.1486,respectively (C50P:y=1.1967x,r2=0.9068;C60P:y=1.2466x,r2=0.9385;C65P:y=1.1486x,r2=0.8732).Besides,the growth ofCfis linear with that ofCt,which is not related tot.The main reason is that the concrete absorbing chloride is a comprehensive process of physically and chemically.Thetonly affects value ofCfandCtbut does not affect absorption.Therefore,there is no need to take into account the effect oftin the study onRof CASC.
3.1.3 Free surface chloride concentration
3.1.3.1 Different exposure time
Table 2 shows theCsof CASC in seawater immersion.It indicates that theCsof CASC increases with the extension oft.The growth is faster at first and tends to be stable later.Under the samet,Csdecreases with the increase of concrete strength.In seawater immersion,the relationship betweenCsandtaccords with the (1-m)power exponent (Table 2).Besides,when exposed for 30,78 and 120 d,theCsof C65P decreases by 23.2%,20.7%and 26.1%,respectively,compared with that of C50P.The main reasons are as follows:for high strength CASC,with the extension oft,its compactness gradually increases due to the continuous hydration,and the internal micro-pore structure improves continuously,blocking the channel through which chloride diffuses,and enhancing the capacity of against chloride diffusion.Therefore,the growth rate ofCsgradually slows down.
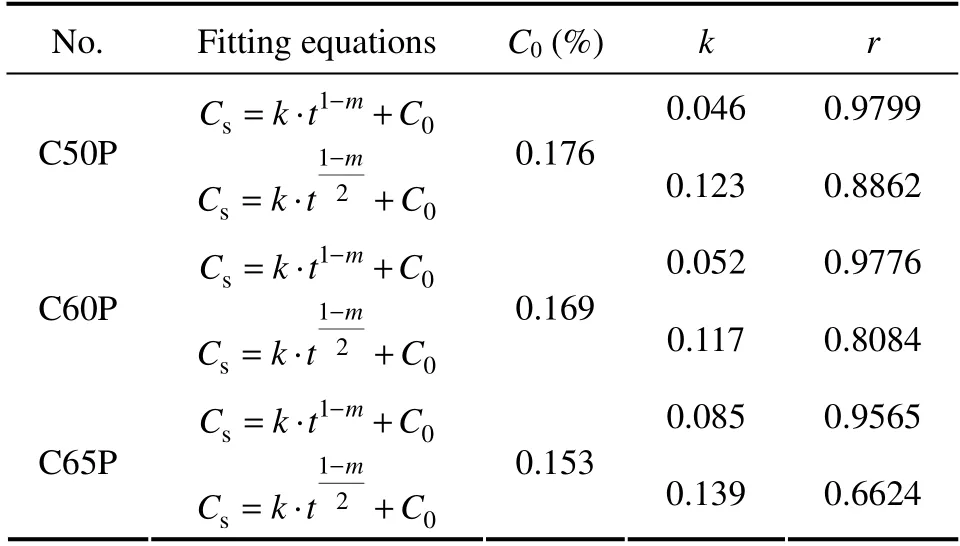
Table 2 Relationship between Cs and t of CASC in seawater immersion
3.1.3.2 Different concrete type
Fig.4 shows theCsof CASC and OAC in seawater immersion.It indicates that when exposed for 30,78 and 120 d,theCsof C60P-CASC increases by 31.3%,59.7%and 14.5% respectively compared with that of C60POAC.The main reasons are as follows:CASC is lightweight aggregate concrete (LAC) with large porosity and strong absorbency (Fig.5) (Chenget al.,2017;Wanget al.,2020).Its porous structure becomes the channel through which chloride diffuses.Besides,CASC is mixed with seawater,which contains a lot of chlorine salts,the initial free chloride concentration (C0) of CASC reaches 0.11%–0.21% (Liuet al.,2019;Wanget al.,2019),resulting in a higherCs.

Fig.4 Cs of CASC and OAC in seawater immersion.
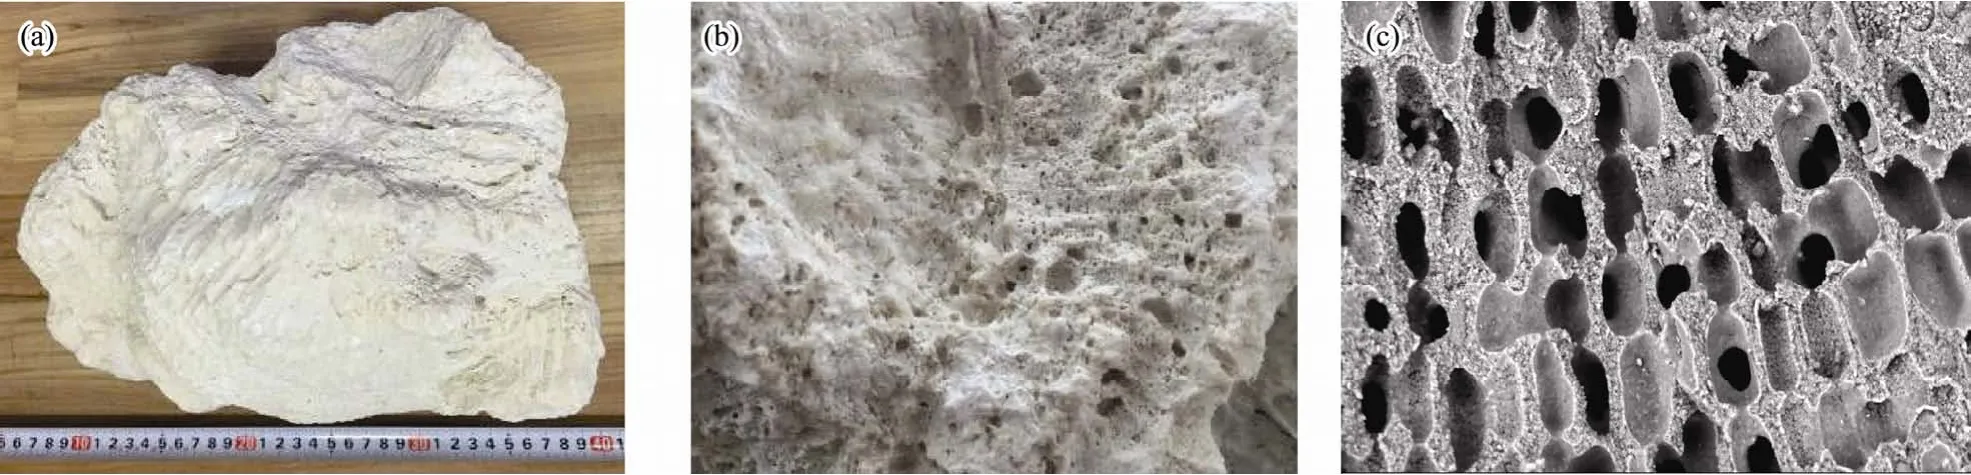
Fig.5 Porous structure of CASC.(a),coral-1;(b),coral-2;(c),coral-3.
3.1.4 Free chloride diffusion coefficient
3.1.4.1 Different exposure time
It is known by analysis theDfof CASC decreases power exponentially with the extension of exposure time(t)in seawater immersion (C50P:Df=9E-11t-0.544,r2=0.9406;C60P:Df=9E-11t-0.622,r2=0.9495;C65P:Df=2E-10t-0.766,r2=0.8361),and theDfof CASC decreases gradually with the increase of concrete strength.When exposed for 78 and 120 d,theDfof C65P decreases by 31.49% and 68.84%,respectively,compared with that under 30 days’ exposure.The main reason is as follows:FA and SG are added to CASC.In the early stage,the hydration of cement,FA and SG in CASC are not sufficient,so the filling and pozzolanic effects of FA and SG cannot be fully exerted,which increases theDf.However,with the extension oft,the C-S-H gel gradually forms in the capillary interstice due to pozzolanic effect,which lowers the porosity and pores size of CASC.Thus,theDfis decreasing and the capacity of against chloride diffusion of CASC is enhancing.
3.1.4.2 Different concrete type
Fig.6 shows theDfof CASC and OAC in seawater immersion.The results show that theDfof CASC and OAC decreases gradually with the extension oft,and theDfof CASC is much higher than that of OAC at the samet.When exposed for 30,78 and 120 d,theDfof C65PCASC is 28%,63.4% and 17.8% higher than that of C65P-OAC respectively.Themof C60P-OAC (0.940)and C65P-OAC (0.980) is higher than that of C60PCASC (0.618) and C65P-CASC (0.767),indicating that the decline rate ofDfof OAC is faster than that of CASC.This is mainly due to the porous structure of coral aggregate,which makes it easier for chloride in seawater or sea wind to enter CASC.

Fig.6 Df of CASC and OAC in seawater immersion.
3.2 Drying-Wetting Cycles
3.2.1 Chloride concentration
3.2.1.1 Different cycle times
Fig.7 shows the chloride concentration of CASC in the drying-wetting cycles.Among them,the concrete strength grade is C65,and the cycle times is 2,4,6,8,10,12 and 14,respectively.It indicates that:at the same diffusion depth,theCfandCtof CASC increase with the increase of cycle times.Besides,when the diffusion depth is 7.5 mm,theCfof C65PG increases by 25%,31%,77%,71%,50% and 66% respectively at 4th,6th,8th,10th,12th and 14th cycles compared with that at 2nd cycles.When the diffusion depth is 37.5 mm,theCfof C65PG increases by 0.7%,4.5%,22.8%,32.0% and 22.0%,respectively,at 6th,8th,10th,12th and 14th cycles compared with that at 2nd cycles.The main reason is that when the concrete is water-saturated,chloride begins to permeate into the concrete because of diffusion.When the external environment is dry,the H2O in the concrete evaporates outward gradually.The whole process is accompanied by water draining outward and chloride diffusing inward.At a certain depth of concrete,the chloride concentration will increase,and the concentration difference of chloride will increase.After many cycles,the chloride concentration reaches its peak in a certain depth.From this peak inward,chloride mainly is transferred by diffusion.From this peak outward,chloride is mainly transferred by capillary absorption and moisture evaporation.With the increase of cycle times,the peak point of chloride concentration tends to move to the interior of concrete.The chloride accumulation and transmission rate mainly depend on the drying-wetting cycle times.Therefore,the more the cycles,the faster the peak point of chloride concentration moves inward.

Fig.7 Chloride concentration of CASC in the drying-wetting cycles.(a),Cf;(b),Ct.
3.2.1.2 Different cycle system
Fig.8 shows the chloride concentration of CASC in seawater immersion and drying-wetting cycles.Among then,the concrete strength grade is C50,and thetis 120 days’.It indicates that there is little difference between theCfof C50P and that of C50PG at the concrete surface,while the difference ofCtbetween C50P and C50PG is 17.5% at the concrete surface.With the increase of diffusion depth,the difference ofCfbetween C50P and C50PG increases gradually.When the diffusion depth is 12.5,17.5 and 22.5 mm,theCf(Ct) of C50PG increases by 32%(48%),54% (52%) and 61% (50%),respectively,compared with that of C50P.When the diffusion depth reaches 27.5 mm,the difference ofCfbetween C50P and C50PG tends to be stable.The results show that the drying-wetting cycles can promote the chloride diffusion of CASC,and barely affect the surface of concrete,but it significantly influences the chloride concentration as the depth increases.
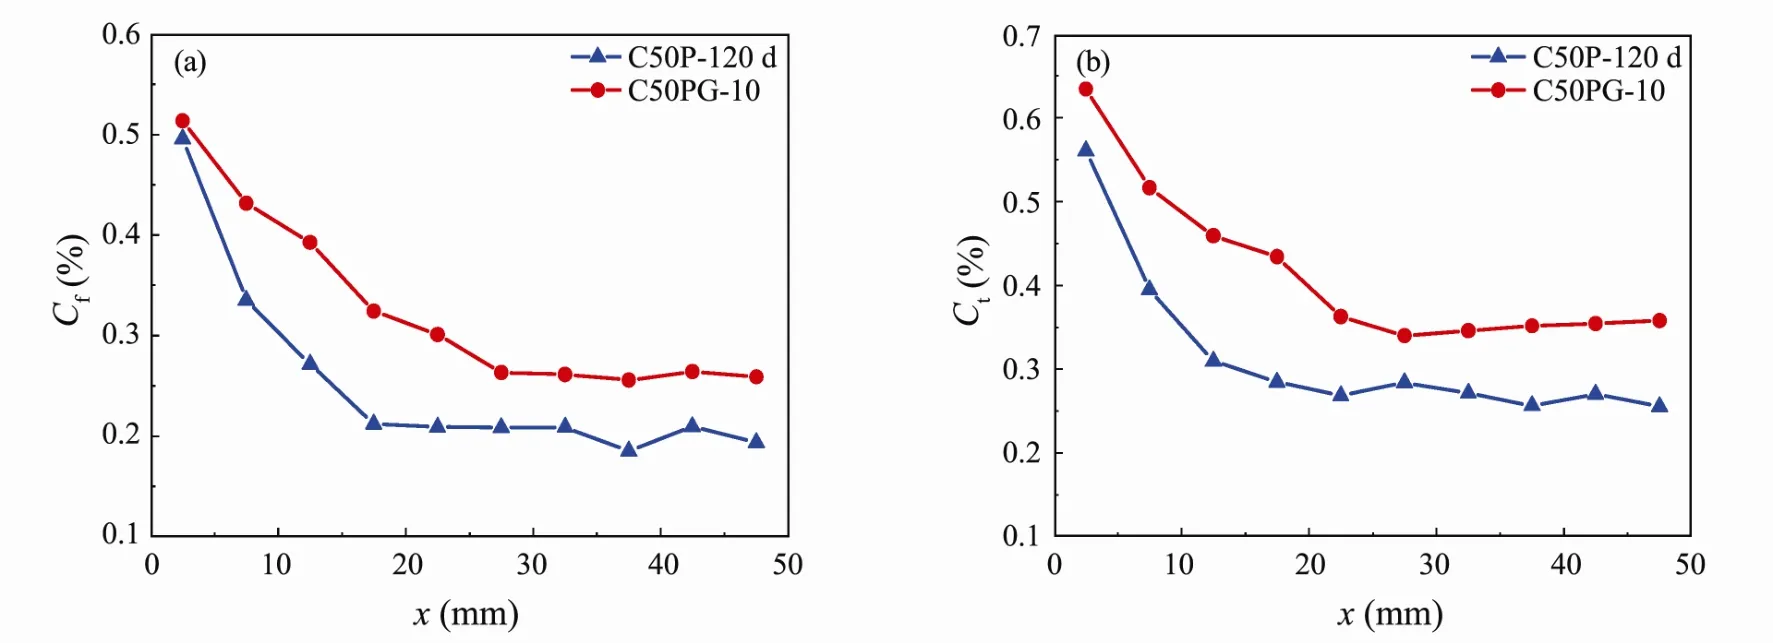
Fig.8 Chloride concentration of CASC in seawater immersion and drying-wetting cycles.(a),Cf;(b),Ct.
3.2.2 Chloride binding capacity
According to the analysis,there is a linear relationship betweenCfandCtof C50PG in the drying-wetting cycles(C50PG-2:y=1.4193x,r2=0.9063;C50PG-4:y=1.3679x,r2=0.9400;C50PG-6:y=1.3339x,r2=0.9281),which is consistent with seawater immersion.Besides,with the increase of drying-wetting cycle times,theRof CASC decreases gradually,and its durability decreases.
3.2.3 Free surface chloride concentration
3.2.3.1 Different cycle times
Table 3 shows theCsof CASC in the drying-wetting cycles.The results show that theCsof CASC increases with the increase of cycle times,and the growth is faster at first and tends to be stable later.After 8th cycles,theCsof CASC almost reaches a steady state.In the drying-wetting cycles,the relationship betweenCsand cycle time accords with the (1-m) power exponent (Table 3).Be-sides,under the same cycle time,Csdecreases with the increase of CASC strength.When the cycle times is 4,8,12 and 14,theCsof C65PG decreases by 16.7%,13.2%,10.3% and 10.7%,respectively,compared with that of C50PG.The main reason is as follows:theCsof CASC mainly depends on the capillary adsorption (concrete surface) of chloride.Concrete absorbs seawater until it is saturated by capillary adsorption.If the external environment becomes dry,the H2O in the pores will move to the concrete surface,and evaporates through the capillary end.Because only H2O is evaporated,the chloride concentration in the concrete surface is increased,which is much higher than that of the concrete interior.Thus a concentration difference is formed,which drives the chloride in the concrete surface to diffuse to concrete interior.With the increase of concrete strength,the compactness of CASC gradually increases,which enhances the capacity of against chloride diffusion,and slows down the growth rate ofCs.

Table 3 Relationship between Cs and t of CASC in the drying-wetting cycles
3.2.3.2 Different cycle system
Fig.9 shows theCsof CASC in different cycle systems.The results show that when exposed for 30,78 and 120 days,theCsof C50PG increases by 8.0%,1.9% and 2.7%compared with that of C50P,theCsof C65PG increases by 16.3%,4.7% and 14.7% compared with that of C65P.That is to say,theCsof CASC in the drying-wetting cycles is higher than that in seawater immersion,indicating that it is easier for chloride to diffuse into CASC in the drying-wetting cycles than in seawater immersion.

Fig.9 Cs of CASC in seawater immersion and drying-wetting cycles.
3.2.4 Free chloride diffusion coefficient
3.2.4.1 Different cycle times
It is known by analysis theDfof CASC decreases power exponentially with the increase of cycle times (n)in seawater immersion and drying-wetting cycles (C50PG:Df=4E-11n-0.690,r2=0.9772;C60PG:Df=3E-11n-0.857,r2=0.8991;C65PG:Df=4E-11n-0.907,r2=0.9594),and theDfof CASC decreases gradually with the increase of concrete strength.TheDfof C50PG is 32%,25%,88%and 66% higher than that of C65PG at 4th,8th,12th and 14th cycles.The main reasons are as follows:as the hydration goes on,the C-S-H gel gradually forms in the capillary interstice,which reduces the porosity and the size of pores of CASC,thereby decreasing theDfof CASC.In addition,the higher the strength of CASC is,the denser the structure and the lower the porosity will be,thus reducing theDf.
3.2.4.2 Different cycle systems
Fig.10 shows theDfof CASC in seawater immersion and drying-wetting cycles.The results show that when exposed for 30,78 and 120 d,theDfof C50PG increases by 20.4%,20.5% and 33.4%,respectively,compared with that of C50P.The main reasons are as follows:in the drying-wetting cycles,the H2O in the pores on the CASC surface evaporates rapidly,leaving the salt to crystallize instantly and produce crystallization pressure,which causes the surface to crack.These micro-cracks form the channel for seawater to infiltrate into CASC.When CASC is immersed in seawater again,there is a great difference in chloride concentration between the surface and interior,which accelerates the speed of chloride permeation under capillary adsorption.Therefore,the dryingwetting cycles increase theDfof CASC and make it easier for chloride to enter CASC,which reduces its durability.

Fig.10 Df of CASC in the different cycle systems.
3.3 Drying-Wetting-Carbonation Cycles
3.3.1 Chloride concentration
3.3.1.1 Different cycle times
Fig.11 shows the chloride concentration of CASC in the carbonation and drying-wetting cycles.Among them,the cycle time is 2,4,6,8,10,12 and 14 respectively.It indicates that:at the same diffusion depth,theCfof CASC increases with the increase of cycle times.Besides,in the 14th cycle,the chloride concentration of C65PT tends to be steady when the diffusion depth is 11 mm,while the chloride concentration of C50PT is not stable when the diffusion depth is 19 mm.The main reason is that the water saturation of concrete has a significant influence on chloride diffusion,and its water saturation is not only related to the environment humidity,but also related to the compactness of concrete.When CASC changes from saturation to unsaturation,moisture in CASC of high strength penetrates slowly because of its high compactness.However,moisture in CASC of low strength evaporates quickly because of its weak compactness.Before CASC is immersed next time,the transfer of chloride will be hindered by diffusion and capillary absorption,therefore,the transfer will be accelerated,increasing the chloride concentration in CASC.Thus,increasing the strength of CASC can significantly enhance the capacity of against chloride diffusion.

Fig.11 Chloride concentration of CASC in the carbonation and drying-wetting cycles.(a),C50PT;(b),C65PT.
Fig.12 is the surface state of CASC in the carbonation and drying-wetting cycles.It shows that after 14th cycles,the surface state of CASC does not change obviously,and there is no obvious damage on the surface.In addition,Fig.12(c) shows that the carbonation depth of CASC is measured by phenolphthalein reagent.It shows that only C50 is carbonized but C65 is not.After 14th cycles,the carbonation depth of C50 CASC reaches 6.12 mm.

Fig.12 Surface state of CASC in the carbonation and drying-wetting cycles.(a),C50PT-14;(b),C65PT-14;(c),carbonation depth.
3.3.1.2 Different cycle systems
Fig.13 shows the chloride concentration of CASC in the different cycle systems.It indicates that for CASC of high strength (C65P) in seawater immersion,the distribution curve of chloride concentration is relatively smooth,without apparent fluctuation,and monotonous decline.As the strength of CASC decreases,carbonation increases the chloride concentration of CASC,and there obviously exists the ‘intersection point’ in the distribution curve of chloride concentration of CASC in seawater immersion,carbonation and drying-wetting cycles.The Fig.13(a) shows that:When the diffusion depth <6 mm,theCfof CASC is higher in seawater immersion.When the diffusion depth >6 mm,theCfof CASC is higher in the carbonation and drying-wetting cycles.Therefore,carbonation will suppress first and then accelerate the chloride concentration of CASC,indicating that carbonation accelerates the increase ofCf,which is against CASC to resist chloride corrosion.

Fig.13 Chloride concentration of CASC in the different cycle systems:(a),C50;(b),C65.
3.3.2 Chloride binding capacity
According to the analysis,there is a linear relationship betweenCfandCtof C50PT in the carbonation and drying-wetting cycles (C50PT-2:y=1.2998x,r2=0.8005;C50PT-4:y=1.2520x,r2=0.9590;C50PT-6:y=1.2179x,r2=0.9665).Besides,as the number of cycles increase,theRof CASC decreases gradually,and its durability weakens.
3.3.3 Free surface chloride concentration
3.3.3.1 Different cycle times
Table 4 shows theCsof CASC in the carbonation and drying-wetting cycles.It indicates that theCsof CASC increases with the increase of cycle times.The growth is faster at first and slows down and tends to be stable later.In the carbonation and drying-wetting cycles,the relationship betweenCsand cycle time accords with the (1-m)power exponent (Table 4).Besides,under the same cycle time,Csdecreases with the increase of CASC strength.The main reason is that the conversion of Ca(OH)2to CaCO3during carbonation enhances the compactness of concrete,which means that carbonation hinders the chloride diffusion.Meanwhile,the number of capillary holes in concrete increases,accelerating the chloride diffusion in concrete,which indicates that carbonation either can promote or hinder the chloride diffusion in concrete.However,theCsof CASC increases with the extension of carbonation time,and carbonation promotes the chloride diffusion of CASC.

Table 4 Relationship between Cs and t of CASC in the carbonation and drying-wetting cycles
3.3.3.2 Different cycle systems
Fig.14 shows theCsof CASC in the different cycle systems.The results show that when exposed for 30,78 and 120 d,theCsof C50PT decreases by 8.9%,29.9% and 20.7% respectively compared with that of C50P,and theCsof C65PT decreases by 0.5%,15.3% and 1.3%respectively compared with that of C65P.That is to say,theCsof CASC in the carbonation and drying-wetting cycles is lower than that in seawater immersion.The main reasons are as follows:The longer time CASC is exposed to seawater,the more easily the chloride will penetrate,thus accelerating the growth rate ofCs.

Fig.14 Cs of CASC in the different cycle system.
3.3.4 Free chloride diffusion coefficient
3.3.4.1 Different cycle times
It indicates that theDfof CASC decreases power exponentially with the increase of cycle times (n) in the carbonation and drying-wetting cycles (C50PT:Df=6E-11n-0.767,r2=0.9256;C60PT:Df=5E-11n-0.825,r2=0.9777;C65PT:Df=4E-11n-0.842,r2=0.9492),and theDfof CASC decreases gradually with the increase of concrete strength.The main reasons are as follows:carbonation results in the micro-structures redistribution of CASC and enlarges the size of micro-pores.Therefore,carbonation speeds up the chloride diffusion and increases theDfof CASC.
Besides,with the increase of CASC strength,itsmincreases gradually.The main reason is that with the extension of carbonation time,more Ca(OH)2is involved in the chemical reaction to produce CaCO3in concrete,which further enlarges the micro-pores size of CASC.However,the secondary hydration of FA can refine the porous structure of CASC and improve its impermeability.At the same time,the secondary hydration of FA needs to consume some Ca(OH)2.Therefore,when more Ca(OH)2is converted into CaCO3in CASC,it will affect the secondary hydration of FA and the refinement of the porous structure,and slow down the decay rate ofDf.
3.3.4.2 Different cycle systems
Fig.15 shows theDfof CASC in the drying-wetting cycles,carbonation and drying-wetting cycles.The results show that when cycled for 4th,8th,12th and 14th times,theDfof C50PT increases by 41.0%,64.2%,18.9% and 1.5%,respectively,compared with that of C50PG,and theDfof C65PT increases by 31.7%,19.1%,33.2% and 19.3%,respectively,compared with that of C65PG,indicating that carbonation can significantly increase theDfof CASC.

Fig.15 Df of CASC in the drying-wetting cycles,carbon ation and drying-wetting cycles.
4 Conclusions
TheCfandCtof CASC decrease gradually as chloride diffuses is deeper.When the depth reaches 12.5 mm,the relative growth rate ofCfremains stable at 4.0%– 10.4%,and there is a linear relationship betweenCfandCt.Drying-wetting cycles can accelerate the chloride diffusion of CASC and has little effect on the concrete surface,but it significantly influences the chloride concentration as the depth increases.Carbonation accelerates the increase ofCf,which is against CASC to resist chloride diffusion.
TheCsof CASC increases exponentially with the extension oft.The growth rate ofCsof CASC is lower than that of OAC.TheDfof CASC decreases power exponentially with the extension oft.TheCs,Dfof CASC decreases gradually with the increase of concrete strength.
TheCs,Dfandmof CASC in the drying-wetting cycles are obviously higher than that in seawater immersion.TheDfandmof CASC of carbonation and drying-wetting cycles are higher than that in the drying-wetting cycles.It indicates that carbonation and drying-wetting cycles accelerates the chloride diffusion rate but decreases the maximum of chloride concentration.Carbonation increases theDfandmof CASC.
For the ocean engineering,the corrosion degree of CASC structures in different exposed areas is splash zone(carbonation and drying-wetting cycles) >tidal zone (drying-wetting cycles) >underwater zone (seawater immersion).In addition,the chloride diffusion rate of C65-CASC is 17.8%– 63.4% higher than that of C65-OAC in seawater immersion (underwater zone).Therefore,anticorrosion measures should be adopted to improve the service life of CASC structure in the oceanic environment.
Acknowledgements
The authors gratefully acknowledge the financial supports from the National Natural Science Foundation of China (Nos.11832013 and 51878350),the Fundamental Research Funds for the Central Universities (No.B2102 02023),the Young Scientific and Technological Talents to Support Project of Jiangsu Association for Science and Technology (No.027),the Water Conservancy Science and Technology Project of Jiangsu Province (No.2020 017),the Postdoctoral Research Funding Program of Jiangsu Province (No.2021K133B),the Ningbo Science and Technology Innovation Project (No.2020Z040),the Nantong Science and Technology Plan Project (No.JC 2020120),the Open Research Fund of Changjiang River Research Institute of Changjiang Water Resources Committee (No.CKWV2021879/KY).
杂志排行

Journal of Ocean University of China的其它文章
- Numerical Simulation and Analysis of Storm Surges Under Different Extreme Weather Event and Typhoon Experiments in the South Yellow Sea
- Analysis of Wave Distributions Using the WAVEWATCH-III Model in the Arctic Ocean
- Multi-Objective Weather Routing Algorithm for Ships Based on Hybrid Particle Swarm Optimization
- Experimental Study on the Influencing Factors of Motion Responses on an Air-Floating Caisson with Multiple Compartments
- Placement Optimization Method of FPSO Gas Detectors Based on Leakage Risk
- Effect of Temperature on the Acoustic Reflection Characteristics of Seafloor Surface Sediments