Placement Optimization Method of FPSO Gas Detectors Based on Leakage Risk
2022-02-28KANGJichuanSUNChongwenJINPengYANFasuoandSUNLiping
KANG Jichuan ,SUN Chongwen ,JIN Peng ,YAN Fasuo ,and SUN Liping
1) College of Shipbuilding Engineering,Harbin Engineering University,Harbin 150001,China
2) Xuzhou Construction Machinery Group,Xuzhou 221000,China
3) International Joint Laboratory of Naval Architecture and Offshore Technology,Harbin 150001,China
Abstract As the first step of the fire/gas-detection systems of floating production storage and offloading (FPSO) units is to identify leakage accidents,gas detectors play an important role in controlling the leakage risk.To improve the leakage scenario detection rate and reduce the cumulative risk value,this paper presents an optimization method of the gas detector placement.The probability density distribution and cumulative probability density distribution of the leakage source variables and environmental variables were calculated based on the Offshore Reliability Data and the statistical data of the relevant leakage variables.A potential leakage scenario set was constructed using Latin hypercube sampling.The typical FPSO leakage scenarios were analyzed through computational fluid dynamics (CFD),and the impacts of different parameters on the leakage were addressed.A series of detectors was deployed according to the simulation results.The minimization of the product of effective detection time and gas leakage volume was the risk optimization objective,and the location and number of detectors were taken as decision variables.A greedy extraction heuristic algorithm was used to solve the optimization problem.The results show that the optimized placement had a better monitoring effect on the leakage scenario.
Key words FPSO;leakage risk;detector layout optimization;Latin hypercube sampling
1 Introduction
A gas detector is an important part of fire/gas-detection systems and plays a vital role in detecting and controlling gas leakage in floating production storage and offloading(FPSO) units.The deployment of gas detectors in high-risk regions can help realize the quick detection of leakage accidents,so that effective risk-control measures such as separation and ventilation can be promptly adopted.According to the statistics of the Health and Safety Executive(HSE),of all the gas leakage accidents between 1992 and 2014,less than 60 percent were detected by a gas detector,and the remainder were found by inspectors (UK HSE,2016).
The quantitative study of the gas detector deployment plan in the onshore industry is much more mature than that in the offshore industry.Auxiliary methods such as risk analysis and computational fluid dynamics (CFD) are also applied in the evaluation of leakage accident results and the study of optimum detector deployment.Gas concentration under complex environments from CFD simulation acts as an important reference in optimizing detector deployment.Defriendet al.(2008) calculated the detector intervals by calculating the flammable gas volume permitted by risk regulation.Lee and Kulesz (2008) quantitatively measured risk in terms of the population under standard exposure risk levels and built dynamic models considering weather conditions to deploy gas sensors.Mariottiet al.(2014) proposed a strategy for the optimum deployment of gas detectors based on the maximization of the projection coverage rate.Vazquezromanet al.(2016)simulated leakage gas diffusion under different conditionsviaCFD to optimize detector deployment.Wanget al.(2015)performed gas diffusion simulations using Process Hazard Analysis Software Tool and imported hazardous gas distribution data into neural networks as input and samples.They achieved the fast prediction of the leakage data;however,this method ignores that the orographic effect is not applicable to equipment-dense infrastructures such as the FPSO unit.
Recently,stochastic programming has been proved to be a powerful tool for detector deployment optimization.For the leakage detection of petrochemical production units,Legget al.(2012) studied different placement strategies considering different locations and environmental factors.Legget al.(2013) optimized the gas detector layout,considering the condition value-at-risk.Benavides-Serranoet al.(2014a,2014b,2015) optimized the gas detector layout of petrochemical units.The authors introduced a voting logic optimization model considering equipment unavailability,to reduce the influence of false positives on the detection time,and proposed a comprehensive evaluation by comparing four existing schemes.Radet al.(2017,2018) combined gas diffusion analysis with scenario risk analysis to solve the layout scheme with minimum risk.Cenet al.(2017) obtained the leakage scenario set through scenario probability screening and took the volume of hazardous gas as one of the risk criteria.Zhanget al.(2019) presented a method to build a complete accident scenario set,considering the possibility of accidents of various degrees.Zhouet al.(2019) optimized the layout of a drilling platform based on the method of complete accident scenario set and particle swarm optimization.
The selection of leakage scenarios is important to evaluate the optimal arrangement of detectors.However,in many studies,some problems are still encountered in the selection of leakage scenarios:For example,only the worstcase assessment is considered,the possibility of each accident is not considered,or a large number of leakage scenarios need to be simulated to meet the representativeness of leakage scenarios.In the random planning of detector arrangement,it is important to obtain the leakage scenario which satisfies the requirements of probability and representativeness using a rapid and effective method;however,developing such as method is difficult.To quickly develop a leakage scenario method to solve the representativeness problem,a sampling method is introduced into the riskrelated problems,and this approach has been proved effective.
The layout of detectors on offshore structures is mostly based on standards and regulations,which lack detailed quantitative indications.As the useable space is quite limited,offshore structures are always compact in design.Such arrangement makes the structures easily prone to domino effect while leakage occurs,and the consequences are much severer.The detector-deployment methods based on standards and regulations are unsatisfactory for present detection requirements.Quantitative methods,which are rarely applied for detection in offshore structures (Paiket al.,2011),are necessary and important but not straightforward.As the structural features of offshore and onshore facilities are quite different,in the current study,the quantitative methods are expanded and refined to adapt them to offshore applications.We used Latin hypercube sampling (Seoet al.,2013) to obtain the parameters of each variable in the leakage scenario.Through this method,the leakage scenario could be rapidly obtained,and the leakage scenario sampled was very representative.The detection time and risk consequence of each leakage scenario were obtainedviaCFD analysis.The risk target model was established based on stochastic programming,and the optimization model was quickly solved using a greedy heuristic algorithm.The remainder of this paper is organized as follows:Section 2 describes the leakage risk assessment of the crude oil process system.Section 3 presents the development and application of a sensor optimization algorithm.Section 4 presents the result analysis.Section 5 presents the conclusions.
2 Leakage Risk Assessment of Crude Oil Process System
2.1 System Description
This paper focuses on the crude oil processing system,a major assembly of the FPSO topside.The main devices are listed in Table 1.
The hazardous substances in the FPSO crude oil-treatment system are crude oil,natural gas,and chemical agents.The natural gas in the system is dissolved in crude oil,and the main component of the gas is methane.Table 2 presents the hazardous characteristics of natural gas.

Table 1 Equipment of crude oil processing system

Table 2 Hazardous characteristics of natural gas
The production area of FPSO is narrow,and the topside production system components are numerous.Several factors need to be addressed in the selection and layout of corresponding detectors.The leakage characteristics of combustible gas,production equipment size,and wind speed and direction in the environmental wind field,detector type,and voting mechanism should be considered.
2.2 Probabilistic Analysis of Leaking Scenario Variables
The leakage scenario consists of leak source variables and environmental variables.In this study,the leakage location,leakage direction,leakage rate,wind speed,and wind direction were analyzed.The randomness of the risk system was represented by the probability distribution of each variable.Subsequent sampling was performed based on the calculation of the probability density function of each variable to construct the accident scenario.
2.2.1 Probabilistic analysis of leakage source variables
1) Leakage location
Probability analysis was performed for leakage location on Offshore Oil 111 FPSO.First,in combination with the crude oil processing system equipment layout,the spatial configuration shown in Fig.1 was adopted,and the entire crude oil processing module was divided into 24 subsections.TheX-direction was divided into four sections,and theY-direction was divided into three sections.TheZdirection was divided into two sections,and then the device type and the number of devices in each subsection were counted.
Large equipment may span multiple subintervals.Thus,the proportion calculation was performed based on the volume occupied by each subsection.According to the crude oil processing equipment catalog table and related pipeline instrumentation diagrams mentioned above,the leakage equipment types selected in this study were heat exchangers,vessels,pumps,and valves.The valve was smaller than the other equipment types and is not shown in Fig.1.After the leakage frequency data were gathered from the Offshore Reliability Data database (where the data were split into small,medium,and large) were added,the leakage frequency of the four types of equipment could be achieved(Table 3) (DNV GL,2015).The subinterval leakage frequency was calculated according to the number of devices in each subinterval.Then,the leakage frequencies in theX-,Y-,andZ-directions were separately calculated.Finally,the probability density function in the three directions could be solved.Table 4 presents the leakage frequency of each subinterval.Table 5 presents the different coordinate ranges.

Fig.1 Schematic diagram of the spatial division of crude oil processing system.
By sorting and comparing the leakage frequencies of the 24 leakage subintervals,we can find that X1Y3Z1,X3Y2Z1,X3Y3Z1,X2Y2Z1,X2Y3Z1,and X1Y2Z1 are the six subintervals with higher leakage frequencies.According to the leakage frequency calculation table of different subintervals,the leakage probability of equipment in each subinterval was obtained (Table 6).
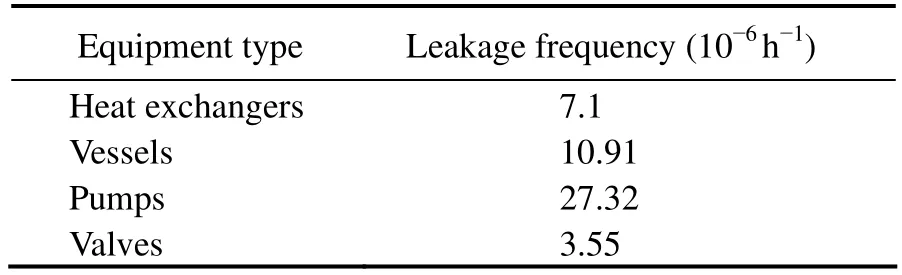
Table 3 Leakage frequency statistics of heat exchangers,vessels,pumps,and valves

Table 4 Calculation results of leakage frequency in different subintervals

Table 5 X,Y,Z coordinate ranges of the subinterval
To facilitate the calculation of the probability density distribution function and Latin hypercube sampling,different leak spaces such as 0– 1 corresponding to the subinterval X1Y2Z1 are numbered by interval,and the density and cumulative density of each interval are obtained.The leakage subinterval number is represented bys.Thecumulative probability density function and its inverse function are as follows:

2) Leakage rate
Table 7 presents the statistics of FPSO leakage accidents in a certain sea area in 2005 (Vinnem,2014).The leakage accident levels are classified according to the leakage rate.The directions of leakage source are listed in Table 8.

Table 6 Interval probability and cumulative probability in each subinterval

Table 7 Frequency statistics of leakage rate

Table 8 Directions of leakage source
When a large leak occurs in actual monitoring,in addition to the gas detectors,other devices such as pressure gauges and flow meters will also have corresponding alarms.Large leaks can be more easily monitored in actual projects.Gas detectors are arranged to generally target small leaks;thus,the upper limit of the leakage rate is 10 kg s-1,and the leakage rate is expressed inm.The probability density function of the leakage rate,the cumulative density function of the leakage rate,and the inverse function are derived as follows:

3) Leakage direction
Owing to the limitation of the CFD software simulation,it is assumed that the leakage equation establishes six directions of leakage source:± X ± Y ± Z,and that the probabilities in all directions are the same.
The leakage probability density function,cumulative density function,and inverse function in all directions were derived as follows:
2.2.2 Probability analysis of environmental wind field variables
1) Wind speed factor
Table 9 presents the statistical data of wind speed in various sections of West African waters (Seoet al.,2013).To facilitate the probability calculation,the maximum wind speed was selected as 15 m s-1.In this paper,the wind speed is denoted byv.The cumulative probability density function and the inverse function of wind speed are solved according to the statistical table.

According to statistical results,4– 6 m s-1is a common wind speed range,and 5 m s-1is taken as the common wind speed in this area.The average wind speed in this area is 6.5 m s-1.To comprehensively consider the law of leakage and diffusion under different wind speed levels,1.5,3.5,5,6.5,and 8 m s-1were taken as the representative values of wind speed variables.
2) Wind direction factor
The average wind speed of the environment where the FPSO unit is located is generally greater than the terrestrial wind field.Moreover,the FPSO unit has a wind vane effect.The FPSO hull direction changes with the wind and wave directions.Therefore,the forward direction,aft direction,and the left and right sides of the FPSO leakage problem are considered.It is assumed that the four directions have the same probability,as shown in Table 10.

Table 10 Probability values and intervals of wind directions
The wind direction probability density function,cumulative probability density function,and inverse function of the FPSO leakage wind field are as follows:

Thus far,the probability density functions of the five key variables of the FPSO leakage scenario (leak rate,leakage direction,leakage location,and wind speed and wind direction in wind field) have been solved.Furthermore,the leakage scenario was constructed based on the probability density function by sampling,and the procedure is later described in the paper;this construction can ensure that the leakage accident scenario conforms to the probability distribution.
3 Mathematical Model and Optimization Algorithm
1) Objective function
The objective function is the product of the detection time and the volume of leakage gas in each scenario.With the location and quantity of gas detectors as two decision variables,the mathematical model of cumulative risk value of leakage scenario set is established.
The objective function is as follows:
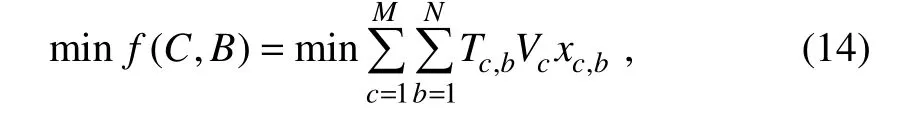
where,
CandB– optimization decision variable;
c– leakage scenario;
b– candidate monitoring point location;
M– number of leak scenarios;
N– number of gas detector candidates;
xc,b– For binary decision variables,if leakage scenariocis detected by detectorb,thenxc,b=1;if leakage scenariocis not observed by detectorb,thenxc,b=0;
Tc,b– In leakage scenarioc,the time required for monitoring point c to detect the leakage for the first time (the concentration of the detection point is greater than the corresponding time of the first-level alarm value),which is obtained by simulation;
Vc– Volume of leakage gas when leakage scenariocis stable (gas volume with concentration greater than 1.25%).
2) Constraint condition
Considering cost requirements,the number of detectors is always limited in the actual arrangement.Suppose that the number of detectors allowed in the actual arrangement isP;that is,thePvalue is the number of detectors.

whereybis a binary decision variable.When gas detectors are arranged at position b,theybvalue is set to 1;when no gas detectors are arranged at position b,theybvalue is set to 0.
Ensure that there is at most one detector arrangement for a single leak scenario;that is,only one detector is selected for a single leak scenario.

Owing to the uniqueness of detection arrangement,multiple leakage scenarios are observed by the same detector;therefore,only one detector can be arranged.

3) Solution method
The mathematical model established in this paper belongs to the P-median problem and nondeterministic polynomial problem.When the scale of the problem is very small,that is,the candidate points and the selection scenarios are small,the optimization results can be quickly obtained through enumeration.When thePcandidate value is equal to or greater than 2,the model can be rewritten as a mixed-integer programming problem.Nowadays,many heuristic algorithms are used to solve P-median problems,such as particle swarm optimization,genetic algorithm,and hybrid heuristic algorithms.Each algorithm has its computing characteristics.These algorithms are essentially based on vertex optimization.Among these methods,the green dropping heuristic algorithm (GDHA) has the characteristics of fast solution speed and convenience and thus is widely used.The GDHA solution idea is to solve the problem stepwise and solve the optimal value in each step.The decision in each step cannot be changed until the optimal solution is satisfied.The algorithm flow is as follows:
i) Set the currently selected detector arrangement numberj=N;that is,all candidate detectors are selected.
ii) Assign the number of scenario sets ofMtojcandidate placement positions in turn.In the whole allocation process,each leakage scenario corresponds to the fastest detection point of the scenario,and the detection time of each scenario and the leakage gas volume are multiplied to calculate the cumulative leakage risk value.
iii) Judge whetherjis equal to the numberPto allow placement,and if so,outputjprobe placement point positions and scenario allocation results.IfjandPare not equal,proceed to the next step.
iv) Select and take a layout point from thejcandidate positions as follows:The cumulative risk value of the corresponding leakage scenario before this point is lower than the cumulative risk values of the leakage scenarios of the rest points.
v) Remove the candidate point from the candidate placement position and makej=j-1;then return to step 2.The flow chart of the algorithm is shown in Fig.2.

Fig.2 Flow chart of the optimization algorithm.
4 Case Study
4.1 Latin Hypercube Sampling to Construct Leakage Scenarios
With Offshore Oil 111 as the subject,the risk assessment and potential leakage source identification of the FPSO upper module have been completed in Section 2.The current section describes the construction of the leakage accident scenario set.The crude oil processing system module was selected as the typical gas detector layout optimization area,and the detector type selected was a point-type infrared gas detector.During the construction of the leakage accident scenario set,the Latin hypercube sampling method was used to construct the accident set from the probability density function for further numerical simulation.Compared with Monte Carlo sampling,the Latin hypercube method can effectively sample samples with fewer sampling times to avoid the aggregation effect of samples.Moreover,compared with the traditional multidimensional stratified sampling,Latin hypercube sampling can more easily achieve sampling of various scales.
Latin hypercube sampling extracts m sample sets fromn-dimensional vector space.The steps are as follows:
1) Each one-dimensional vector is decomposed intomintervals,which are not overlapped,and each interval is guaranteed to have the same cumulative probability value of 1/m.
2) One point is randomly selected from each interval of each vector.
3) According to the points obtained in the second step,m sample sets are formed.
Five sample values of one-dimensional variables are taken for explanation.Before sampling,the cumulative probability density distribution is divided into five intervals.One sample is randomly selected from each interval to avoid the concentration of sample values,so that the samples can better reflect the sample distribution.
Furthermore,we used the probability median method to sample the variables in Latin hypercube,and the basic solution equation is as follows:
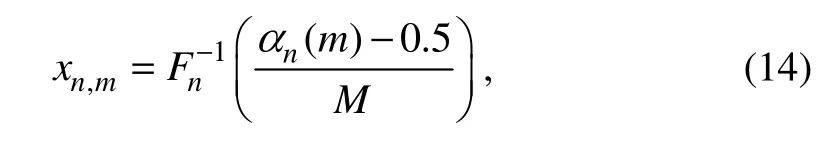
wherexn,mrepresents themth random sampling value of thenth variable obtained through sampling.Fn-1represents the inverse function of the cumulative probability function of thenth random variable.Mrepresents the number of samples required.αn(1)–αn(M) represents the number of random permutations from 1 toM.
The probability density function,cumulative probability density function,and inverse function of the leakage location,leakage rate,leakage direction,environmental wind direction,and environmental wind speed obtained above were used.To fully reflect the distribution of leakage points,30 groups of leakage sample data were determined from five-dimensional vector space through Latin hypercube sampling.Table 11 presents the results.

Table 11 Results of 30 groups of leakage scenarios
4.2 Candidate Layout and CFD Leakage Simulation Results
The detector layout parameters of a crude oil treatment system are not the same under different specifications,and different parameters have been adopted in different works.According to the combination of relevant research and standards (API,2017;ISA,2003,2010),the detector layout interval was 4 m × 4 m in the study of detector candidate positions.A total of 46 candidate positions are shown in Fig.3.Among them,the detector arrangement points of No.1– 40 were 0.5 m higher than the bottom leakage point and 1.5 m away from the production deck;the detector arrangement points of No.41– 46 were 0.5 m higher than the top leakage point and 6.5 m away from the production deck.

Fig.3 Location and number of gas detector candidates of crude oil processing module.
After the set of simulated leakage accident scenarios and the location of detectors were determined,STAR-CCM+was used to simulate each leakage accident scenario.According to the equipment layout,the whole crude oil processing module was determined as 30.62 m × 18.9 m × 11 m.The main equipment consisted of a high-pressure separator,low-pressure separator,electrostatic dehydrator,crude oil heat exchanger,crude oil heater,crude oil cooler,crude oil booster pump,and production water circulating pump.Since the precise modeling of the FPSO crude oil treatment system leads to the huge workload of CFD simulation,it is necessary to appropriately simplify the model.In this research,the main equipment geometry featureswere retained,and the small components such as valves and some pipelines were ignored.The setting of the grid solution domain will affect the accuracy of simulation results to some extent,and the influence of boundary conditions on simulation results should be eliminated or reduced.First,the equipment model of the crude oil processing module should be kept away from the boundary of the solution domain.Therefore,a large range of solution domains should be set in the grid division.After the leakage condition simulation in different sizes of solution domains,the final setting of the grid model solution domain in this study was 120 m × 80 m × 30 m.The quality of discrete grids in solution domain division also influences the calculation accuracy and efficiency.Poor grid quality even leads to simulation failure.In this study,the Trimmed Mesher and Surface Remesher were selected as the grid models in STAR-CCM+.The grid model had a faster rate of grid division and better calculation accuracy compared with tetrahedral grids under the same mesh number.The volume control encryption processing was conducted at the leakage point.After the grid trial calculation of different basic sizes,the verification of grid independence was completed,and the number of grids in the final division model was about 4.4 million.
In this research,each leakage scenario was simulated in turn,and the methane mole fraction and the leakage gas volume at each layout point of the leakage scenario were recorded,and the time for each detector to reach the first level alarm concentration in each scenario was analyzed.In terms of the leakage scenario,no candidate layout point was found,and the detection time was set to 60 s (much longer than the normal detection time).In practice,the detector needs a certain response time to detect the gas.The detection time in this study was the theoretical detection time,and the detector response time was not considered.The fastest detection times in the simulation results of each leakage scenario are presented in Table 12.The detection times and gas leakage volumes obtained from the simulation are shown in Table 12.A total of 30 scenarios were calculated.

Table 12 Detection time and volume of leakage scenario
Through CFD simulation analysis,25 out of the 30 leakage scenarios were found by the detector in time,and the effective detection rate was 83.3%.Leakage scenarios 2,6,7,15,and 20 were found by every detector.These scenarios were not detected because the leakage rate was relatively low,so that the leakage gas quickly diffused in the air;the effect of the leakage gas on the edge of the crude oil processing module is not within the scope of the crude oil processing module;the leakage direction is upward,and the leakage gas diffuses quickly.
4.3 Results Analysis
The cumulative risk values at differentPvalues are presented in Table 13.

Table 13 Relationship between the number of allowed installations P and the objective function value
The impacts of different allowable detector arrangement quantitiesPon the cumulative risk value were analyzed,and the number of detectors was 1– 12.With the increase in the number of detectors,the cumulative risk of leakage significantly reduced.When the number of allowed detectorsPwas 17,the cumulative risk value was the lowest,and the leakage detection rate was the highest.Based on the cumulative risk value with aPvalue of 1,the accumulated risk values corresponding to variousPvalues were normalized.When thePvalue was 12,the normalized cumulative risk value was 0.228.Afterward,each increase in the number of detectors will reduce the cumulative risk value by no more than 1%.Considering cost requirements,it is not appropriate to continue increasing the number of layouts;the number of recommended arrangements to be solved by the cumulative risk value is 12.Fig.4 shows the optimal location of detectors with the cumulative risk value as the objective function when thePvalue is 6,12,and 17.The red dots represent the candidate location of gas detectors,and the blue triangles are the actual location of the gas detector.

Fig.4 On-site layout plan of crude oil processing module and optimized layout plan considering cost and risk.
According to the FPSO equipment layout information and the detection layout scheme in the work by Hu and Tang (2017),the on-site gas detector layout of the crude oil processing module is shown in Fig.5a.After considering the risk and cost,the allowable number of detectors was determined as 12 (Fig.5b).In the optimized arrangement of 12 detectors,19 leakage scenarios could be detected,the effective detection rate was 63.3%,the cumulative risk value was 36693,and the fastest field leakage detection time was 0.5 s.In terms of the actual-site layout scheme calculation,14 leak scenarios could be detected,with an effective detection rate of 46.7%;the cumulative risk value was 97153.3,and the fastest leak scenario detection time was 1.25 s.The calculation results show that the optimal layout scheme with the allowable layout number of 12 was better than the site layout scheme in terms of the scenario detection rate,the fastest detection time,and the cumulative risk value.

Fig.5 On-site layout location and optimization plan layout.
The on-site gas detection arrangement of the crude oil processing module is shown in Fig.6a.A total of 6 gas detectors were arranged in this area.The optimization objective function was the cumulative risk value,and the layout with aPvalue of 6 is shown in Fig.6b.Calculation results are presented in Fig.7.As shown,14 leak scenarios could be monitored by the actual-site layout scheme.The effective detection percentage was 46.7%,the cumulative risk value was 97153.3,and the fastest leak scenario detection time was 1.25 s.Based on the cumulative risk value,the optimized layout scheme could detect 17 scenarios,the effective detection percentage was 56.7%,the cumulative risk value was 55707,and the minimum leak scenario detection time was 0.75 s.The calculation results show that the optimized layout scheme is superior to the existing layout scheme.The optimized layout scheme could detect some scenarios that could not be detected by the existing layout scheme,such as scenarios 4,5,22,24,26.The leakage scenarios that were detected in the field layout but not in the optimized layout plan were scenarios 9 and 30.

Fig.6 On-site layout and optimization plan layout.

Fig.7 Result comparison.
5 Conclusions
This paper introduces a method for optimizing gas detector placement.The leakage scenario set was constructed using the Latin hypercube sampling method based on probability density distribution,which has the advantages of fast sampling and avoidance of the aggregation effect of samples.The objective function of the risk optimization was the product of the detection time of the scenario and the leakage gas volume,combining the detection parameters of the detector with the risk consequences.According to the CFD simulation results,the optimization mathematical model was solved using a greedy extraction algorithm.
The proposed method was applied to optimize the gas detector installation design of an FPSO crude oil processing system.The influences of different detector installation quantities on the cumulative detection time and cumulative risk value were obtained.Considering the economic requirements and the cumulative risk value,the optimal number of detectors was 12.The leakage scenario detection rate of the optimized layout scheme was higher than that of the on-site layout scheme,the cumulative risk value of the optimized scheme was lower than that of the on-site layout scheme,and the fastest detection time of the optimized layout scheme was lower than that of the on-site layout scheme.The comparison results demonstrate the superiority and feasibility of the presented method.
Acknowledgements
The authors acknowledge the support of the Fundamental Research Funds for the Central Universities (No.3072 021CF0101),the ‘Integration Software of Offshore Floating Platform Engineering Design (No.2016YFC0302900)’from the Ministry of Science and Technology of China,and the Project of Development of Floating Offshore Wind Turbine Risk Assessment Software Project,funded by the International S &T Cooperation Program of China (No.2013DFE73060).
杂志排行

Journal of Ocean University of China的其它文章
- Numerical Simulation and Analysis of Storm Surges Under Different Extreme Weather Event and Typhoon Experiments in the South Yellow Sea
- Analysis of Wave Distributions Using the WAVEWATCH-III Model in the Arctic Ocean
- Multi-Objective Weather Routing Algorithm for Ships Based on Hybrid Particle Swarm Optimization
- Experimental Study on the Influencing Factors of Motion Responses on an Air-Floating Caisson with Multiple Compartments
- Effect of Temperature on the Acoustic Reflection Characteristics of Seafloor Surface Sediments
- Variations of the Eco-Hydro-Climatic Environment Response to the 2015/2016 Super El Niño Event in the Mindanao Dome Upwelling System