Generation of laser-driven flyer dominated by shock-induced shear bands: A molecular dynamics simulation study
2022-02-24DeshenGeng耿德珅DanyangLiu刘丹阳JianyingLu鲁建英ChaoChen陈超JunyingWu伍俊英ShuzhouLi李述周andLangChen陈朗
Deshen Geng(耿德珅), Danyang Liu(刘丹阳),,†, Jianying Lu(鲁建英), Chao Chen(陈超),Junying Wu(伍俊英), Shuzhou Li(李述周), and Lang Chen(陈朗)
1State Key Laboratory of Explosion Science and Technology,Beijing Institute of Technology,Beijing 100081,China
2School of Materials Science and Engineering,Nanyang Technological University,Singapore
High-power pulsed lasers provide an ingenious method for launching metal foils to generate high-speed flyers for high-pressure loading in material science or aerospace engineering.At high-temperature and high-pressure laser-induced conditions, the dynamic response of the metals and the mechanism of flyer formation remain unclear.In this study, the overall process of the laser-driven aluminum flyer,including laser ablation,rupture of metal foil,and the generation of the flyer was investigated by molecular dynamics combined with the two-temperature model.It was found that under high laser fluence(over 1.3 J/cm2 with 200-fs laser pulse duration),the laser induced a shock wave with a peak pressure higher than 25 GPa,which led to shear bands expanding from the edge of the laser ablation zone in the foil.Compared with the cases of low laser fluence less than 0.5 J/cm2,the shear band induced by high laser fluence promotes the rupture of the foil and results in a high-speed flyer(>1 km/s)with better flatness and integrity.In addition,the shock wavefront was found to be accompanied by aluminum crystal phase transformation from face-centered cubic(FCC)to body-centered cubic structure.The crystal structure reverts with the decrease of pressure,therefore the internal structure of the generated flyer is pure of FCC.The results of this study provide a better understanding of the laser-induced shock effect on the foil rupture and flyer quality and forward the development of the laser-driven flyer.
Keywords: laser-aluminum interaction,laser-induced shock wave,phase transition
1.Introduction
Applications of high-power-laser interactions with nanoor microstructures have attracted a lot of interest in manufacturing, aerospace, military, and materials science.Over the last four decades,the high-power laser has emerged as a powerful acceleration tool that can cut off a flyer from micronthick metal foils and drive it to high speeds of several km/s via the high-temperature and pressure plasma during laser ablation.[1]The laser-driven flyer(LDF)could exert a transient high-pressure onto a target,which has potential applications in micro-scale manufacture of materials,[2,3]controlled and safe ignition of explosives,[4,5]and hypervelocity collisions simulations of debris in aerospace.[6,7]
The flatness and integrity of the flyer are the key factors to produce a reliable and controlled shock loading by LDF.It is therefore important to study the flyer formation mechanism and reveal how to improve the quality of the flyer.By highspeed photography, the shape of the flyer could be obtained,which is usually crescent-shaped.[8,9]As the flyer forms and moves forward, the flatness of the flyer decreases.[10]In addition, through the measurements of flyer surface velocity by interferometers,[11,12]it was found that the acceleration of the flyer is not gentle, but with oscillation or even spallation, indicating a complex shock-and-release process during the generation of the flyer.[13]However,because of the strong optical disturbance caused by the plasma and the very short duration of LDF (within nanoseconds), the details in the flyer formation process, such as the rupture of the foil, are very difficult to be experimentally observed.For traditional theoretical methods, most hydrodynamic calculations are based on onedimensional (1D) models[14,15]or regard the flyer as a rigid body.[16—18]However, in these simplified models, the deformation or fracture of the metal foil cannot be simulated.
Molecular dynamics (MD) methods could simulate the dynamics response of the matter under extreme conditions at the atomic scale, which may help understand the flyer formation mechanism of LDF.In MD, semi-empirical potentials such as the embedded-atom method (EAM),[19,20]the Morse potential,[21]and the Lennard—Jones potential (LJ potential)[22]are used to describe interactions between metal atoms.By calculating the energy, atom velocity, and atom position at every timestep, the phase transition and deformation of the metal can be studied.[23—26]To describe the interaction between laser and matter, Anisimovet al.[27]proposed a two-temperature model(TTM),in which the laser energy absorption of the electrons and the energy transfer to phonons are considered by separately calculating the temperatures of electrons and the lattice in the metal.[28,29]By coupling MD with TTM, the laser ablation of metals can be studied.[30—36]From our previous study, the LDF process can also be simulated by TTM-MD.[37]However, as the laser energy is high and the metal foil is thin,besides the thermal effect by laser ablation, the laser-induced high-pressure(i.e.shock wave)may also damage the foil, resulting in a very complex foil rupture process.[38]The formation mechanism of the flyer remains unclear.
This study aims to examine the formation mechanism of the laser-driven flyer and find approaches to improve the quality of flyers.In the study,the whole LDF process,that a femtosecond pulsed laser cuts an aluminum foil and then drives a nano-scale flyer,was investigated at the atomic scale via twodimensional(2D)MD calculations combined with TTM.The shear strain,changes in the crystal structure,and the time evolution and spatial distribution of temperature, pressure, and density in the foil were obtained via our self-developed processing program based on atom displacement and velocity.The laser-induced shock wave, the phase transformations of the aluminum, and the key factors controlling the rupture of the foil were comprehensively analyzed.
2.Calculation methods
A schematic diagram of the typical LDF process for a single-layer metal foil is shown in Fig.1.A short-pulse laser beam perpendicularly irradiates the foil through a transparent quartz substrate.A certain thickness of the metal foil is ablated, melted, boiled, and generated plasma under high laser energy.With the confinement of the substrate,the plasma continuously absorbs the laser energy and expand, which drives the rest non-ablated metal moving along the incidence direction of the laser.After that,the accelerated part will be cut off from the whole foil and continuously moves forward at a high speed,thereby generating a flyer.
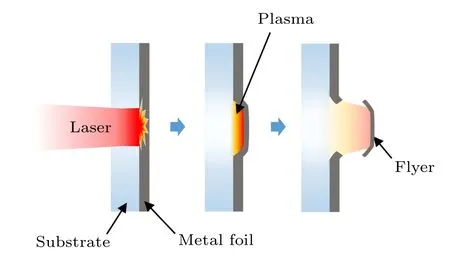
Fig.1.Schematic diagram of the laser-driven flyer process.
Here, we performed MD calculations to study the LDF process that a femtosecond-laser drives a nano-meter aluminum flyer (121.5 nm in thickness).The calculation model is shown in Fig.2.The aluminum supercell is face-centered cubic (FCC, lattice length of 4.05) with a dimension of 121.5 nm×0.81 nm×1822.5 nm for thex,y, andzdirections,respectively,which contains 10.8×10⁶atoms.The supercell density was 2.694 g/cm3,which was obtained by a relaxation under a canonical ensemble (NVTensemble, where moles (N), volume (V), and temperature (T) are conserved)at 300 K for 5 ps,followed by an isobaric—isothermal ensemble(NPTensemble,where moles(N),pressure(P),and temperature(T)are conserved)simulation at 0 Pa and 300 K for 70 ps.[39,40]Periodic boundary condition is applied in theydirection, whereas the boundary in thexandzdirections are nonperiodic.The 9/3 potential Lennard—Jones (LJ) wall was applied on the edge of the supercell to describe the confinement of the substrate on the aluminum foil,in which the potential energy (E) was calculated based on the distance between atoms and the LJ wall(r),as shown in the following equation:

where ε and σ represent the strength factor (i.e.1) and size factor (i.e.2) of the interaction between atoms and the LJ wall,respectively.rcis the cutoff distance(i.e.6).When the atoms were far from the LJ wall, it attracted them; when the atoms were close to the wall,it repelled them.[41]An 800-nm wavelength, 200-fs pulsed laser with 1216-nm diameter was focused on the metal foil along theydirection.Four different laser fluences(0.546 J/cm2, 1.364 J/cm2, 2.73 J/cm2, and 4.09 J/cm2) were investigated.Under such laser wavelength,the studied laser power is less than the criteria of the saturated absorption for aluminum (1015W/cm2), and thus the penetration depth of the laser was determined as 7.53 nm in the model according to experimental observations,[42]as shown in the red irradiation region in Fig.2.In this region,the time and space distributions of laser energy(S)[35]were described via Gaussian-shaped and flat-top functions,respectively:

whereF0, τ, anddrepresent laser fluence, pulse width, and the penetration depth of the laser,respectively;trepresents the time andt0is the time with the maximum laser energy;xis the coordinate andx0represents the position of the foil surface.
As mentioned above, the TTM was used to calculate the laser absorption of aluminum.In the TTM, the temperatures of the aluminum electron and lattice were calculated separately[27]
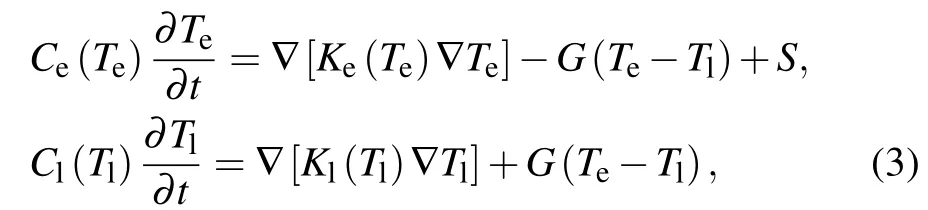
where the electrons firstly absorb the laser energy(S)and are then transferred to the lattice by an electron—phonon coupling factor (G);Te,Ce(Te), andKe(Te) represent the temperature,heat capacities,and thermal conductivities of the electron,respectively;Tl,Cl(Tl), andKl(Tl) represent the temperature,heat capacities, and thermal conductivities of lattice, respectively.The parameters used in Eq.(3) are shown in Table 1 and the detailed descriptions can be found in Ref.[31].

Table 1.Parameters used in the TTM model.[31]
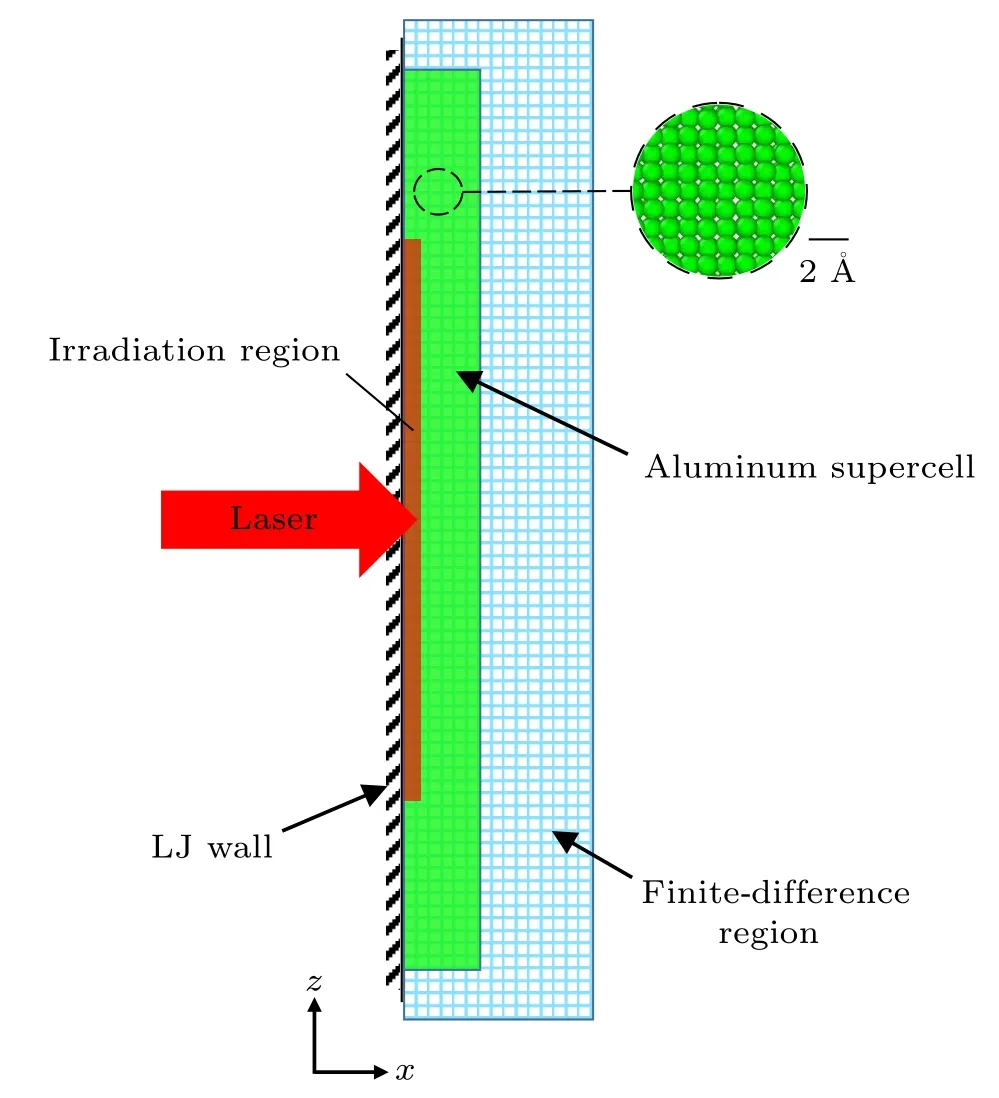
Fig.2.Schematic diagram of laser-driven flyer calculation method.The Lennard—Jones (LJ) wall is adopted to describe the effects of the substrate.In the finite-difference region, the temperature of electrons and lattice are calculated by the two-temperature model.
To solve this model,a finite-difference region(blue mesh in Fig.2)with a dimension of 405 nm×1832 nm(mesh size:Δxof 2.03 nm and Δzof 8.1 nm)was established.The area was much larger than that of the aluminum foil, so that the entire interaction process between laser and foil could be considered.The calculated TTM energy was then transferred to the atomic kinetic energy in the MD simulations.The EAM potential was used to calculate the atomic force, energy, displacement, and velocity at each MD time step (1 fs for our study).[19]EAM is a semi-empirical multi-body potential model based on density functional theory (DFT).It has been widely used in MD simulations of heat conduction, thermal expansion, melting,and vaporization of metal and also enables to simulate generation and movement of the flyer during LDF according to our previous study.[37]The lattice length (4.0528), critical temperature (6800 K), Hugoniot curve of aluminum calculated by Liu’s EAM are in good agreement with experimental observations[43]and theab initiocalculation results,[44]indicating our calculation can be reliable describe the behavior of aluminum under extremely high temperature or high pressure (especially shock) environment induced by laser (verification of Liu’s EAM can be found in supplementary material).Detailed EAM descriptions can be found elsewhere,[19,20]as well as the coupling of TTM and MD.[45]All the calculations were performed by the Large-scale Atomic/Molecular Massively Parallel Simulator(LAMMPS).[46]The atomic coordinates, velocities, and stress tensors of aluminum for each time step were recorded.Based on these,the temperature and pressure distributions in the aluminum foil were calculated by our homemade processing code.In our processing method,the calculation domain was firstly meshed based on two lattice lengths of aluminum(0.81 nm)along withxandzdirections.Then,the temperature and pressure for each sub-region were calculated to obtain the time evolution and spatial distribution of physical characteristics in the foil.The temperature was computed based on the atomic kinetic energy,the number of degrees of freedom (i.e., 3), and the Boltzmann constant(kB)[46]
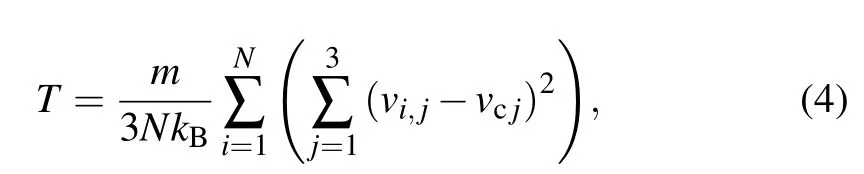
wheremandNrepresent the molar mass of the atom and count of atoms in the sub-region, respectively.vi,jis the atomic(atomi) velocity along thejdirection, which is subtracted by the center-of-mass velocity of the sub-region along thejdirection(vcj).
The pressure was computed as the negative per-atom stress tensor(S)divided by the per-atom volume(i.e.,Voronoi volume)[47]

whereSixx,Siyy,andSizzrepresent the stress tensors of atomiin the sub-region alongxx,yy,andzzdirections,respectively.Virepresents the Voronoi volume of the atomi.
3.Results and discussion
4.Flyer formation process and flyer characteristics
Figure 3(a) shows the snapshots of the aluminum foil at different times when the laser fluence was 2.73 J/cm2.The green represented the FCC structures and the gray represented amorphous structures.The radial distribution function(RDF)of the atoms in the gray region (at 40 nm in thickness) was analyzed in Fig.S1.Compared with the initial RDF curve of FCC atoms that had a periodic distribution of peaks,the RDF in the gray region had a non-periodic distribution and the peak value decreased.This indicated that the aluminum was in a liquid or gas state.It can be seen that from 5 ps to 50 ps,the atoms near the laser irradiation region changed to an amorphous porous state, indicating melting or vaporization of the aluminum.This region can be considered as the plasma and it can be seen that the plasma expanded with time.By contrast,there was no significant change in the atomic arrangement in the right region of the foil and the right piece moved along the positivexdirection.As the plasma continued to expand,the atoms in the ablation region started to gather.Clusters and nano-void could be observed in this region.Meanwhile, the deformation of the right side became more distinct (150 ps).Finally, a portion of the foil on the right side was sheared off from the whole part and continuously moved forward after the foil was ruptured, indicating it was the flyer (300 ps).From the above results,it can be seen that the whole process of the LDF can be simulated by our method.These simulation results were then compared with high-speed photographs (Fig.3(b))of a flyer reported by Yuet al.[48]In the left photograph, the black zone near the substrate surface was thought to be the region subjected to the laser-induced compression effect.In the right photograph,the black crescent-shaped object was the flyer.It can be seen that our calculated metal foil deformation(for 5 ps and 50 ps)and the shape of the flyer were very similar to the experimental data.In addition,from our simulation,although the flyer was mostly under FCC, the atomic state at the inner surface(facing the laser)of the flyer was disordered.This was in good agreement with the test result obtained by Guoet al.,[49]which also found melting or vaporization on the inner surface of the flyer or on the fracture surface of the foil.
Fig.3.(a)MD snapshot of the laser-driven aluminum flyer at different times for a 2.73-J/cm2 laser fluence.Aluminum atoms at FCC crystal structures are shown in green and amorphous structures are shown in gray.(b)Photographs of a flyer from Yu et al.[48]
Due to the acceleration by the laser, the velocity of the flyer’s out surface firstly increased with the oscillation and then almost reached a constant velocity as shown in Fig.S2.The oscillation of the velocity indicates the propagation and reflection of shock waves or rarefaction waves in the aluminum foil (also supported by Figs.6—8).This velocity history is similar to experimental observations on laser-driven micrometer thickness foil.[13]In addition,the final flyer velocity increased with the increase of the laser fluence, as expected.The maximum flyer velocity can reach more than 2 km/s when laser fluence is 4.09 J/cm2in our simulations.Figure 4(a)shows the snapshots of the flyers under various laser fluences when the flyer velocity reached stable,and figure 4(b)plots the radial distribution of flyer thickness.(For the 0.546-J/cm2fluences, the time was 600 ps; for the 1.364-J/cm2, 2.73-J/cm2,and 4.09-J/cm2fluences, the time was 300 ps.) For all laser fluences, the flyers were thin in the middle and thick on both sides, with small differences by thickness.With increasing laser fluence,the overall flyer thicknesses decrease(71.1 nm,53.3 nm,43.7 nm,and 37.1 nm,respectively).These changes of the flyer velocity and thickness under different laser fluences(strengths)were consistent with previously reported experimental results.[11,50]Based on the above results,although the MD method could not achieve a micrometer scale LDF calculation (limited by the calculation cost), our calculation results are qualitatively consistent with previously reported experimental observations, indicating that our calculations can reliably simulate the process of LDF.Moreover, under the highest three laser fluences,the flyers show very good flatness and integrity,implying good application prospects.However,at 0.546-J/cm2laser fluence, the flyer diameter and thickness changed abruptly, showing an irregular flyer shape.The reasons for this difference will be discussed below.

Fig.4.Snapshot of the flyer(a)and radial distribution of flyer thickness(b)at various laser fluences.
4.1.Phase transformation, shear deformation, and rupture of the aluminum foil
To study the change in internal structures of the foil and the rupture of the foil, we investigated the Von Mises shear strain distribution of the aluminum foil at different times and laser fluences as shown in Figs.5(a)and 5(b).The shear strain was analyzed based on the Green—Largransian strain sensor for each atom, which was calculated by atoms displacement vectors and atomic deformation gradient tensor from initial atoms positions, and visualized by OVITO.[51]In the figures,the strain in the ablation region was not considered because it was in liquid or gas states.It can be seen that, at 2.73-J/cm2laser fluence,shear slide bands occurred inside the foil.The shear bands developed near the edge of the laser ablation zone and then penetrated foil with time.After 30 ps, cracks appeared on the outer surface of the foil and then extended inwards along with the shear bands.As a consequence, the foil was ruptured.The flyer thereby separated from the foil.By contrast, at 0.546-J/cm2laser fluence, the internal shear strain of the foil was much lower.No significant shear bands were observed.The position of the initial cracks was closer to the central axis of the foil and the cracks took more time to penetrate the foil than that of high laser fluence.The above results show that at high laser fluence, the shear bands facilitate the rupture of the aluminum foil,thereby accelerating the generation of the flyer.We also studied the change in the crystal structure of the aluminum foil as shown in Figs.5(c) and 5(d).The crystal structure was determined by the angle distribution of a central atom with its neighbors via the Ackland—Jones bond-angle method[52]and visualized by OVITO.[51]The FCC,hexagonal close-packed(HCP),and body-centered cubic (BCC) are represented in green, red, and blue, respectively.At 2.73-J/cm2laser fluence,with the disordered plasma region (gray) increased and expanded, crystal phase transformations from FCC to BCC and HCP near the ablation interface were observed, especially for the first 10 ps (Fig.5(c)).BCC mainly occurred within the diameter of the laser beam.It spread along the laser direction but then revert to FCC as the foil began to deform after 15 ps.By contrast, HCP was radially located at the most intense deformation region of the foil,then expanded to the out surface of the foil with time,and finally turned into an amorphous state after 30 ps.Combined with Fig.5(a), it can be seen that this phase transformation from FCC to HCP has a strong correlation with the generation of shear bands.In contrast, at 0.546-J/cm2laser fluence,no significant transformation from FCC to other phases was observed from Fig.5(d).The right part of the foil remained FCC until cracks appeared on the outer surface of the foil after 140 ps.The above results show that the foil rupture mechanism is a bit different under different laser powers.High laser fluence facilitates the destruction of the internal structure of aluminum foil.
Fig.5.Von Mises shear strain of half the foil at various times for laser fluences of 2.73 J/cm2 (a)and 0.546 J/cm2 (b).Crystal structure of half the foil at various times for laser fluences of 2.73 J/cm2 (c)and 0.546 J/cm2 (d).
4.2.Evolution of physical parameters in the foil and flyer generation mechanism
To explore the dominant factors of the shear bands and phase transformation in the foil and further reveal the flyer generation mechanism,the evolution of physical parameters in the foil was analyzed.Figure 6 plots the contours of temperature,pressure,and density at various times under 2.73-J/cm2laser fluence.In Fig.6(a),the high-temperature irradiation region diffused with time,and the temperature in this region was always the highest.At the laser radiation surface,the electron and lattice temperatures reached a balance of about 5×10⁴K within 0.9 ps and then decreased slowly(as shown in Fig.S3).From 2 ps—10 ps, the maximum temperature at the radiation surface decreased from above 3×10⁴K to about 2×10⁴K,indicating that the laser energy was transferred to the inside of the foil.Figure 6(b) shows that there was a low-density area (<1.5 g/cm3) in the foil that coincided with the hightemperature area,which should be attributed to the melting or boiling of aluminum.In the meanwhile,as shown in Figs.6(b)and 6(c), a compression wave with much higher density and pressure than other regions formed near laser irradiation surface and then propagated into the right side of the foil.We believed it is because that the temperature jump resulted in a drastic change in the kinetic energies of the aluminum atoms and this disturbance would move outward.The average wave propagation speed was 9.8 km/s and the peak pressure reached 50 GPa, indicating it is a strong shock wave.In addition, the strength of this laser-induced shock wave has a positive relationship with the laser fluence (for 1.364 J/cm2, the peak pressure is about 28 GPa;for 4.09 J/cm2,the peak pressure is about 60 GPa).
Fig.6.Contours of temperature(a), density(b), and pressure(c)in the foil at different times under 2.73-J/cm2 laser fluence.
The proportion of FCC structured atoms (by ratio) were counted in the laser irradiation region to assess the dependence of crystal structure transformations on temperature and pressure.The contour of the FCC ratio at the central axis of the foil as a function of time is shown in Fig.7(a).According to the FCC ratio,three zones were determined,which are zone I with FCC ratio>95%,zone II with 1% Fig.7.FCC ratio contours(a)and pressure contours(b)at the central axis of the foil.Pressure,temperature,and FCC ratio at various positions on the foil at 10 ps.(c)The laser fluence was 2.73 J/cm2.Three zones are determined according to the FCC ratio.The FCC ratio of zones I,II,and III is>95%,between 1% and 95%,and<1%,respectively. Fig.8.FCC ratio contours (a) and pressure contours (b) at the central axis of the foil.Pressure,temperature,and FCC ratio at different positions on the foil at 10 ps.(c)The laser fluence was 0.546 J/cm2.Three zones are determined according to the FCC ratio.The FCC ratio of zones I, II, and III is>95%,between 1% and 95%,and<1%,respectively. The contours of the FCC ratio and pressure under the 0.546 J/cm2laser(as shown in Figs.8(a)and 8(b))show that there was also a transition region(zone II)propagated with the shock wave at lower laser fluence.However, the peak pressure of the shock wave was about 16.3 GPa,resulting in only an 18% decrease in the FCC ratio(Fig.8(c)).It indicates that the phase transformation degree has a positive correlation with the laser fluence and laser-induced shock strength.Furthermore, at lower laser fluence, the shock-induced shear force was lower, which might not exceed the shear strength of aluminum.Thus, no shear bands were observed during the foil deformation (Fig.5(d)).The rupture of the foil mainly depended on the increase of the curvature of the out-surface.By comparing results in Figs.7 and 8, it can be seen that, under higher laser fluence,the shock-induced shear bands on the foil facility the rupture of the foil and the generation of the flyer.In contrast,if the laser fluence is low and the laser-induced shock wave is not strong enough, the flyer formation mechanism is different, which mainly relies on the plasma expansion and thereby needs a longer flyer generation time.Since under high laser fluence, the foil fracture is more regular than that under low laser fluence,and the flatness of the flyer is also higher,it can be deduced that the shear band also contributes to generating high-quality flyers.In addition,the phase transformation of BCC at the shock front reverts to FCC with the rarefaction wave propagation and the decrease of pressure,which ensures the generated flyer has a pure internal structure of FCC under the high laser fluence.On the whole,our results demonstrate the key effect of shock-induced shear bands under high laser fluence on foil rupture and flyer generation,which could guide the laser design in LDF and help to improve the planarity and integrity of flyers. The entire process of femtosecond LDF formation was investigated at the atomic scale,via MD and TTM.The rupture of the foil and the generation process of the flyer were directly observed.The shear strain, phase transformation, and time evolution and spatial distribution of temperature,pressure,and density in the foil were obtained according to atom displacement and velocity,so as to further investigate the laser-induced effects and flyer generation mechanism.Our calculated flyer shape and velocity at various laser fluences were in agreement with previously reported experimental results.We found that under high laser fluence, there were shear bands developed from the edge of the laser ablation zone in the foil,which promoted the rupture of the foil.The generation of shear bands was attributed to the strong shock wave induced by high power laser, which accelerated the partial foil within the laser beam diameter to several km/s in a short time, therefore leading to high shear strain.Compared with lower laser fluence, for which no shear band was observed,the foil fracture under high laser fluence is more regular,generating a flyer with better flatness and integrity.We also revealed phase transformations of aluminum during LDF.The transition from FCC to BCC occurred at the shock wavefront, whereas the HCP was mostly located at the highly sheared area and only was found at high laser fluence conditions.The shock-induced BCC phase reverts to FCC with the decrease of pressure,therefore,even under high laser fluence, the internal structure of the generated flyer remains in pure FCC.The results here not only comprehensively elucidate the flyer formation mechanism during the LDF process,but also reveal the critical role of shock-induced shear bands in flyer generation, which enables further development of the LDF technique. Acknowledgments Project supported by the National Natural Science Foundation of China(Grant No.11832006)and the Opening Fund of State Key Laboratory of Explosion Science and Technology in China(Grant No.KFJJ20-04M).

5.Conclusion
猜你喜欢
杂志排行

Chinese Physics B的其它文章
- High sensitivity plasmonic temperature sensor based on a side-polished photonic crystal fiber
- Digital synthesis of programmable photonic integrated circuits
- Non-Rayleigh photon statistics of superbunching pseudothermal light
- Refractive index sensing of double Fano resonance excited by nano-cube array coupled with multilayer all-dielectric film
- A novel polarization converter based on the band-stop frequency selective surface
- Effects of pulse energy ratios on plasma characteristics of dual-pulse fiber-optic laser-induced breakdown spectroscopy