In situ measurement on nonuniform velocity distribution in external detonation exhaust flow by analysis of spectrum features using TDLAS
2022-01-23XiaoLongHuang黄孝龙NingLi李宁ChunShengWeng翁春生andYangKang康杨
Xiao-Long Huang(黄孝龙), Ning Li(李宁), Chun-Sheng Weng(翁春生), and Yang Kang(康杨)
National Key Laboratory of Transient Physics,Nanjing University of Science and Technology,Nanjing 210094,China
Keywords: velocity distribution,tunable diode laser absorption spectroscopy,nonuniform flow,Doppler effect
1. Introduction
Velocity plays an important role in the investigation of combustion mechanism.Velocity nonuniformity cannot be neglected when the effect of boundary layer or pressure nonuniformity is obvious. The velocity in the core flow is a vital parameter in the analysis of engine performance and structural design. Particle image velocimetry(PIV)is a great nonintrusive optical measuring technique that can be used to visualize the flow velocity distribution.[1,2]However,continuously mixing of the tracer particles into the high-speed flow becomes a potential limitation of this velocimetry,leading to complications in real applications, such as detonation flow. In addition the high-power laser and cameras used in PIV systems is required to record two adjacent image within microsecond or even nanosecond scales, causing undesired burden on the hardware side.
Tunable diode laser absorption spectroscopy (TDLAS)is quite attractive from the perspective of practical applications with regard to quantitative measurements, reasonable cost, and fast temporal resolution. This technology shows great potential in the measurement of multiple flow parameters for application ranging from high enthalpy wind tunnel to novel detonation engine and traditional aircraft engine.[3-5]There has been a comprehensive discussion of the capabilities of TDLAS, including measurement of gas temperature,concentration, and velocity in various flows with negligible nonuniformity. Li analyzed the uncertainties of traditional TDLAS-based velocimetry in nonuniform flow caused by various mechanisms and calibrated results.[6]The inherent characteristic of line-of-sight measurement makes it more difficult to achieve spatially resolved measurements. Computed tomography with reasonable projections and reconstruction algorithm would be an effective solution to overcome this limitation.[7-10]However, based on the absorbance integrations along the projections from different angles, only scalar quantities, such as gas concentration and temperature, can be reconstructed simultaneously. Great efforts have been made to improve the accuracy and reduce the computation by probing beam arrangement optimization or various algorithms,such as algebraic reconstruction technique and filtered backprojection. However, velocity measurement in nonuniform flow does not apply to this approach because it is directly inferred from Doppler effect,but not Beer-Lambert law.
Recently, a new approach to reconstruct 2D distributions of partial pressure, temperature, and streamwise velocity is developed by multi-beam TDLAS.Velocity distribution is directly reconstructed from absorbance-weighted transitions when thermodynamic state is obtained by reconstructing two or more integrated absorption coefficients and evaluating local Boltzmann plots. The linear formulation provides a novel way to realize simultaneous and spatially-resolved reconstructions of gas characteristics in high-speed flow fields.[11]Gamba developed another feasible solution to reconstruct spatially resolved velocity distribution according to the spectral absorbance profile from discrete Fourier transform.[12]Qu modified the algorithm and obtained the velocity reconstruction through utilizing the Doppler shifts of absorption lines induced by the interaction between multi-angled laser beams and the target molecules.[13,14]
In this paper, a novel approach of multi-projection TDLAS is developed for measurement on nonuniform velocity distribution of Gauss model. The fundamental theory is presented to provide a universal and in-depth discussion on this common distribution model and relative factors.Following the published theory,coupling relations between velocity distribution and overlapped spectrums along both the probing beam and the reference beam are established. A solution to obtain the tiny variations in components of light-of-sight absorbance profiles at low frequencies and phase shifts by the fast Fourier transform(FFT)is exploited to demonstrate the ability of analyzing the complex absorption signals under the conditions of different nonuniformities. A simulated measurement is carried out on a model generated using a simulation of two-phase detonation flow to demonstrate its reliable performance. This approach is applied to the experiments conducted in our gasliquid detonation facility,offering benefits in dealing with the challenge to measurement of velocity distribution with advantage of insensitivity to the measurement noise. Another advantage is explored for exact solution of velocity in the core flow without extra lasers and detectors.
This paper is organized as follows: Section 2 describes the fundamentals of velocity distribution measurements based on TDLAS and corresponding optical arrangement, with an emphasis on introducing this approach to Gauss model to study its feasibility.The measurement sensitivity to flow properties typically encountered in detonation flows and optical arrangements can be quantified in Section 3. Results are reported to illustrate the measurement uncertainties at the conditions of various signal to noise ratio(SNR)and obvious temperature nonuniformity in flows. In Section 4,a simulated experiment is carried out on a model generated using a computational fluid dynamics(CFD)simulation of two-phase detonation. Expected errors for typical detonation flow profiles are also discussed. Section 5 applies this analysis to experiments in the external flow of a gas-liquid detonation tube to illustrate the usefulness of the results in interpreting practical measurement data. Section 6 provides a summary of the main results and conclusions.
2. Methodology
2.1. Velocity distribution of Gauss model in external detonation exhaust flow
Velocity nonuniformity always exists in the direction perpendicular to the flow because of the boundary layer effects.Jet flow exhausting from detonation tube is a typical nonuniformity flow with high temperature and high speed at the center of the flow. The velocity distribution in the direction perpendicular to the flow is shown in Fig.1.The maximum velocity appears at the center of the flow, and the maximum value falls gradually to the minimum value at the boundaries. The assumption of Gauss velocity distribution in the exhaust flow out of the detonation tube is based on both the CFD simulation and experimental validation by other methods. In CFD method, a two-dimensional (2D) non-splitting unstructured triangular mesh Euler solver on the space-time conservation element and solution element (CE/SE) method developed by Chang[15,16]is used. Simplicity, generality and accuracy are the three main advantages of the CE/SE method. The simulated result in Fig.1(c)in this paper shows a good agreement with Gauss fitting curve. To validate the simulation, a comparative experiment is carried out by schlieren PIV method,where turbulent eddies can serve as the PIV “particles” in a schlieren image and consecutive schlieren frames are analyzed to obtain velocity fields. As shown in the Figs.1(a)and 1(b),the experimental results confirm the fact that exhaust velocity outside the detonation tube exhibits obvious nonuniformity with Gauss distribution. The assumption is also validated by the images in experiments by Jonassen.[17]

Fig.1. (a)The schlieren image of the external flow in our detonation experiment;(b)analysis of the velocity distribution by schlieren PIV method;(c)velocity distribution from CFD and the Gauss fit of the velocity distribution.
This paper aims at providing a more general analysis on distributions of Gauss model,which represents a common form of continuous change in velocity. The theoretical expression of Gauss model is shown as

where the parameterHis the height coefficient andWis the width coefficient,which describe the shape of the distribution curve.Lis the path length perpendicular to the flow,and equal to 0.1m in this paper.Cis the constant which represents the baseline of the Gauss distribution curve. Note that the method introduced in this paper can be applied to other velocity distribution models, which feature continuous or gradient changes in profile,as long as the theoretical expression in velocity distribution can be shown.
2.2. Measurement principle
The collimated laser beam passes through the gas medium and the laser intensity is attenuated by absorption features according to the Beer-Lambert law. The description of TDLAS measurement can be found in the literature[18]and a brief introduction is provided here to facilitate the following discussion. When laser wavelength is modulated to scan the complete absorption feature,the absorbance can be written as

whereAdenotes the integrated absorbance across the target transition.Sfi(T)is the line strength at temperatureT.PandXare the total pressure and mole fraction, respectively.Lis the length of the optical path in the flow.a(f)represents the absorbance at frequencyf. The detailed description of lineshape and fitting method would be found elsewhere.[19,20]For traditional TDLAS-based velocimetry,two probing beams introduced from fiber laser pass through the flow at a certain angleθ. The corresponding absorption spectrums measured will show an obvious frequency shift because of different orientation relative to the direction of the flow. The frequency shift,Δf,would be proportional to the velocity of the flowv,and the equation can be expressed as

wherecis the speed of light,f0is the center frequency of the absorption feature,andδis the coefficient of pressure-induced shift and would not affect the calculation if pressure nonuniformity in the flow can be neglected.
Temperature in the flow is assumed to be uniform at 850 K in this model. The effect of temperature nonuniformity on velocity distribution calculation would be discussed in Subsection 3.4. Other condition parameters,the mole fraction of water vapor and static pressure,are assumed to constant at 0.1 atm and 1 atm. These conditions correspond to an external exhaust flow about 1.5 ms after the detonation wave leaves the detonation tube exit,a representative condition at the outlet of air-gasoline pulsed detonation tube operating at filling coefficient less than 1 in our lab.
H2O is the primary product in hydrocarbon combustion.H2O absorption features in the near-infrared range are ideal targets to be scanned in the TDLAS measurement as the indication function for combustion efficiency. Also, diode lasers and detectors are inexpensive and robust for industrial application within communication band.In this paper,7185.6 cm-1is selected in the following analysis for demonstration,and it has been proved to maintain suitable line-strength and to be free of significant interference from nearby transitions. The spectroscopic parameters of this transition can be obtained from the HITRAN database.[21]
Based on the expected conditions above, the absorbance curves obtained in the simulated of jet flow along the transmitted laser beam at 0°,30°,and 60°are shown in Fig.2. Due to the doppler effect,distinct frequency shifts in overall spectral lineshape are observed in angled beams compared with that in the direction perpendicular to flow. In fact, the frequency shift for specific transition is not fixed according to Eq. (3)because the flow velocity changes,resulting in a tiny increase in lineshape width in accumulated absorbance. In addition,there are significant differences in the amplitude between absorbance curves because of variable pathlength in respective probing beam.
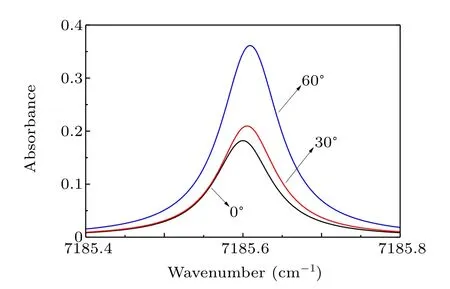
Fig.2. Corresponding H2O absorption spectrums at 7185.6 cm-1 along the transmitted laser beam at 0°,30°,and 60°.
2.3. Reconstruction algorithms and optical arrangement
The inverse problem here is defined as the retrieval of the unknown velocity distributions from the measured absorption spectrum,

Ordinarily, the inverse problem can be characterized by solving the least-square problem. It would be a timeconsuming work when a direct search algorithm for global optimization is applied, such as genetic algorithm. This paper presents a new solution to recover the velocity distribution.Three variables are defined to describe the feature of the overlapped spectrums so that the least-square problem in Eq. (1)can be simplified and solved efficiently.
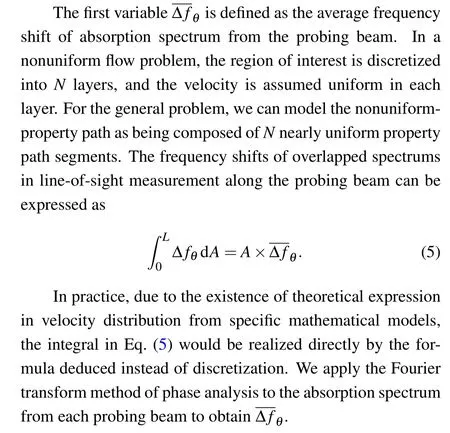
The second important variable Δfmax,θ, the maximum difference in frequency shifts of the absorption spectrum deriving from the difference betweenvmaxandvminin the flow along probing beam at angleθ,can be expressed as

The other variable is shape factorEθ,which is introduced to feature the overlapped spectrum profile. ObviouslyEθdepends on height coefficientH(or Δfmax,θ) and width coefficientWin Gauss model. For example, increase in height coefficientHwould distance the location of absorption features in each layer, and flatten the shape of overlapped spectrum in time domain, resulting in variations of corresponding low frequency signals. Here we define the shape factorEθwhich represents ratio of low frequency components in light-of-sight absorbances between probing beam and reference beam

whereIθandIrefare transmitted laser intensity of the probing beam and the reference beam.Fis the cut-off frequency which is related to the wavelength scanning speed of the diode laser.Eθwould be directly calculated from the experiment result.
In theory,three optical beams,two probing beam and one reference beam are necessary to provide enough projection information to calculate independent parametersH,W, andCsimultaneously. The optical arrangement for velocity distribution measurement in nonuniform flow is shown in Fig.3. One reference beam is required to pass through the region of interest vertically, providing a reference value to normalize the spectrum difference in frequency shift and amplitude in each probing beams. Two probing beam, each with a unique orientations, pass through the region and yield to an overlapped spectrums,resulting in theEθaccording to Eq.(6). This system is not more complex than traditional TDLAS-based velocimetry in uniform flow.
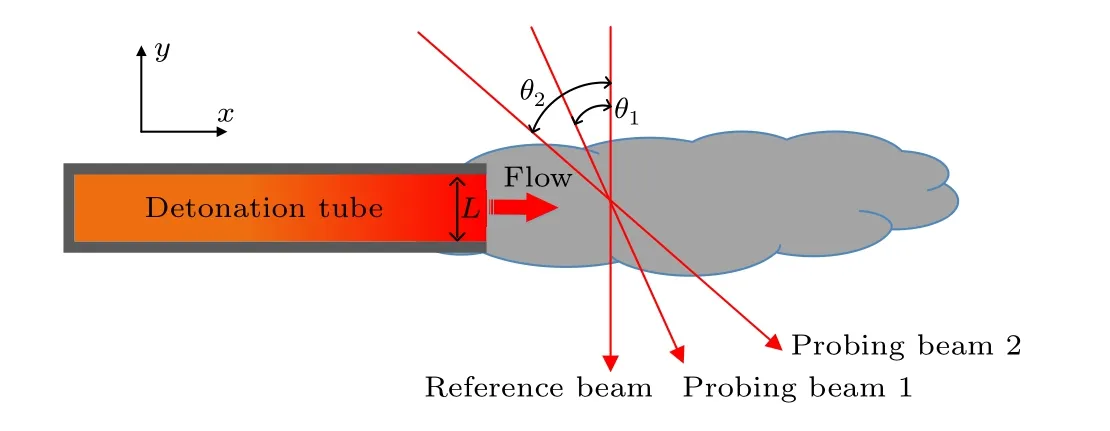
Fig.3. Beam arrangement for velocity distribution measurement in nonuniform flow.
Note that the effect of Δfmax,θorWonEθexhibits continuous and monotonic behavior, andEθcan be calculated directly from the measured light-of-sight absorbance in each beam. Therefore, the relations betweenEθ, Δfmax,θandWwould be established by simulated spectrums along the specific probing beam at angleθunder the condition of other known parameters. The least-square problem in Eq. (1) can be simplified into a 2D optimization searching problem
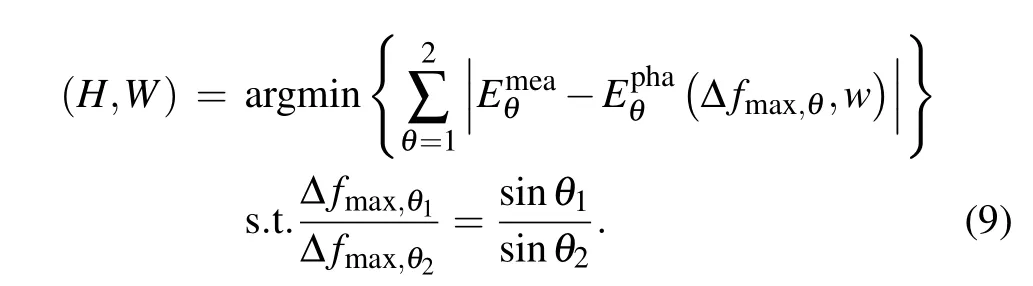
Two characteristic curves of Δfmax,θversusWat specificEθwould cut at point whereWand Δfmax,θare confirmed,and height coefficientHcan be inferred based on the monotonic relation with Δfmax,θ. Then the constantCwould be directly calculated by Eq.(3)further. A step-by-step approach for velocity distribution reconstruction is given in Fig.4.

Fig. 4. Steps of Gauss velocity distribution analysis using multi-projection TDLAS.
Relative velocity errore(l)at positionlis defined as

wherevmea(l) andvpha(l) are respectively the measured velocity and corresponding value in model at specific positionlalong theyaxis. The quality of velocity distribution measurement is evaluated byeavewhich is the arithmetic average value of relative velocity errorse(l).evmaxandevminrepresent the relative error at maximum and minimum velocities,respectively.
3. Discussion
3.1. Effect of the model and optical arrangement on measurement sensitivity
As mentioned above,Eθis dependent on bothH(or Δfmax,θ) andWin Gauss model according to Eq. (1). Typical curves that Δfmax,θvariesEθwithWranging from 2 to 6 are plotted in Fig.5. The results shown provide several useful observations.
Firstly, Δfmax,θincreases with decreasingEθ, and Δfmax,θhas better sensitivity in smallerEθ. Obvious velocity difference betweenvmaxandvminwould help to reduce the shape factorsEθaccording to Eq. (8) and improve the accuracy in determining coefficient further.Eθclose to 1, would lead to oversensitive to Δfmax,θand a small disturbance in overlapped spectrum would cause an unacceptable measurement error in practice. For example, a small fluctuation with amplitude of 0.5%inEθwould make errorsevmaxup to 3.80%and 18.78% when measurement is carried out atEθof 0.975 and 0.992,respectively.
Secondly,calculation at differentWyields a similar trend.Increase inWwill be helpful to improve the measurement sensitivity to some extent.
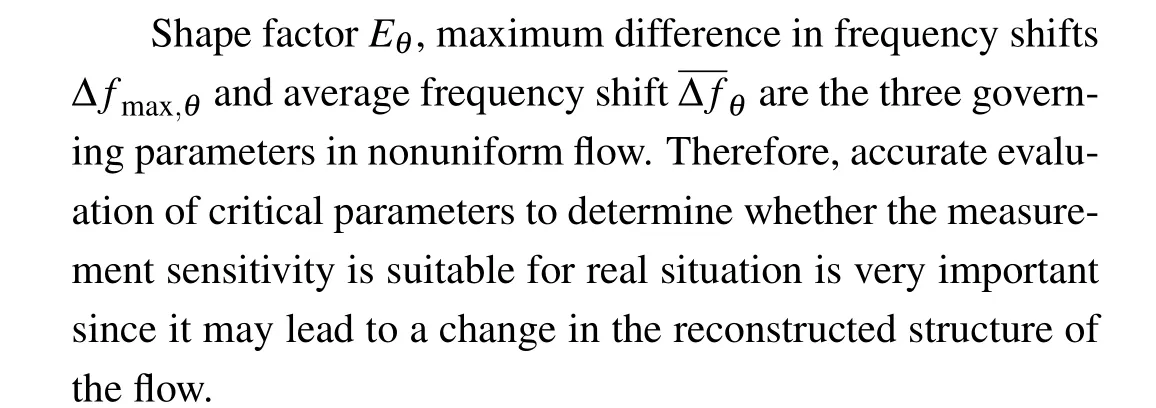
Thirdly,a correct estimate ofEθwould be a good predictor of optical design and the measurement accuracy. Increase the angle between the probing beam and the reference beam in the optical arrangement would also help to obtain a better sensitivity of Δfmax,θ, especially when a smallerEθis required under conditions of less nonuniformity in the flow. As shown in Fig.6,the angle larger than 30°would be suggested to keepEθbelow 99.5%,which is suitable for the models in this paper.

Fig. 5. (a) Function relationship between Δfmax,θ and Eθ for the model of Gauss velocity distribution with W ranging from 2 to 6 along the probing beam at angle 30°. (b)The 1st derivative of Δfmax,θ varies with Eθ.
Fig.6. Function relationship between Eθ and θ for the model of Gauss distribution.
3.2. Uncertainty in velocity distribution measurements caused by calculation of average frequency shift in overlapped spectrum

3.3. Consideration of measurement noise
In the analysis presented in this paper, we assume the measurement noise to be random with a normal distribution.SNR of the measurement is defined as the ratio of transmitted laser intensity to noise.[6]In practice, a minimum detectable absorbance(MDA),at an order of 10-4,could be realized representing the precise measurement subjected to fundamental noise, such as laser intensity fluctuation, detector noise, and environment noise. With the H2O transition at 7185.6 cm-1and flow conditions mentioned above, the SNR in measurement is about 400. The angles for the probing beams are 30°and 60°in the optical arrangement in Fig.3.The measurement results for Gauss distribution are shown in Fig.7.

Fig.7. (a)Measurement results for Gauss velocity distribution and(b)relative errors.
In general, the method demonstrates satisfied performance for accuracy and computation. Under the simulation condition above, two specificEθ, about 0.995 and 0.990,would be inferred from the angled laser beams and the reference beam perpendicular to flow according to Eq. (8). The relative errors for bothEθare less than 0.1%due to the noise in the accumulated absorbances. Then two typical curves of Δfmax,θversusWat respectiveEθwould be formed from simulated spectrums,and there would be a specific point at which two curves would meet, representing the optimal solution about Δfmax,θandWfor both two angled laser beams.Wis directly determined from the intersection point,and then corresponding height coefficientHcan be inferred from Δfmax,θdue to the monotonic relation. Compared with intersection point obtained from absorbances without noise,the relative errors occurring in the determination ofH,WandCare 0.18%,0.67%, and 0.21%, respectively, in precise measurement, resulting in the relative velocity errorevmaxin the core flow is only 0.11%, much smaller thanevminof 1.52% at the boundaries according to Eq.(1). The averaged velocity errorseaveis only 0.33%.
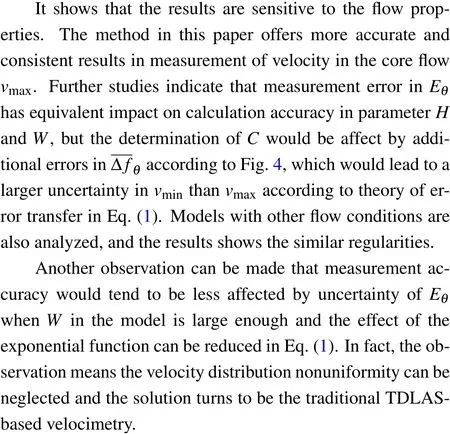
Simulations are performed to analyze the accuracy of the results when measured absorbance contains different levels of noise. Again, random white noises, with amplitude ranging from 1×10⁻⁴to 9×10⁻⁴,are added into the overlapped spectrums to simulate the measured signals in practice. Results for each SNR are conducted from 100 times of average calculation of velocity calculation containing random noise at the same level in the consideration of statistical nature of the noise. The results are shown in Fig.8. All errors increase with increasing noise amplitude, and the averaged velocity erroreaveremains below 1.40% representing that exact Gauss velocity distribution can be procured in precise measurement.The error invmaxin the random noise range is only 0.53%, much smaller thanevminof 5.82%.
When measurements are influenced by larger noise sources, the MDA would be equal to or greater than the order of 10-3. A noise equivalent absorbance of 2×10⁻³is applied here to investigate the accuracy in rough measurement.The result shows there is no drastic change in relative errors mentioned above. Averaged velocity errorseavecaused by measurement noise are 2.53%. The simulation suggests this method can be accepted in a variety of abominable environments.
Fig.8.Effect of random noise in absorbance on measurement errors of Gauss velocity distribution.
3.4. Effect of temperature nonuniformity on velocity distribution calculation
As mentioned above,the analysis of velocity distribution are conducted under the assumption of uniform flow parameters, including temperature, pressure and gas component. In fact, it is a typical situation involving temperature nonuniformity in the supersonic flow, and the temperature in the core region may be lower due to conversion of the kinetic energy in some cases.[6]The temperature variety along the probing beams would change the linewidth and cause distortion in the shape of overlapped spectrums,which would bring uncertainties to determination of Δfmax,θand Δfθ. Here, the effect of uncertainty due to temperature nonuniformity on velocity distribution calculation is analyzed. The model and results are shown in Fig.9.

Fig. 9. Model and measurement result of Gauss velocity distribution under the condition of nonuniform temperature along the probing beam.
In this instance, the relative errors in determination of Δfmax,θdue to the temperature variety is approximately 0.83%,and the corresponding error ofWis 10.23%. It is evident that the temperature nonuniformity would cause obvious error in the velocity distribution results eventually. Althougheaveis only 3.85%,there would be a relative velocity error up to 10.53%appearing at the half of peak in the velocity curve.With increasing temperature nonuniformity,the results would deteriorate and cannot be accepted in practice. This condition would be more favorable when a more suitable absorption feature is suggested to provide a spectrum less affected by temperature change. Another feasible solution is to obtain the temperature distribution in the models by discretization technique or distribution fitting technique,and this sensing strategy has been discussed and demonstrated.[22]Then, the solution of velocity distribution would follow the same steps as above using known temperature properties in models, as shown in Section 5.
4. Simulated measurement on detonation flow
To validate our findings for velocity distribution profiles found in actual experimentation,a simulated TDLAS-Doppler experiment is carried out on a model generated using a simulation of two-phase detonation by a two-fluid model. The computational domain is a rectangular 3.5 m×6 m enclosure, filled with air at 296 K and atmospheric pressure. The gas-liquid two-phase detonation tube with inner diameter of 100 mm is assumed to be axisymmetric in structure, and the gas and liquid fuel droplets fill the tube at filling fraction of 1. A two-dimensional Euler solver based on the space-time conservation element and solution element (CE/SE) method is employed to simulate the flow field of the detonation tube.The numerical results clearly demonstrate the external flow field of the tube. Further details of the simulation are provided in Ref. [23]. Figure 10 shows external flow field of detonation tube and simulated optical measurement performed near the open end of the tube, with the same arrangement shown in Fig.3. The streamwise(axial)nonuniformities in the measurement region are neglected here. Beam attenuation data is sampled at the rate of 20 kHz for 1 s.

Fig. 10. Model of simulated velocity distribution measurement in a twophase detonation flow.
Three representative cases are examined and the results are summarized in Fig. 11. The use of these three cases is to validate the performance under the conditions of velocity distributions with various amplitudes and shapes. The cases include velocity measurements at a distance of 5 cm from the open end of the detonation tube, corresponding to 0.69 ms,1.16 ms,and 1.81 ms after the detonation wave leaves the detonation tube exit.
It can be seen that velocity nonuniformity is rather obvious in the external flow of detonation tube and should not be negligible. Similar to the Gauss model analysis above,the curves of velocity distribution from CFD simulation in single time step are reconstructed by the optical arrangement shown in Fig.10. Explicit objective function for solving this inverse problem is established based on Eq.(4),and absorbances from three angled probing laser beams are recorded and analysis with FFT in accordance with the procedure shown in Fig. 4.In general, the reconstruction results show a good agreement with CFD simulation in all time steps in the external flow of detonation tube. As comparison, the velocity value tends to be arithmetic average obtained by traditional TDLAS-based velocimetry,which deviates too far from the real situation.

Fig. 11. Three cases of velocity distribution measurement at 0.69 ms, 1.16 ms, and 1.81 ms after the detonation wave leaves the detonation tube exit.
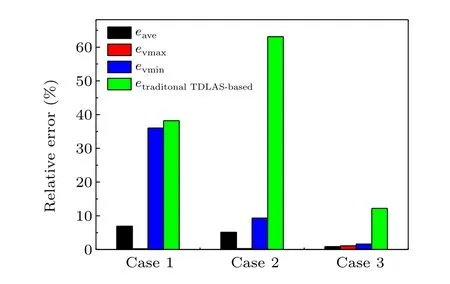
Fig. 12. Velocity uncertainty analysis for simulated experimental results in detonation flow field.
The results shown in Fig. 12 provide error analysis of these cases according to definition in Eq. (10) and explanation in Subsection 2.3.eaveremains less than 7%for all these cases, and the errors in the core flow are much smaller than in the boundary layer. It should be noted that the error values obtained in this simulated case are larger than those for Gauss model mentioned above because the distribution law conflicts with turbulent flow artifacts. The numerical results demonstrate its reliable performance under high-speed and noisy condition, showing its high possibility in reconstructing nonuniform velocity distribution of high-speed flow in low cost and simple operations.
5. Application of analysis to experimental data in pulsed detonation flow field
The analysis above is applied to the experimental data in our detonation facility. Experiments are performed in a detonation tube fueled with gasoline and air, which is made of a 304 stainless steel pipe with an inner diameter of 100 mm and length of 1.8 m. This gas-liquid detonation tube facility is capable of operating up to 30 Hz with controlled filling fraction ranging from 0.6 to 1. The instantaneous exhaust temperature,pressure and velocity behind the detonation wave would reach to 1900 K,1.6 MPa and 1300 m/s,respectively. The detailed description of this facility and the experiments can be found in Ref.[23].
The sensors are tested in the external flow field at a distance of 15 cm from the open end of detonation tube. As depicted in Fig. 3, the sensors include two probing beams with orientations at 30°and 60°, and a reference beam.The pigtailed distributed feedback (DFB) laser, centered at 7185.6 cm-1, is wavelength tuned with a saw tooth current waveform at 50 kHz and the multi-channel signals are simultaneously recorded by national instruments data acquisition system at 20 MS/s sampling rate.
The information about temperature distribution in reference beam is obtained by fitting technique using four intendent DFB lasers scanning absorption features at 7170.5 cm-1,7199.4 cm-1,7185.6 cm-1,and 7444.4 cm-1. The appropriate lower-state energies would ensure the measurement with high sensitivity over the whole temperature range, and the measurement accuracy of velocity distribution would be improved further. The detailed description of temperature distribution measurement in detonation tube external flow field can be found in Ref. [24]. Significantly, there is no difference in optical equipment between the method mentioned in this paper and traditional TDLAS.There is an obvious technical benefit that the existing traditional TDLAS could be easily switched to nonuniform-property path without increasing the complexity and cost of introducing new hardware. Figure 13 shows maximum velocity in the core flow field by Gauss distribution fitting methods,compared with arithmetic average obtained by traditional TDLAS-based velocimetry, under the condition of operating frequency 25 Hz and filling fraction 0.8. Generally,similar velocity trends have been observed between these two curves. The velocity of exhaust decreases rapidly in 5 ms after detonation wave pass through the measurement zone,and then the rate gradually slows down. A short velocity platform less than 2 ms would be observed and account for a large proportion of impulse.

Fig. 13. Comparison of velocity in the core flow field by distribution measurement and arithmetic average velocity by traditional TDLAS-based velocimetry in external flow field of the detonation tube operating at 25 Hz.
This new method provides a more complete and accurate information about the kinematic structure of transient flow and its dynamic distribution perpendicular to the axis.From the results, it can be concluded that velocity nonuniformities along the probing beams are obvious because the velocity in the core flow field is much larger than the arithmetic average value.For example, for the measurement at 2 ms, the measured maximum velocity is 433 m/s, and the arithmetic average velocity is 281 m/s.
Note that the velocity flow field is assumed to be a general Gauss model in this work,and flow parameters along probing beams are assumed to be uniform except temperature and velocity. However,the real detonation flow field would be more complex. As shown in Fig.14(a),there would be Mach disks in specific locations in the supersonic exhaust flow out of the tube after the detonation wave, and the Mach disk would result in a distortion in the assumed Gauss model.To validate the ability of this method to reconstruct the predictable Gauss distribution with distortion, the velocity distribution phantom is obtained at a location 10 cm away from the exit of the tube by CFD simulation,where a specific Mach disk appears. This assumption or modification would be real and be validated by the images in our schlieren PIV experiments,as shown in Fig.14.Obviously,the existence of Mach disk affects the velocity distribution especially in the core of the flow,and the maximum velocity appears at both sides of the central axle.

Fig. 14. (a) Schlieren images of the Mach disk in the external flow in our detonation experiment. (b)Velocity distribution from CFD and the Gauss fit of the velocity distribution.
The measured velocity distribution is reconstructed in the procedure shown in Fig. 4. General variations of velocity are relatively consistent between reconstructed results and this distorted phantom, resulting in the averaged velocity errorseaveless than 11.96%. The results prove that approximate velocity distribution would still be reliable. Significant differences appear at the point where maximum velocity appears in the phantom,and the corresponding relative errors are 32.12%. Compared with traditional TDLAS-based velocimetry, much more information could be provided by this novel method without extra equipment cost and complex optical arrangement.
There may be significant nonuniformities perpendicular to the direction of flow in the region of interest, and reconstruction results would be different when this factor is considered. In the detonation exhaust measurement experiment,the temperature can be obtained by least squares method based on the absorbances from scanning four typical H2O transitions, as mentioned above. The results of measured temperature distribution have been added into condition of phantom in Eq.(4),so that the accuracy of velocity calculation would be improved. The detailed discussion about velocity distribution reconstruction without consideration of temperature nonuniformities has been shown in Subsection 3.4, and the results with consideration of temperature nonuniformities would be much closer to the real value. In addition, it is worth noting that the variation of temperature along the direction of flow in the region of interest is neglected. A similar validation is carried out on the phantom in Fig. 9 including about 100 K temperature decrease along the direction of exhaust flow. Averaged velocity erroreaveis only 0.72% due to the limited temperature variation within the region of interest, and this assumption is conformity with reality.
Lastly,this work focuses on the ability to recover the velocity distribution and neglected some types of uncertainties.For example,in practice,serious beam steering caused by density gradient in high pressure exhaust within about 200µs after detonation wave rushing out of the tube can be observed,and the majority of laser beam would not be coupled into the fiber in this case. Then detected laser intensity would decrease obviously and the SNR would drop to less than 10 quickly.The estimation of relative errors in this very harsh environment is calculated at the condition described in Section 3 with smaller SNR about 10. The results show the averaged velocity erroreaveis 7.12%, representing that the general velocity distribution is consistent with phantom with very noisy laser absorbance data. The errors invmaxandvminare 6.75% and 16.78%respectively,which means this method would be much helpful particularly in recover the velocity in the core of exhaust flow. A fitting procedure to reduce the effect of noise would be investigated further by revising the relationship in Eq. (1), so that the accuracy in calculating velocity distribution would be improved.
6. Conclusion
In conclusion,a fast and effective technique for measurement of velocity distribution in nonuniform flow has been developed from this study. The method allows investigating the dynamics of the processes in exhaust flows that mimics several applications including researching on detonation mechanism and flow evolution.
The proposed methodology is introduced and the analysis of velocity distribution reconstruction is carried out by simulation on Gauss models to discuss the sensitivity and reliable performance under the condition of noisy projections.With H2O feature at 7185.6 cm-1,an analysis of average and maximum difference in frequency shift by FFT in probing beams is exploited and demonstrated to solve the relations between Gauss model and overlapped spectrums along the probing beams.Eθbelow 99.5%is suggested to maintain a better sensitivity of Δfmax,θby increasing large angle between probing beam and reference beam in the optical arrangement. The measurement results and models are in good agreement with a deviation less than 2.53% for both precise and rough TDLAS measurement. Especially,vmaxis little affected by the measurement noise in a variety of abominable environments.
Compared with the traditional TDLAS-based velocimetry, this technique provides more promising results for the velocity distributions in high-speed flow without extra optic equipment and has the potential capability to be applied to complex supersonic flow in combustion or detonation. Velocity distribution in the external flow of a gas-liquid detonation tube is measured and this experimental study demonstrates the applicability of multi-projection TDLAS sensing technique for transient flows which enables to study the process more clearly and accurately.
Acknowledgments
Project supported by the China Scholarship Council(Grant No. 201906845059), the Young Scientists Found of the Natural Science Foundation of Jiangsu Province, China(Grant No. BK20190439), and the Fundamental Research Funds of National Key Laboratory of Transient Physics(Grant No.6142604200202).
猜你喜欢
杂志排行

Chinese Physics B的其它文章
- Superconductivity in octagraphene
- Soliton molecules and asymmetric solitons of the extended Lax equation via velocity resonance
- Theoretical study of(e,2e)triple differential cross sections of pyrimidine and tetrahydrofurfuryl alcohol molecules using multi-center distorted-wave method
- Protection of entanglement between two V-atoms in a multi-cavity coupling system
- Semi-quantum private comparison protocol of size relation with d-dimensional GHZ states
- Probing the magnetization switching with in-plane magnetic anisotropy through field-modified magnetoresistance measurement