Efficacy improvement of pharmaceutical waste remediation using interactive nanocomposites with tunable mesopores and structure
2022-01-07LICuixiaZHANGYuhangHURuibingBASHIRSajidLIUJingboLouise
LI Cuixia , ZHANG Yuhang , HU Ruibing ,BASHIR Sajid , LIU Jingbo Louise
(1.School of Materials Science and Engineering, Lanzhou University of Technology, Lanzhou 730073, China; 2.State Key Laboratory of Advanced Processing and Recycling of Non-Ferrous Metals, Lanzhou University of Technology, Lanzhou 730070, China; 3.Department of Chemistry, Texas A&M University-Kingsville, Kingsville 78363,United States; 4.Texas A&M Energy Institute, College Station 77843, United States)
Abstract: Combination of two different types of nanomaterials, titania (TiO2) and reduced graphene oxide (RGO) yielded a unique photo-catalytical nanocomposite (RGO-TiO2). A wet-chemistry with commercial potential derived interactive photocatalysts could respond to the environmental stimuli and self-regulate their structures and biochemical properties. The RGO-TiO2 porous nanomaterials were modified using a mesoporous water-soluble polymer, polyvinylpyrrolidone (PVP) to control the internal channel and porosity. The pore size of these catalysts was increased from 3.41 to 4.81 nm, which maximized the photo-catalytical efficacy of tetracycline (TCH, C22H24N2O8). This in-situ templating was carried out using a feasible sol-gel synthesis to produce different mesoporous RGO-TiO2 nanocomposites sized at 10.5 nm. High degradation rate for TCH was achieved due to rapid H2O and ·OH species adsorption and diffusion. It was also found that immobilization of electrons at the heterojunction improved intrinsic property of photocatalysts. Its reactivity was found to be improved by >30% when applied for degradation of the above pharmaceutical wastes. The electron microscopic study inferred “electron topology” allowed for the shape propagation of electron states adopted as they moved from p to d orbitals in Ti. The individual localization of the electrons successfully prevented the recombination of excited electrons and holes. The life spans of these charge carries (electrons, holes, and excitons) were extended to secure the high efficacy of the TCH degradation under moderate conditions.
Keywords: nanocomposite; reduced graphene oxide supported titania; meso-porous templating; wet-chemistry synthesis; photocatalysis; tetracycline degradation
0 Introduction
A challenge in nanostructured materials is to tune dimensionality and surface chemistries at the near-atomic scale[1]. Literature is focused to the fabrication of nanostructures applied in catalysis, renewable energy and waste management[2]. It is critical to control specific structures to enable desired functions of the products oriented by their end applications[3]. Nanomaterials with high surface area and porosity will enhance catalyst reactivity and self-regulation of structure and properties[4-5]. The design of photocatalysts with rapid response to the external stimuli requires a data-driven approach to ensure photocatalytic activity with high persistence[6]. Fabrication of mesoporous nanomaterials can be carried out by a wet-chemistry method to control pore size and distribution. The uniform dispersion of one component into the supportive substrate can create tunable interface and morphology on the nanoscale[7]. Photocatalytic functionality of mesoporous materials is tuned with changes in band structure. The reactivity of these photocatalysts can be achieved at a selected wavelength window. The chosen light energy is used to drive catalysis to yield reactive species, (such as ·OH radicals) by affecting the reactions between photoelectrons, holes, and primary oxidants at the interfaces[8]. The relationships between synthesis, structures, and functions of nanomaterials have been investigated systematically. The data indicated that the specific parameters for titania-based catalysis can be improved[9]. Therefore, the optimization of fabrication variables and tailoring the band structure of photocatalyts are critical to improve their persistence and responsiveness[10]. Due to the complexity of the relationship between the charge carriers and photocatalytic reactivity, it is highly important to choose catalytical components. It is found that graphene provides a pathway to optimize the design and synthesis variables through supporting scaffold[11].
Graphene has been proved to be a truly unique material and holds the world-record for physical, chemical, electronic, and optical parameters. This family of carbon-based materials display high electrical conductivity, thermal conductivity, specific surface area and charge mobility[12]. Graphene is densely packed in a honeycomb crystal lattice with planar geometry, containing a building block in all dimensionalities. It is found that sp2hybridization and 2D planar geometry within the graphene sheets enable rapid electron transfer[13]. The graphene-based nanocomposites can be used in the fields of photocatalysis and solar energy, due to limiting potential toxicity and excellent durability[14]. Recent studies indicate that graphene can be used as catalyst support to produce different formulations of nanocomposites by controllable exo-structure[15]. The anatase nanosized TiO2exhibits photocatalytic activity under ultraviolet (UV) irradiation and can be inserted into the scaffold. Here, the interfaces between graphene and TiO2are found to improve photocatalytic activity by facilitating charge carrier separation. As a result, these modified TiO2is often considered to possess enhanced photocatalytic activities[16]. This enhanced efficiency of TiO2is the driving force for us to design different formulation and to expand their applications for waste management[17].
Previously, a biota-oriented sol-gel synthesis (BOSS) has been developed for green synthesis. Advantage of this BOSS lies its non-toxic organic solvents (water), use of citrate as hydrolysis inhibitors and surfactants, carried out by conventional laboratory equipment. Our approach of photocatalyst synthesis has a significant potential to transfer from the benchmark to the manufactory floor. The contribution of this paper includes discovery of the cost-effective scale-up synthesis and enhanced TCH degradation efficiency under simulated sunlight.
1 Experimental sections
1.1 Materials used to prepare reduced graphene oxide supported TiO2 nanocomposites
Graphite powder (225 mesh, natural flake, AR), titanium (IV) normal butoxide (Ti(OnBu)4, reagent grade, 97%), the polyvinylpyrrolidone K30 (PVP-K30) binder and tetracycline hydrochloride (TCH, C22H25ClN2O8, USP, 90 %) were purchased from chemical companies in Lanzhou, P. R. China. All chemicals were used as received and without further purication. In all experiments, deionized water with a resistance of 18.2 MΩ was used.
1.2 Synthesis of graphene oxide
Graphene oxide (GO) was prepared from graphite powder using a modied Hummer’s method[18]. In this study, powdered graphite flakes (2.0 g) were added into 232 mL mixed strong acids, composed of sulphuric acid (95%~98% by mass H2SO4, 184 mL) and nitric acid (65%~84% by mass HNO3, 48 mL) under the ice-water bath condition. The above mixture was mechanically agitated in the three-neck round bottom flask for 1 h. The oxidant potassium permanganate (KMnO4, 12.0 g) was added gradually under agitation for 3 h under 4 °C. This redox reaction temperature was controlled at 35 °C and maintained for 1 h. The temperature of this exothermic reaction was then controlled at 85 °C for 1 h. The solution turned yellow-brown from dark greento Mn4+) upon the addition of distilled water (200 mL) after 1 h of stirring. Hydrogen peroxide (H2O2, 20 mL, 30 wt.%) was introduced into the above solution and stirred for an additional hour. The aging occurred when the reaction was completed to achieve a mixed suspension, which was exfoliated by centrifugation to produce graphene oxide (GO). The suspension was neutralized using hydrochloric acid (HCl, 25 mL, 1.0 mol·L-1) to remove metallic cations, followed by a thorough rinse to neutral acidity. To this mixture, an aqueous solution (25 mL, 2.0 mol·L-1) of barium chloride (BaCl2) was used to test for the presence ofas an indication for remaining acidity from sulfuric acid. The thoroughly washed GO filtrate was subject to ultrasonication for 3 h to achieve the high dispersibility, was then dried in a vacuum oven at 60 °C overnight to produce powdered GO.
1.3 Synthesis of reduced graphene oxide (RGO) supported TiO2 nanocomposites
The citric acid (C6H8O7, 100 mL, 0.728 7 mol·L-1) was used as a complexing agent and mixed into the titanium (IV) butoxide (Ti(OnBu)4, 20 mL) under agitation. About 4 mL of distilled water was added to the above mixture and agitated for 15 mins to produce Ti-containing sol. The different amounts of PVP-K30 were dispersed into the sol under continuous magnetic stirring 1 h to produce a colloidal suspension. The amount of the polymeric template was controlled from 6.0 mass% to 14.0 mass% with a gradient of about 1 mass%. The GO (5 mass%) was dispersed by ultrasound in absolute ethanol (C2H6O) for 10 mins and then introduced into the above sol and agitated for 3 h to produce GO supported TiO2suspension[19]. The powdered mesoporous GO-TiO2nanocomposites with different formulations were obtained upon heat-treatment (400 °C, 3 h). The GO-TiO2powder (0.4 g) was then dispersed in absolute ethanol (100 mL) and subject to stirring and UV radiation for 4 h. After the radiation, the reduced GO-TiO2composite was fabricated, and characterized using spectroscopy, and microscopy, in addition to the evaluation of the tetracycline (TCH) degradation.
1.4 Characterization of TiO2 nanocomposites
The crystalline phase and crystallite size were evaluated using D8 ADVANCE powder X-ray (XRD) diractometry (Analytical Instrumentation, Germany) with CuKα1radiation (λ= 0.154 06 nm). The diffraction angle was controlled from 20° to 70° with a step of 0.02° and scanning rate of 2°·min-1. The accelerating voltage was controlled at 40 kV and applied current at 40 mA, respectively. The Jade 7.0 software package was used to analyze the raw data. The morphology, elemental composite, and electron diffraction of the RGO-TiO2were characterized using a transmission electron microscopy (TEM) (FEI Company, Tecnai F20-G2, Hillsboro, OR, USA). The experiment was carried out with an accelerating voltage of 300 kV and a high vacuum. The specic surface areas and porosity of the samples were evaluated by the Brunauer-Emmett-Teller (BET, ASAP2020, Micromeritics Instrument Corp., GA, USA). The nitrogen adsorption isotherms were collected at -196 °C. All the samples were degassed at 180 °C before nitrogen adsorption measurements[20]. The BET surface area was determined using adsorption data in the relative pressure (P/P0) range of 0.05~1.0. The Renishaw Raman spectrometer was used to determine the crystalline structure of different formulations of TiO2nanocomposites, vibration band, and reduction degree of RGO (inVia, Gloucestershire, England, UK). The photoluminescence spectroscopy (F97Pro, Shanghai, Lengguang, P.R. China) was used to evaluate the carrier lifetime based on the peak intensity and shift. The powdered sample was loaded into the sample holder and the spectra were taken in the range 350~550 nm with a selected excitation wavelength of 310 nm. The energy band and adsorption edge were evaluated using Hitachi UV-visible spectrophotometer (U-3900H, Scientific Instruments, Tokyo, Japan) under diffuse reflectance mode.
1.5 Photocatalytic evaluation of TiO2 nanocomposites
The photocatalytic activities of the RGO-TiO2and TiO2alone samples were measured by the photodegradation against an aqueous solution of TCH antibiotics. The degradation efficiency was evaluated under different variables, such as the irradiation of ultraviolet (UV) and simulated sunlight (SS); at fixed and different pH values with different calcium ion concentrations[21]. All tests were carried out under the ambient temperature and pressure. The TCH aqueous solution (20 ppm) was prepared and RGO-TiO2photocatalyst (1 000 ppm) was introduced into the above TCH solution. Before illumination, the mixture was magnetically stirred for 50 min in the dark condition to establish TCH adsorption-desorption equilibrium, using RGO-TiO2and TiO2alone as photocatalysts. The mercury lamp, (Hg, 125 W, 40 mW·cm-2, HPL-N125W/542, Philips Lighting, Eindhoven, Netherlands) was used to generate UV radiation used for the degradation efficiency determination, which was kept at a distance of 15 cm from the liquid surface. A simulator with a xenon lamp (Xe, 500 W, 80~300 mW·cm-2, 250~350 nm CEL-S500, Aulight, P.R. China) was used as the SS source (350~1 100 nm), which was also kept at a distance of 15 cm from the liquid surface. The TCH solution was exposed to the light radiation (UV or SS) for 2 h under agitation. At 20 min intervals, an aliquot (3 mL) was filtered to remove catalyst powder and the supernatant was collected to measure the absorbance using an ultraviolet-visible spectrophotometer (UV-Vis, SP-752, Spectrum Instruments, Shanghai, P.R. China) to determine the degradation efficiency. The aliquots were placed into a quartz cuvette (d= 10 mm) and TCH adsorption wavelength was controlled at 355 nm.
2 Results and discussion
2.1 Structural characterization of materials
2.1.1 X-ray powder diffraction analyses to determine crystalline structure
The corresponding XRD patterns show the formation of GO, RGO, RGO-TiO2composite, and PVP-templated RGO-TiO2(Figs.1(a) and 1(b)). As found from our previous study[20], at the diffraction angle of 13.10°, the diffraction pattern of GO is found, corresponding to the (001) plane. Upon reduction under UV radiation, diffraction at 26.60° is detected due to the formation of RGO. Although the RGO is obtained in this study, its XRD radiation (~ 26°) is overlapped with the major peak (101) of anatase TiO2. Our XRD observation is in agreement with published data[22]that the reduction resulted in a distance decrease of the graphene layer (0.9~0.4), an increase of C/O ratio, and decreases of C sp3hybridization, in which the sp3hybridization of carbon was partially recovered into the sp2hybridization[23]. Our XRD data also indicate that the full width at half maximum (FWHM) of RGO is about 6.674 at a diffraction angle of 23.76°. Scherrer’s equation (K≈ 0.9) was used to calculate the average height (H) of stacking layers (H≈ 1.02 nm). The Scherrer’s equation with Warren constant (K≈ 1.84) was employed to determine the average diameter (D) of the stacking layers (D≈ 8.25 nm). The PVP-templating does result in the composite formation, which are very well indexed (figure of merit: 1.25) with the standard anatase TiO2(JCPDS: 89-4921, tetragonal, SGI41/amd(141), lattice parameters:a= 0.377 7 nm,c= 0.950 1 nm;α= 90°, Cell Volume=0.136 300 nm3), while no signature diffraction peaks from rutile TiO2are detected (Figs.1(a) and 1 (b). The broadened diffraction peaks appearing at 25.40°, 28.10°, 48.20°, 54.20° and 62.70° are assigned to the (101), (004), (200), (105) and (204) lattice planes, indicating that the anatase TiO2is tetragonal with high purity and crystallinity. The above results confirm that the main crystalline structure of the samples has negligible crystallinity changes upon exotic polymeric template PVP-K30 treatment. However, an increase of PVP concentrations (8~11 mass%) results in the peak red-shift of particularly the main peak at (101) plane as shown in the magnified XRD pattern (Fig.1(c)), until the amount reaches 12 mass%. A volcano-shaped relationship (Fig.1(d)) between (101) diffraction angle and PVP-K30 amount is found, corresponding to the degradation efficiencies of the photocatalysts. This shift of the thermo-dynamically stable peak of TiO2corresponds to the tensile stress (< 1.1%) which is found to occur between the boundary of the PVP template and RGO-TiO2composite. The effective strain, ε is calculated to be 0.964 by William-Hall plot (Fig.1(e)), indicating that the lattice expansion occurs along the (101) plane. These defects are found to serve as the chemical reactive sites to allow for tetracycline decomposition[24]. The positive slope of Fig.1(e) suggests the lattice expansion occurred with the increase of PVP-K30 amount, however, whether the effective strain display the volcano-relationship with the PVP amount remains to be determined in our future research. Another observation from the XRD data is the broadening of the major peaks (101) and others, suggesting particle size deduction. The Debby-Scherrer (D-S) equation (Eq.1) was used to calculate the crystallite size of the PVP-templated nanocomposites, by neglecting of the strain effect[25]. The William-Hall (W-H) equation (Eq.2) was used to calculate the crystallite sizes and lattice strains[26]. However, both methods only provide estimation on the crystallite sizes and effective strain due to the complex function of elastic constants and dislocation contrast factors for the polymer templated TiO2-based catalysts. The correlation of the size to the amount of PVP is shown in Fig.1(e), indicating the particle size and amount of PVP-K30 polymer also demonstrated a volcano relationship. The XRD data on particle sizes also confirm that a volcano trend of the ratiometry curve, indicative of the optimized amount of PVP K30 (11 mass%) results in the smallest size (12.5 nm for RGO-TiO2and 11.0 nm for PVP-templated RGO-TiO2) and lowest effective strain. The explanation lies in that highly polarizable PVP-K30 polymer binds to the polar end of Ti-O bonds exceptionally well. As a result, the particle growth of nanosized TiO2is prevented due to this polarity effect and steric hindrance[27]. With the increase of PVP above the 11 mass%, the modification is found otherwise in terms of the trend. Accordingly, this size decrease results in the photocatalytic reactivity increase as shown by the tetracycline degradation.
(1)
(2)
whereβis the full width at half maximum (FWHM),θis the diffraction angle,λis the X-ray wavelength,Dis the average crystallite size andεis the effective strain. In all the cases, the Scherrer formula yields a lower size value as compared to the size extracted from W-H plot, as expected[28].


2.1.2 Transmission electron microscopic analyses to determine morphology
The high-resolution transmission electron microscopic (TEM) images (Figs.2(a)~2(d)) show a well-crystallized particle and pore size uniformity of the RGO-TiO2nanocomposite treated at different concentrations of PVP (6~14 mass%). It is found that the 11 mass% of PVP is as the optimal amount of porogen, along with 5 mass% of RGO as support and all catalysts are under this condition. The RGO5-TiO2without templating has an average size of (10.5± 0.15) nm with high integrity and distributed on the surface of the RGO (Fig.2(a)). Upon treatment of PVP-K30 templated RGO5-TiO2nanocomposite at 400 °C for 2 h, the majority surface appearance is found to be well-distinctive, while some of their edges and corners are subject to polarization due to the polarity of PVP polymeric template (Figs.2(b)~2(d)). It is anticipated that N-doping of the RGO may occur, which will be evaluated in future studies. As the concentrations of the PVP increase from 8 to 12 mass%, the roughness and topology of entire surfaces of RGO5-TiO2are found to be maintained well as shown by the polycrystal-induced ring pattern (Fig.2(e)), selected area electron diffraction pattern (Fig.2(f)) and simulated SAED patterns with different sample thickness (Fig.2(g)), although XRD data indicate an occurrence of tensile stress (Fig.1(e), William-Hall plot). The diffraction geometries including Laue front-plate, back-plate, and cylindrical scattering (Fig.2(h)) were applied to understand topotactic relationships of different components in the nanocomposites. It is found thatin-situtemplating ensures a contiguous network of mesopores whose diameters are found to be averaged 4.8 nm. The TEM analyses provide an in-depth understanding of these fundamental physics and chemical properties of how nanoporous composite forme and how their structure tuned[29]. These TEM evaluations confirm that the frame structures of anatase RGO5-TiO2composites have been subject to minor changes with detectable local stress and crystallite size deduction via polymeric templating. Thein-situtemplating using the non-ionic polar polymer, PVP-K30 as a template successfully tunes the morphology and fine structures of these catalysts, further improving their relationship between nanostructures and catalytical reactivities.
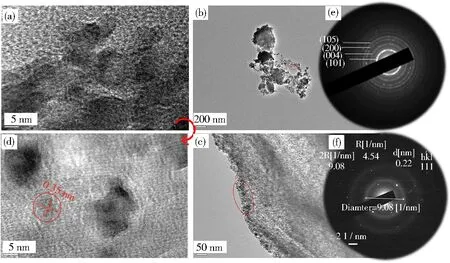


Fig.2 TEM images of selected RGO-TiO2 photocatalysts: (a) 5 mass% RGO-coordinated (RGO5) TiO2; (b) morphological evaluation of RGO5-TiO2 templated with 11 mass% PVP chosen for demonstration; (c) enlarged morphology of the templated RGO5-TiO2 catalyst (red-cycled spot); (d) high-resolution TEM image of the templated RGO5-TiO2 catalyst; (e) ring pattern resulted from polycrystal cluster (A, d(101) = 0.35 nm correlating to the thermodynamically stable (101) plane; (f) selected area electron diffraction pattern and (g) simulated SAED results; (h) Laue plate scattering from the front, back and cylindrical, indicating highly crystallized TiO2 formation upon RGO-coordination and PVP-templating
2.1.3 Brunauer-Emmett-Teller analyses to determine pore structure
The pore structures and porosities (Figs.3(a)~3(d)) of the RGO5-TiO2and PVP-K30 templated RGO5-TiO2were evaluated via adsorption/desorption isotherms obtained by Brunauer-Emmett-Teller (BET) analyses (Figs.3(a) and 3(c)) and Barrett-Joyner-Halenda (BJH) mesopore size distribution (Figs.3(b) and 3(d))[30]. The BET data indicate that the RGO5-TiO2and PVP-K30 templated RGO5-TiO2display a typical IV adsorption isotherm with an H3 hysteresis loop (Figs. 3(a) and 3(c)). The nitrogen (N2) adsorbates are found to be physically absorbed on the surfaces and the internal pores of the catalyst RGO5-TiO2. At low relative pressure (< 0.4), the adsorption raises due to N2molecules filling into the micropores of both RGO5-TiO2and PVP-K30 templated RGO5-TiO2catalysts. At moderate relative pressure (0.4~0.9), the adsorption continues to rise due to the capillary condensation of N2molecules in the mesopores. At the high-pressure region (> 0.9), multi-molecule adsorption of N2adsorbates is observed occurring along the surfaces of the pores. The PVP-K30 templating is found to enlarge the pore sizes of RGO5-TiO2from about 3.40(65) nm to 4.81(56) nm (Figs.3(b) and 3(d)) based on the BJH model. These enlarged pores provide enlarged spaces allowing for interaction between photocatalysts and N2adsorbates, and further multiplying layered adsorption of N2molecules. Also, Figs.3(a) and 3(c) also indicate a type H3 hysteresis loop, where the lower limit of desorption is found to be located at cavitation-inducedP/P0. The TEM (Fig.3(a)) images indicate that the pores in the RGO5-TiO2display “flat plate slit” and wedge-shaped structures[31]. The platelet graphene is another important factor for the H3 type hysteresis loops to occur because of the presence of fractured pores[32]. As mentioned above, the adsorption saturation is not observed in the higher relative pressure region (> 0.9).

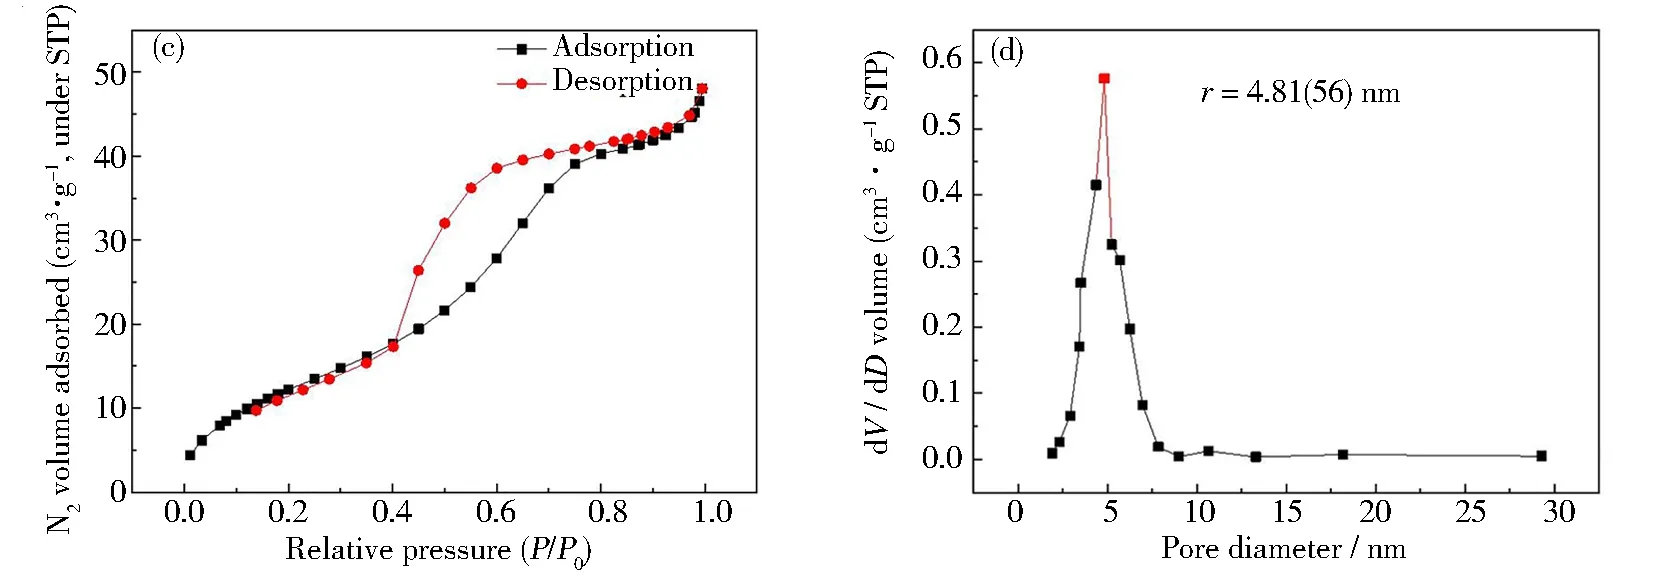
Fig.3 BET analyses of RGO5-TiO2 and PVP-K30 templated RGO5-TiO2 at different concentrations of PVP-K30: (a) RGO5-TiO2 composite showing the type IV adsorption with H3 hysteresis; (b) BJH mesopore size distribution of RGO5-TiO2 composite is determined to be 3.40(65) nm; (c) PVP-K30 (11 mass%) templated RGO5-TiO2 composite showing the type IV adsorption with H3 hysteresis; (d) BJH pore size distribution of 11 mass% of PVP-K30 templated RGO5-TiO2 composite (pore size: 4.81(56) nm). Both BJH studies showing wedge-pore and flat-plate slit-shaped pore structures, allowing for capillary condensation of adsorbents
As illustrated in Figs.3(b) and 3(d), the BET surface area of RGO5-TiO2is 34.89 m2·g-1, where the RGO support is found to effectively enlarge the BET surface area, further improving the tetracycline degradation. The data show the onsets of the hysteretic cycle atP/P0of 0.5 to 0.6, suggesting the mesoporous structure with an average size of 4.81(56) nm is obtained to improve the physisorption of TCH molecules. The mesopores are well-controlled by using this linear nonionic PVP-K30 due to its unique nature of high dispersity, polarity and cohesivity. Also, the specific surface area (48.98 m2·g-1) of the templated RGO5-TiO2is 1.41 times higher than that (34.89 m2·g-1) of the untreated RGO5-TiO2.
The mesopores and high surface areas collectively provide suitable adsorption space and channel to allow the mass diffusion of the aqueous TCH towards the interfaces, and further enhance the degradation reaction with the highest efficiency of 94.22% when the 11 mass% PVP is used under simulated sunlight. This is an advancement in the current state of the art of TiO2-based photocatalysts in pharmaceutical waste management under simulated sunlights without extra energy consumption.
2.2 Nanostructured tunability of PVP-K30 templated RGO5-TiO2 nanocomposites
The above results indicate that the crystallinity, defects, band structure of the photocatalysts are critical factors to determine their reactivities and affect the resultant propensities. This current research invented a feasible and green synthesis to control the structures and porosity as shown in Figs.1~3. The complexity of the band structural changes of the PVP templating was evaluated using different spectroscopic analyses. Spectroscopic data collected using Raman, photoluminescence, and UV-Vis indicate that the crystalline phase structure of TiO2is maintained as anatase, but the lattice distortion (δ= 2.506~2.523) is detected and the bandgap is decreased from 3.21 eV to 2.87 eV. The above results also confirm our hypothesis that the degradation efficiency is strongly dependent on the number of charge carriers (conduction band electrons, valence bond holes and excitons), bandgap energy and a lifetime of the excitons[33].
2.2.1 Raman spectroscopic analyses to evaluate RGO5-TiO2nanocomposites
The Raman spectroscopic analyses were employed to validate the crystalline phase, crystallinity and defects in different formulations of catalysts. The data (Fig.4 and Table 1) show the formation of anatase TiO2and RGO based on their associated distinctive vibration bands. At the lower wavenumber than 1 000 cm-1, the anatase TiO2shows four bands (Fig.4(a)), rising from the (101) O—Ti—O symmetrical stretching and well-indexed with the most intensiveE1g(142.20 cm-1) andEg(636.40 cm-1), of anatase TiO2[34]. The other two bands,B1g(395.40 cm-1) andA1g(512.60 cm-1) are correlating to the (001) O—Ti—O bending variation. The three first-order Raman modesB1g(weak), most intenseEgandA1galong with a second-order vibrational modeEg(SO) are observed for all RGO-TiO2nanocomposites[35]. All Ti—O bond lengths are similar in the octahedral TiO6sub-building unit, ranging from 0.19 to 0.21 nm based on the chemical environmental condition (Fig.4(b)).

Table 1 Summary of Raman modes of TiO2 and graphene

Fig.4 (a) Full Raman spectra of 11 mass% PVP-K30 templated GO5-TiO2 catalysts; (b) visualization of O-Ti-O bonds and their vibration in the sub-building unit of TiO6
The ratio of the intensity of D and G bands (ID/IG) has been used as a metric to evaluate the graphene disorder, such as arising from ripples, edges, charged impurities, the presence of domain boundaries[45]. Our study indicates thatID/IGis decreased from 1.186 (GO) to 1.074 (RGO), indicating the decrease in graphene disorder after GO is partially reduced. The most important observation about this structural deformation of graphene affects the electrical conductance of the RGO5-TiO2and their chemical interaction. Our research also indicates that the defects, such as topological defects (pentagons, heptagons, and/or their combination), vacancies, adatoms, edges/cracks, adsorbed impurities can be found. These defects are derived from the equivalent density of G and D bands[46], leading to the high accessibility of the photochemical sites to improve TCH degradation.
Raman spectra at the lower wavenumber region show a blue shift (5~8 nm) of the most intensive modeE1g,B1gandEgdue to the effective strain, implying a lattice expansion of TiO2(Figs.5(a) and 5(b)). The red-shift of theA1gmode due to the phonon confinement effect suggests the existence of oxygen vacancy defects and side deduction of the nanocomposites. At the high wavenumber region, GO and RGO display three broadened bands, G band and D band (Fig.5(b)). The G peak of GO locates at approximately 1 641.0 cm-1due to the doubly degenerate zone centerE2gmode. This observation is well-indexed with the calculated value by Sun Group and corresponding to single-layered graphene[47]. The D band (1 342.0 cm-1) is attributed to resonant phonons of the TO branch withqnearK, indicating the presence of a significant number of defects in the graphene[48]. The 2D band is observed at 2 658.00 cm-1, indicating the splitting of electron bands[49], since the bi-layered or multilayered graphene is formed. The RGO shows two distinct peaks, G (1 577.5 cm-1) and D (1 358.6 cm-1), respectively. The D band located at 1 358.6 cm-1is due to first-order zone boundary phonons and the breakdown of the continuous hexagonal honeycomb crystal lattice in GO, suggesting the absence from defect-free graphene but existence in defected graphene. The G band is caused by the in-plane optical vibration (degenerate zone centerE2gmode)[50]. Fig.5(b) shows a blue-shift (8 cm-1) of Raman modes for G peak of RGO, suggesting a significant phonon “hardening”, mainly due to the compressive strain resulted from the temperature cooling down after reduction under ultraviolet[51]. Also, Raman shift observed in both TiO2(Eg) and RGO (G bands) collectively suggests that intermolecular interactions between the RGO and TiO2occurr via van der Waals attraction and electron transfer. It can be hypothesized that the π electrons from graphene may enter the empty d-orbitals of the Ti to form a coordinative covalent bond. The ripple-engineering can assist in tuning the charge doping through electron-phonon coupling changes[52].

Fig.5 Raman spectra of 11 mass% PVP-K30 templated GO5-TiO2 catalysts: (a) magnified Raman spectra to demonstrate vibration mode of TiO2; (b) enlarged Raman spectra to demonstrate D and G bands resulted from GO and RGO
2.2.2 Photoluminescence spectroscopic analyses to determine band structure
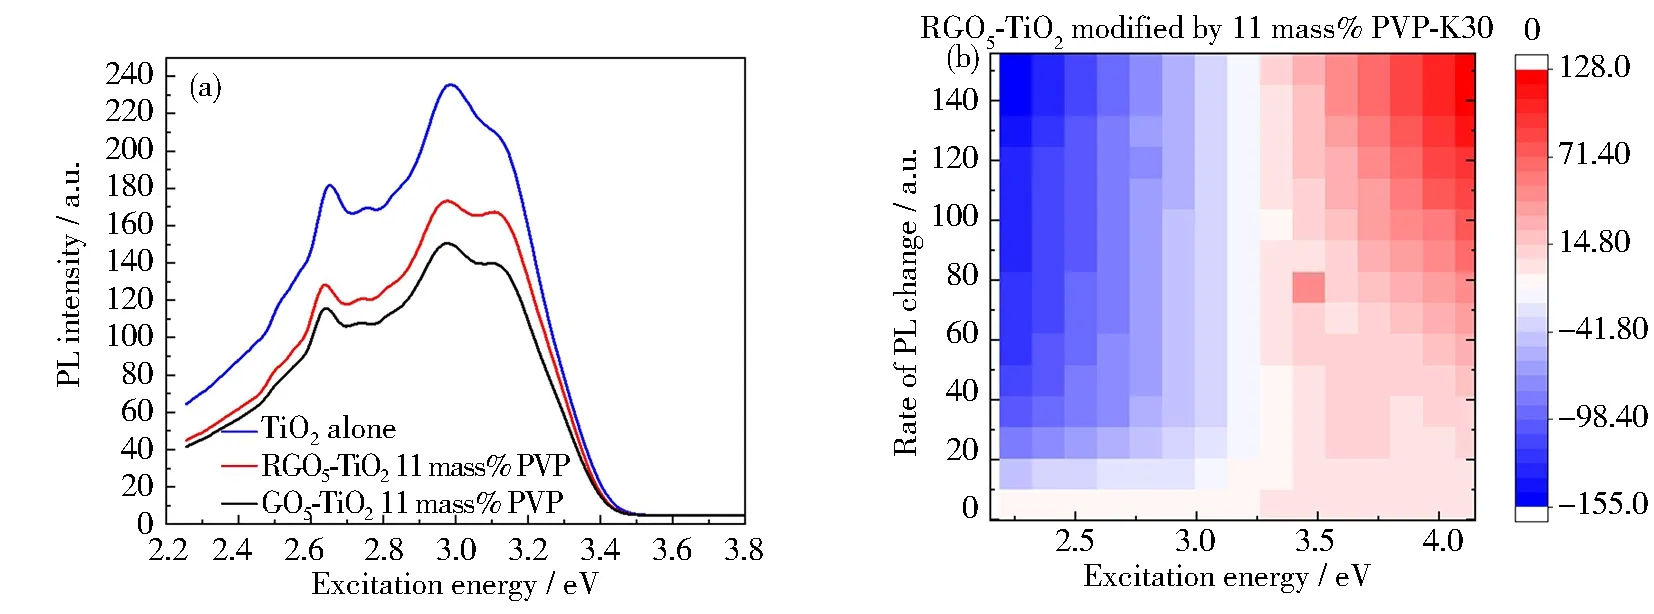
Photoluminescence (PL) spectroscopy was used to study the recombination mechanism, bandgap and defect detection of RGO-TiO2photocatalysts[53]. The comparison of 11.00 mass % PVP-K30 templated RGO5-TiO2, 11.00 mass% PVP-K30 templated GO5-TiO2and pure TiO2(Fig.6(a)) indicates that the broad emission bands are detected in the range of 3.54~2.48 eV (corresponding to 350~500 nm). The anatase TiO2displays three emission lines, where the blue PL intensity centers at 2.658 eV, while the violet PL peak splits into two emissions with intensity centered at 3.139 and 3.003 eV, hence hereafter named as “B-PL” and “V-PL”, respectively. The aggregation-caused quenching (ACQ) of TiO2emission is observed upon the introduction of aromatic graphene and polymeric PVP-K30 (Fig.6(b))[54]. The ACQ rates on blue emission are calculated to be about 33.7% using TiO2alone as a reference. Further analysis indicates PVP-K30 templated RGO5-TiO2shows a slight lowering (3.99%) on peak intensity for both blue and violet emissions, compared with non-templated RGO-TiO2. This insignificant ACQ impact can be attributed to the polarity of PVP templates although it is scarcely detected. On the other hand, the reduction of graphene increases (9.83%) in peak intensity, corresponding to the so-called reverse effect of ACQ, called aggregation-induced emission (AIE)[55]. This observation confirms our hypothesis that the graphene coordinated TiO2catalysts undergo internal energy transitions before relaxing to its ground state by emitting photons. The RGO-coordination resultes in energy dissipation, absorbed energy by TiO2, wherein the emitted light photons are lower than those absorbed TiO2alone catalyst. The PVP templating is found to show a similar impact on the energy dissipation due to its high polarity of this five-numbered lactam polymer.
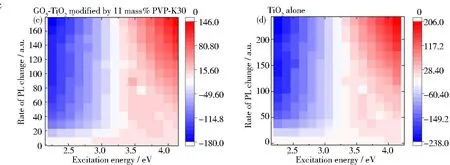
In this study, a specific pathway of recombination mechanism was created due to the synergistic effect of the graphene support and PVP-K30 templating. It has been hypothesized that self-trapped holes located at oxygen atoms in the lattice of the TiO6subunit, while trapped electrons occupying mid-gap states positioned below the Fermi level. As an indicator of the recombination mechanism ofe-andh+, emission intensity was meticulously evaluated[56]. It was found that with the increase of the graphene oxide amount, the intensity of PL was decreased accordingly as demonstrated from our previous work[20]. The PL excitation (PLE) maps of different photocatalysts (Figs.6(b)~6(d)) were obtained by numerical integration of the PL excitation in the energy range of 2.15~4.20 eV. The PLE emission heat maps between three catalysts exhibite similar profiles. The PLE amplitude for the PVP-modified RGO5-TiO2appears to be greater than 3.4 eV, but decreases slightly with an increase in the excitation energy (Fig.6(b)). This can be visualized as a singularity “hot-spot” at coordinates of approximately 3.5~80, suggestive of inter-band transitions with active lattice oxygen atoms nearby, promoting the photocatalysis. Similar analyses for PVP-modified GO5-TiO2show inter-band transitions at coordinates of 3.5~90, but with diminished amplitudes, indicating lesser active defect sites (Fig.6(c)). These data indicate the RGO supported TiO2shows better catalytical performance due to the more efficient electron transfer from TiO2to graphene. Lastly for TiO2alone, the PLE amplitude is found to be smaller at excitation energy above 3.4 eV, suggesting that the catalyst is activated by free charge carriers at onset energy close to its bandgap edge (Fig.6(d)). This PLE heat map relationship is found to be reversed to the bandgap energies (Eg:TiO2> GO5-TiO2-PVP > RGO5-TiO2-PVP), which is a measure of excitation energy near the inter-band transition, lowers the bandgap due to the introduction of graphene oxide and its reduced form. The PL intensity decrease is correlated to the decrease in the probability of recombination ofe-andh+, further prolonging carrier lifetime due to the formation of RGOx-TiO2-PVP triple phases. The peak wavelength is found to have no changes with RGO introduction at a higher amount of 6 mass%. It has been demonstrated that electrons can exist in conduction band for more than several hundreds of nanoseconds (240 ns), while holes rapidly decrease within a few nanoseconds (48 ns) that has been similarly reported by Yang et al[57]. The long electron life span is related to the high photoactivity. Because the mobility of electrons is much larger than that of holes in anatase TiO2as reported by Yamada et al[58].

Fig.6 Photoluminescence spectra of photocatalysts: (a) full PL spectra of three catalysts, PVP-K30 templated GO5-TiO2, RGO5-TiO2, and TiO2 alone; (b~d) heat mapping of three photocatalysts to demonstrate the differences of excitation energy; (e) enlarged PL blue PL intensity centered at 2.658 eV; (f) enlarged PL split violet PL intensity centered at 3.139 and 3.003 eV, respectively
The RGO coordination resultes in the slight red-shift (3 nm) to 471 nm from 468 nm of TiO2alone catalyst, suggesting TiO2lattice contraction in alignment with XRD data. Although the FWHM study indicates that the TiO2shows the largest peak broadening by 68 meV (Table 2), the particle sizes of the graphene coordinated and PVP templated TiO2catalysts are found decreased essentially. This decrease in particle size is also correlated to the peak broadening as shown in Figs.6(e) and 6(f). The B-PL and V-PL peaks were determined by two-carrier recombination of photoexcited electrons and holes. The peak-broadening indicates the prolonged recombination time and extended lifetime of the electrons, holes and excitons.
From the above analyses, it can be concluded that both procedures of PVP templating and UV-assisted reduction are found to result in observable peak intensity decrease, but negligible peak shift. Table 2 summarizes the structures and PL properties of three selected catalysts. It indicates the aromaticity of graphene and polarity of polymer collectively affects the electron delocalization within the well-maintained crystalline and morphological structures[59]and further extending the lifetime of charge carriers.
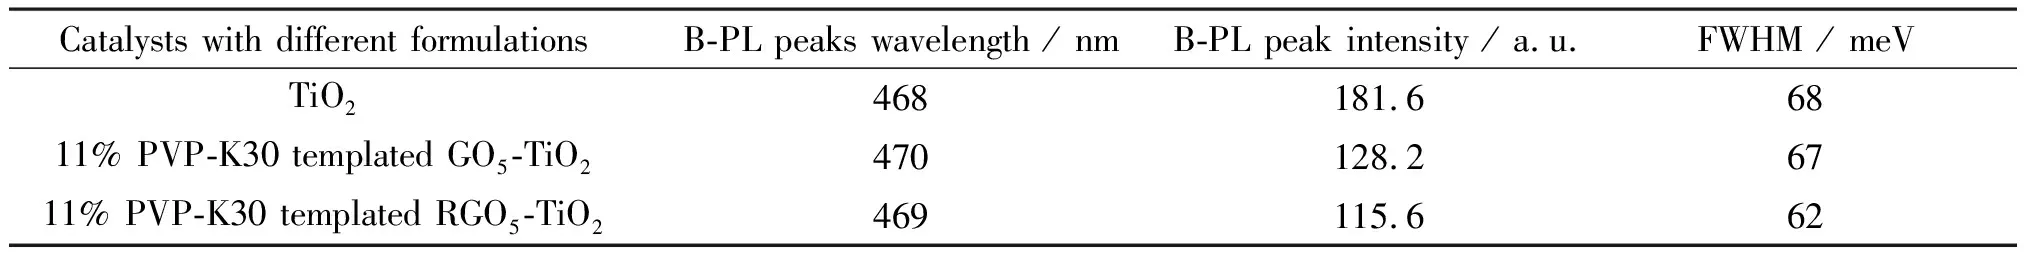
Table 2 PL characteristics and structures of photocatalysts
2.2.3 UV-Vis diffuse reflectance analyses to determine band structure
The UV-Vis diffuse reflectance spectroscopy (DRS, Fig.7) was used to evaluate the optical bandgap of the PVP-K30 templated RGO5-TiO2, as a complementary method to PL spectroscopy. The results (Fig. 7(a)) indicate that both RGO coordination and PVP templating result in peak intensity decrease, in generalization, owing to a dissipation of the adsorbed energy. This adsorption decrease is also correlated with the observation from B-PL and V-PL, implying that the lifetimes of charge carriers are expanded[60]. The DRS peak boarding is also detected, proving the defect existence and particle size decrease of the RGO5-TiO2. The sharp absorption edge was also obtained, which was used to calculate the band gap of three chosen photocatalysts (Fig. 7(b)). It is found that the band gap is lowered with the introduction of both graphene and PVP-K30. The absorption edge (428.2 nm) of RGO5-TiO2nanocomposite shows red-shift from 417.1 nm (TiO2alone), while the PVP-K30 templated RGO5-TiO2shows further red-shift to 446.8 nm. The corresponding band gap energies (Fig. 7(b), inserted table) are calculated to be 2.97(3), 2.89(6) and 2.77(5) eV for the three photocatalysts, as evidence to achieve high degradation efficiency under wide light sources. These energy data can be attributed to an enhancement of Ti-O-C band upward vibration (bending and stretching), resulting in an effective separation of electrons and holes on the interfaces or along the edges of three components[61]. From the atomic level, this separation can be explained that the electrons from Ti d-orbital or C π electrons can be excited to the high energy orbitals in the visible region, in agreement with published data[62]. During the UV-Vis measurement, the color changes of the RGO5-TiO2catalyst from yellow to grey color are detected, inferring that the adsorption of complementary light (blue and violet regions) occurrs (Fig.7(b), inserted table). The UV-Vis absorption intensity of these chosen catalysts is found to increase in the visible region in the presence of RGO and PVP, while decrease in the ultraviolet region on the contrary. The higher vibrational energies (at violet and blue adsorption region) provide another evidence for the formation of a more stable structure of PVP-K30 templated RGO5-TiO2than RGO5-TiO2and TiO2alone.That is, the RGO coordination and PVP templating allow for the application of photocatalysts to break the antibiotic wastes in widened electromagnetic spectra due to their extra stability.
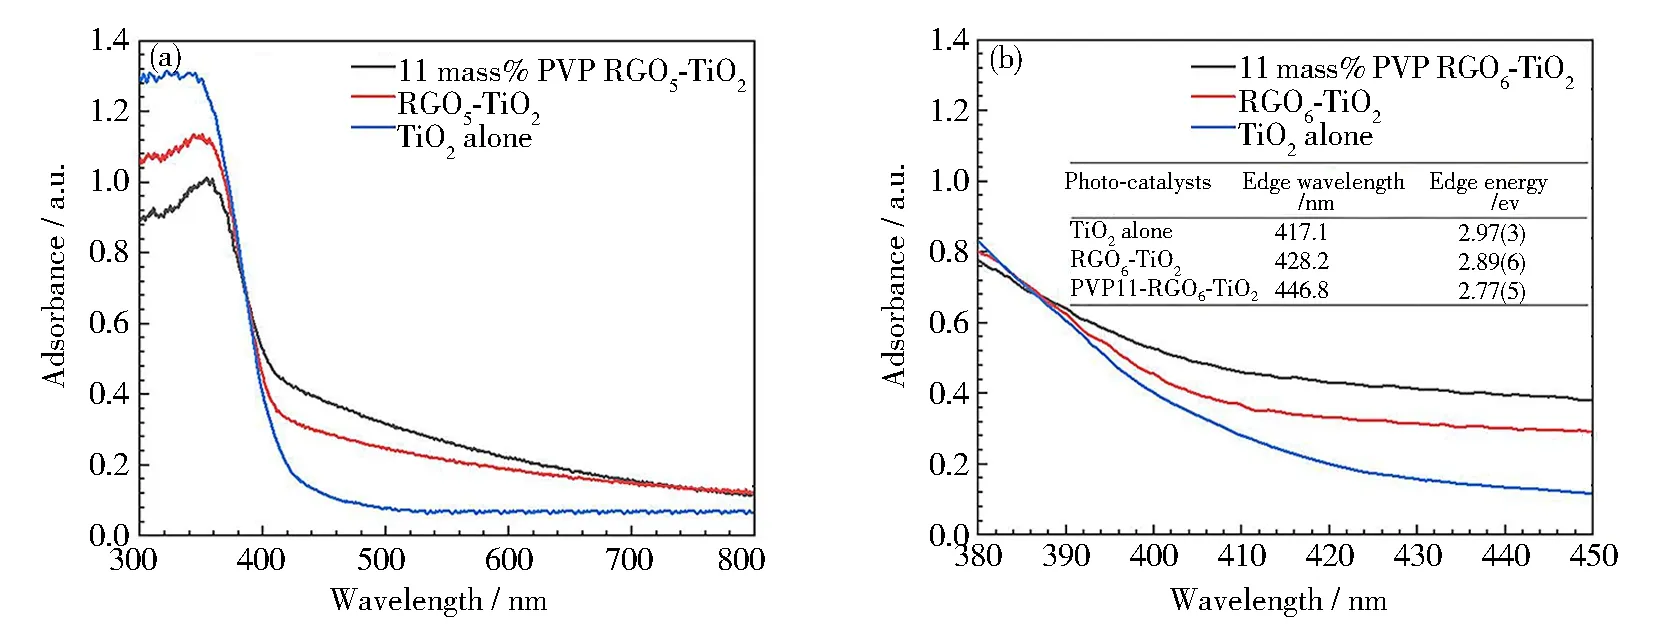
Fig.7 UV-Vis diffuse reflectance spectra of TiO2, RGO5-TiO2 and 11 mass% PVP-K30 templated RGO5-TiO2 photocatalysts: (a) full DRS spectra; (b) estimation of bandgap from the magnified wavelength, corresponding to the Tauc plot
Collectively, the electronic, spectroscopic and isotherm adsorption results suggest that the high absorptivity and degradation efficiencies of the PVP-K30 templated RGO5-TiO2photocatalyst can be explained as follows: firstly, the TiO2maintains the relative integrity of skeleton structure upon RGO coordination and PVP templating. The mesopores and connected pores in the inner of the anatase TiO2can accommodate more absorbates, such as tetracycline antibiotics. Secondly, the high specific surface area and a more porous structure can increase the active adsorption and reaction sites, leading to a fast degradation rate. Moreover, the bandgap energy decrease allows for degradation under simulated sunlight.
2.3 Photocatalytic activity of PVP templated RGO5-TiO2 composites
The degradation efficiencies on an antibiotic tetracycline (TCH) using PVP-K30 templated RGO5-TiO2photocatalysts were evaluated to determine the optimal variable of the pharmaceutical waster treatments (Fig.8). The catalyst composition, light source, pH value, and hardness of wastewater (Ca2+concentration as an indicator) were systematically studied to achieve high efficiency. These optimized compositions and treatment conditions are found: the RGO amount at 5 mass% and PVP-K30 at 11 mass% under both ultraviolet and simulated sunlight radiations. The UV and SS radiations for 120 min result in higher degradation rates than 93.36% and 91.34%, respectively. This research indicates that this newly invented scaling-up sol-gel method provides a feasible platform to produce efficient and effective photocatalysts. The water-soluble and nontoxic PVP-K30 can be used as a mesoporous template to control the pore structure.
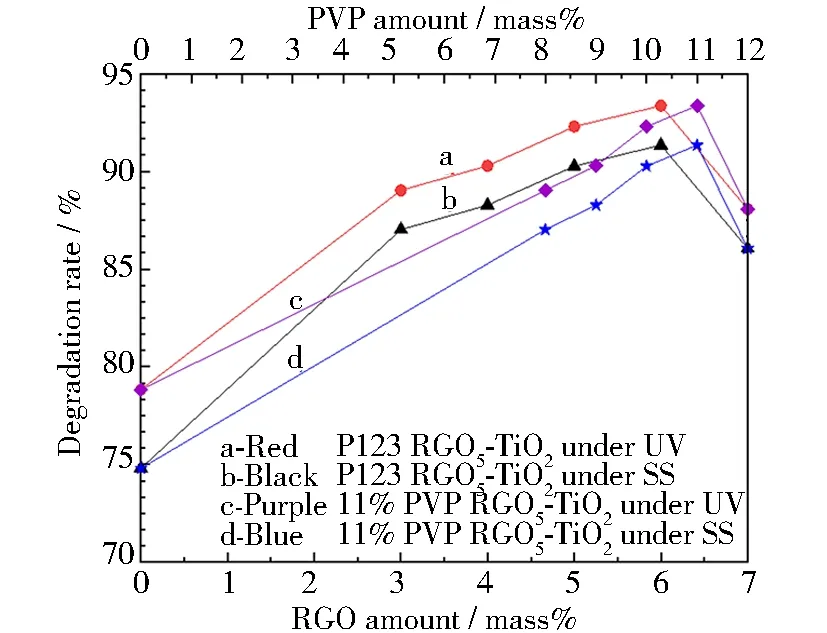
Fig.8 Degradation rate of photocatalysts produced from optimized variables: (a) degradation rate of RGO5-TiO2 catalysts under ultraviolet light; (b) degradation rate of RGO5-TiO2 catalysts under simulated sunlight; (c) degradation rate of PVP-K30 templated RGO5-TiO2 catalysts under ultraviolet light; (d) degradation rate of PVP-K30 templated RGO5-TiO2 catalysts under simulated sunlight
2.3.1 Effect of PVP mass percentage on the TCH degradation efficiency
The degradation rates (α) of TCH using the templated RGO5-TiO2photocatalysts are shown in Fig.9 under both ultraviolet (UV) and simulated sunlight (SS). It can be seen from Figs.9(a) and 9(b), the PVP addition results in theαincreased by 9.8% under both conditions due to the increase in pore size and surface area, compared with RGO5-TiO2. Theαunder UV light (Fig.9(a)) is found to display a higher value (averaged at 3.9%) than that under the SS radiation (Fig.9(b)). The RGO is found to provide “in-situ” riveting sites to guide the TiO2nucleation; simultaneously facilitate the carbon p-orbital and titanium d-orbital hybridization[63]. This electron localization allows for an extended life span of excitons as shown in Fig.6(c) based on the PL study. This study and our previous data are in agreement, indicating band gap energy of TiO2decreases from 3.21 to 2.87 eV, allowing for adsorption of the visible light. Therefore, the RGO5-TiO2photocatalyst can be used in the more moderate visible light conditions. This study agrees with our previous study that the RGO addition results in particle size decrease from (12.5±0.5) nm (TiO2) to (11.0 ± 0.5) nm (RGO-TiO2)[20]. The RGO also allows for immobilization of electrons and then inhibits the recombination of carriers. The optimal mole percent for GO is 6 mass% at which the efficiency reaches the maximum due to the synergistic effect of mesopore structure and active interfaces between TiO2-RGO, TiO2-TCH and RGO-TCH. The graphene plays an important role in providing “riveting sites”, preventing particle growth, improving distribution uniformity, extending carrier recombination, as a result, enhancing the degradation efficiency of tetracycline antibiotics.
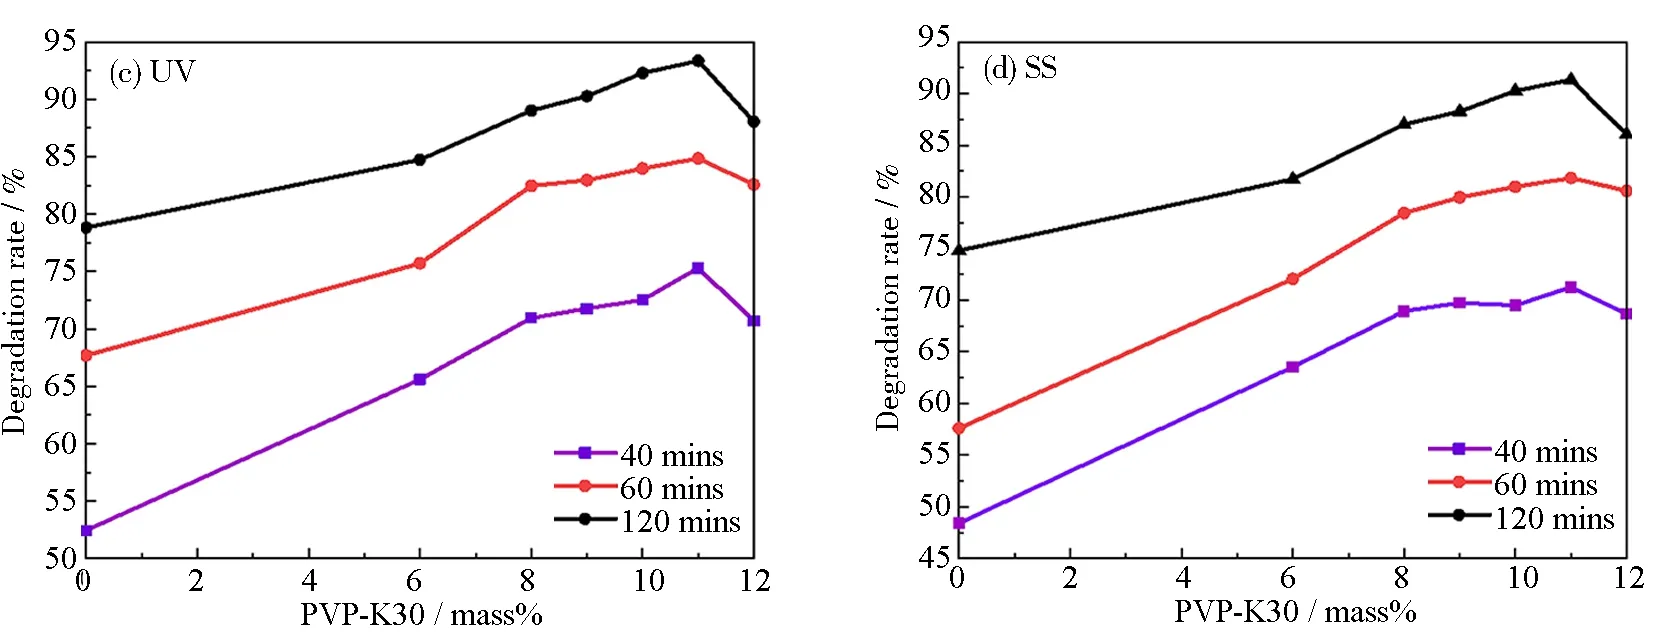
Fig.9 Degradation rate of RGO5-TiO2 and PVP-K30 templated RGO5-TiO2 photocatalysts with different adoption amounts of PVP: (a) degradation rate of catalysts under ultraviolet light; (b) degradation rate of catalysts under simulated sunlight; (c) relationship between degradation efficiency of catalysts and porogen amount under ultraviolet light at chosen treatment duration; (d) relationship between degradation efficiency of catalysts and porogen amount under simulated sunlight at chosen treatment duration
The mesoporous template PVP with hydrophilicity, dispersibility, and cohesivity is another factor to tune the pore structure and surface areas of the RGO5-TiO2photocatalyst, in addition to the RGO coordination. The five-numbered lactam, K30 strand with Guinier length ((5.43±0.01) nm), contour length ((34.31±0.51) nm) was chosen due to its intrinsic natures, such as linearity and easiness to bond with polar bond, O—Ti, while its molar mass averaged at 40 000 g·mol-1to secure the formation of mesopore sizes. Theαas a function of PVP-K30 amount (Figs.9(c) and 9(d)) indicates “volcano” relationship under both UV and SS conditions for different durations of radiation. In the smaller amount regime than 11 mass%, the PVP increase results in anαincrease, while the higher amount of PVP causes aαdecrease on the contrary. Our research discoveries depict that 11 mass% of PVP-K30 templating reaches the maximum degradation of 93.36% and 91.34% under UV and SS conditions, respectively. The high PVP amount at 12 mass% is found to causeαdeduction by approximately 5.29% under both UV and SS radiations, due to its complex refractive index, correlating in a decrease in light usage. This water-soluble PVP templating is found critical not only to tune the pore size and surface areas but also the optoelectronic properties of these RGO5-TiO2photocatalysts, further enhancing the degradation of antibiotics.

2.3.2 Effect of acidity on the TCH degradation efficiency

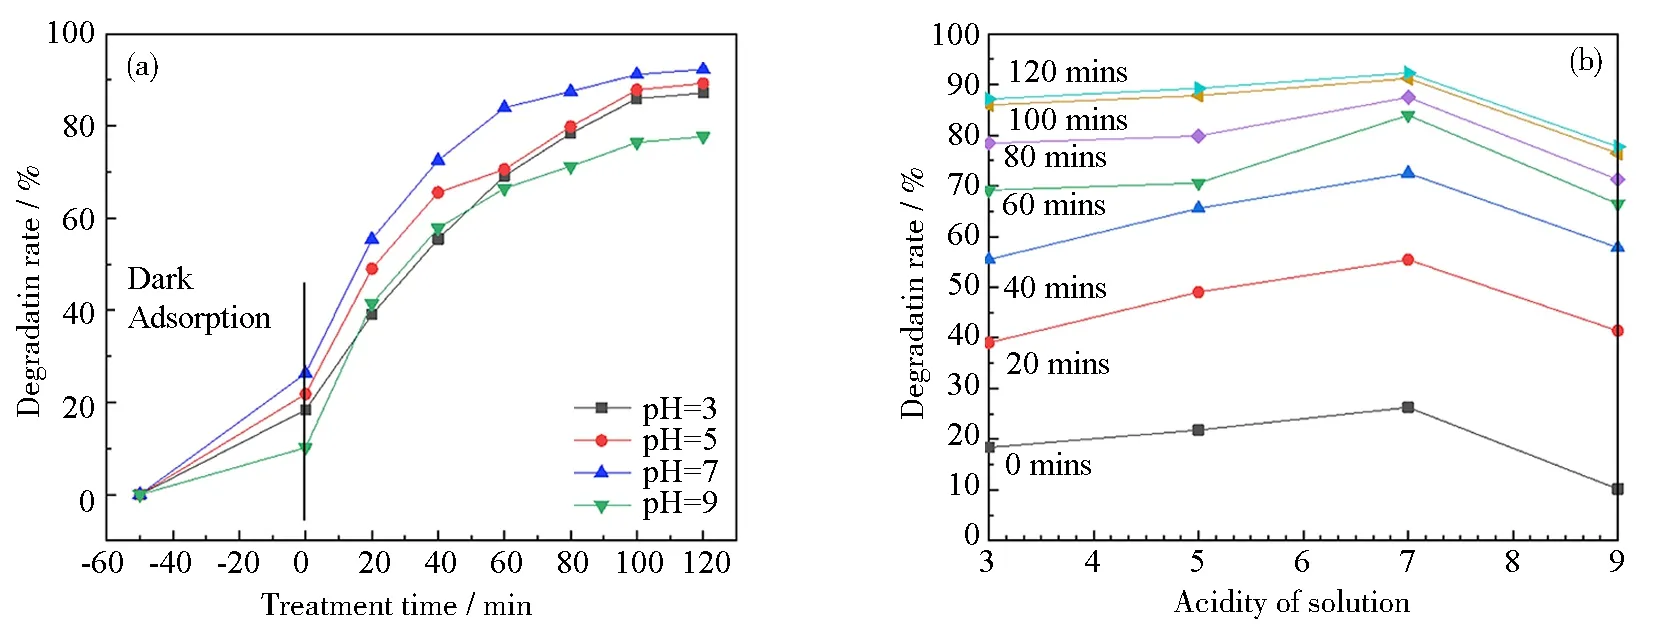

Fig.10 Effect of pH on the degradation rate of 11 mass% PVP-K30 templated RGO5-TiO2 photocatalyst under ultraviolet light: (a) degradation rate of templated RGO5-TiO2; (b) relationship between degradation efficiency and pH for different radiation durations from 0 to 120 min with 20 mins as increments; (c~e) three selected tautomers in different acidities
2.3.3 Effect of Ca2+concentrations on the TCH degradation efficiency

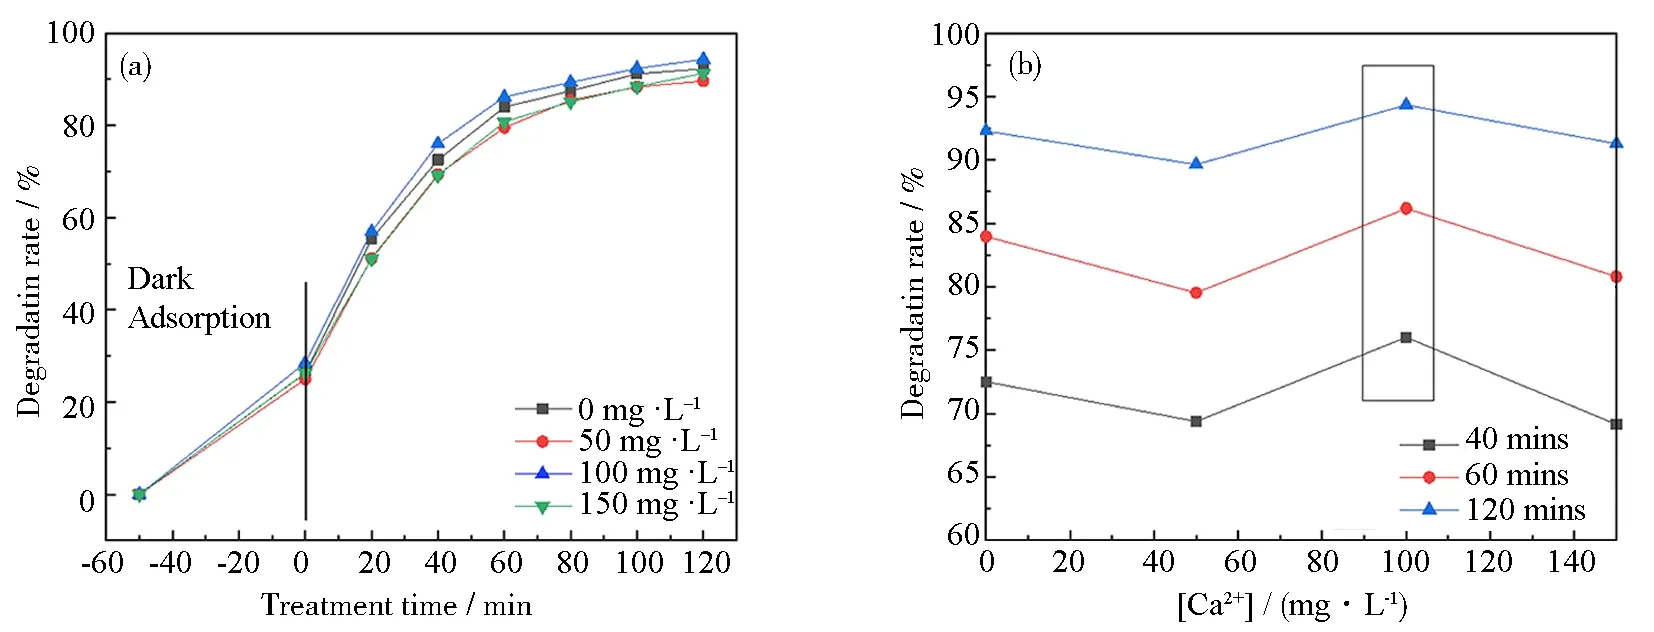


Fig.11 Effect of Ca2+ concentration on the degradation rate of 11 mass% PVP-K30 templated RGO5-TiO2 photocatalyst under simulated sunlight: (a) degradation rate of templated RGO5-TiO2; (b) relationship between degradation efficiency and Ca2+ concentration for the chosen duration of radiation of 20, 40 and 120 mins; (c) hydrated Ca2+ resulted in high spatial hindrance; (d) proposed formula of Ca2+-complexes (a dimer is shown); (e) representative proposed reactions of TCH oxidation
2.4 Innovation of mechanism on photocatalysis
Overview: The presence of graphene and TiO2nanoparticles in the PVP-K30 templated RGO5-TiO2nanocomposite can effectively inhibit the electron-hole pair recombination, which may cause more radical species with strong oxidation capability. The PVP binding agent will assist aqueous dispersion of the RGO5-TiO2system under visible light irradiation, with enhanced TCH degradation relative to other published studies of RGO-Titania systems (Table 3), which indicate that the photodegradation oxidation via the•OH species-based oxidation is not the predominant reaction species during the photocatalytic process. The insertion of K30 linkers will aid photo-induced holes (h+) when the percent degradation is compared under dark and light conditions and varying percent incorporation of PVP-K30 in the RGO5-TiO2system.
2.4.1 Effect of PVP mass percentage on absorptivity of RGO-TiO2


Fig.12 Adsorption of PVP-K30 templated RGO5-TiO2 photocatalysts with different formulations under simulated sunlight: (a) absorptivity of templated RGO5-TiO2; (b) volcano relationship between absorptivity and PVP-K30 amount
2.4.2 Degradation kinetics
The Langmuir-Hinshelwood model (Eq.3) was used to evaluate the kinetics of TCH degradation using RGO5-TiO2photocatalyst under UV and SS conditions by the dynamic fitting analysis. Using the coefficient of determination (COD) as the statistical measure, the potential mechanism was qualified by using best fit linear regression and found the best fit (COD>0.98) to be consistent for a second-order (2nd) reaction mechanism (Fig.13(a)) and a good fit (COD>0.96) for the first-order (1st) reaction mechanism (Fig.13(b)). To validate the reaction kinetics, the 2ndorder (Fig. 13(c)), 1storder (Fig.13(d)) and 0th(data not included) fitting lines on the 11 mass% PVP-K30 modified RGO5-TiO2catalysts were implemented. The kinetic plots confirm that initial TCH concentration affects the degradation rate exponentially to the fourth power from the zeroth order fitting. Therefore, only the 1stand 2ndfittings are compared since both show higher COD than 0.9 dimensionless “unit” with negligible standard error. The correlation factor of the best fitting associated standard error is summarized in Table 3 using RGO5-TiO2and PVP templated RGO5-TiO2as photocatalysts,respectively. The TCH degradation reactions using both catalysts are calculated, using 2ndand 1storder coefficients. Based on the standard error and COD, and literature review of similar kinetic studies, the 2ndorder mechanism was applied for TCH degradation using RGO5-TiO2as electrophilic catalyst. This mechanism is found to be in alignment with the Langmuir-Hinshelwood mechanism to evaluate these adsorbed molecules, undergoing a bimolecular reaction. Based on the 2ndorder mechanism, it is found that the reaction rate constants (L·mol·s-1) for RGO5-TiO2and 11 mass% by PVP-K30 templated RGO5-TiO2are determined to be 3.187×10⁻²and 9.175×10⁻²(L·mol·s-1), respectively. Regardless of the reaction order, the modification using PVP-30 (11 mass%) maximizes the degradation kinetics by more than 30% compared with RGO5-TiO2photocatalyst.

Table 3 Summary of kinetics data for two formulations of catalysts


Fig.13 Degradation kinetics of photocatalysts with two formulations of RGO5-TiO2 and 11 mass% PVP-K30 templated RGO5-TiO2 under UV radiation: (a) the 2nd order mechanism of TCH degradation using two catalysts; (b) The 1st order mechanism of TCH degradation using two catalysts; (c) the 2nd order fitting for RGO5-TiO2 modified by 11 mass% PVP-K30; (d) the 1st order fitting for RGO5-TiO2 modified by 11 mass% PVP-K30
(3)
In Eq.3, the termr0represents the initial reaction rate,C0is the initial concentration of RGO-TiO2photocatalysts. The parameterskris limiting rate constant of reaction at maximum coverage under the given experimental conditions, andKis equilibrium constant for adsorption of the substrate onto the catalyst. The equilibrium constantKwas predicted using Eq.4, via linearizing the Eq.3 (Fig.13(b)).
(4)
In agreement with our previous study[20], the mesoporous structure and inhibition ofe-andh+recombination collectively attribute to this high degradation efficiency. Both wedged and slit mesopores along the particles and pores on the particle surface act as the “molecular reactors” to effectively catalyze the degradation due to an increased amount of adsorbed TCH. Compared with most of the published data, our results indicate that the higher or similar amount of tetracycline (20 ppm) can be degraded under similar conditions with fast reactivity (Table 4).

Table 4 Comparison of the degradation efficiency using TiO2-based photocatalysts
Two features that contribute towards superior photocatalysis are high absorption capability and higher separation efciency of electron-hole pairs. The degradation of TCH over PVP-K30 modified RGO5-TiO2is due to the relative positions of the energy bands of TiO2(2.97 eV), RGO-TiO2(2.77 eV) and PVP RGO5-TiO2(2.89 eV), where photo-generated electrons in the VB of TiO2will transfer to that of CB and holes accumulated on the VB of TiO2to RGO under visible light irradiation. Compared with pure TiO2, the recombination of electron-hole pairs is greatly prohibited due to the electron immobilization by the sp2hybridization of carbon atoms within the graphene structure. The introduction of PVP-K30 can also assist in the separation of electron-hole pairs, resulting in effective charge separation and enhanced photoactivity in the degradation of TCH (Fig.14). The reaction can proceed as following five steps:
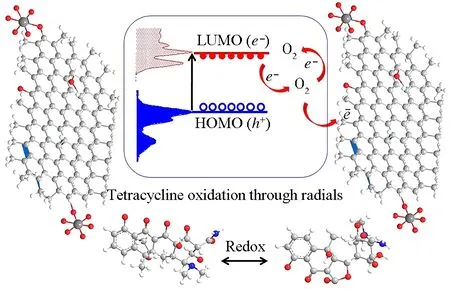
Fig.14 Proposed mechanism for the photocatalytic oxidation of TCH by PVP-K30 templated RGO5-TiO2 under visible light irradiation (HOMO (VB): the highest occupied molecular orbital (valence band); LUMO (CB): the lowest unoccupied molecular orbital (conduction band); e-: electron; h+: hole)
PVP-K30 templated RGO5-TiO2+ hv→e-+h+
(5)
e-+O2→•O2-
(6)
h++ OH-→•OH
(7)
[C22H24N2O8]TCH@C21+e-→•H + [C22H23N2O8]
(8)
[C22H23N2O8] +•OH → [C22H22N2O7]ATCH@C30
(9)
where ATCH is anhydrotetracycline hydrochloride, C-30 is the position of carbon in the cyclic structure and TCH is tetracycline hydrochloride. Also, hydroxylation at C-9 and/or C-21, demethylation at C-4 to form other degradation by-products are likely to occur, as reported[80]. Lastly, isomerization at C-16 to form 4-epitetracycline is also likely to be promoted by the catalyst and has been observed in the literature[81].

3 Conclusions
The coordination of titania (TiO2) by reduced graphene oxide (RGO) yielded a unique nanocomposite (RGO5-TiO2) with well-defined porous polymeric networks, connectivity between interfaces, and accessibility to reactive sites. These chemically active sites initiated the light-assisted electrons and holes generation. Their life spans were extended due to the rapid electron transfer among hydridized 2p orbitals of carbon atoms in the graphene-structure based on spectroscopic analyses. A scaling-up wet-chemistry BOSS method was implemented in the successful fabrication of titania photocatalyst composites with large-area graphene sheets as support. This effort resulted in an improved intrinsic photo-catalytical property of TiO2by 33% compared with TiO2alone when applied for degradation of tetracycline. The RGO5-TiO2porous nanomaterials werein-situmodified using a mesoporous water-soluble polymer, polyvinylpyrrolidone (PVP) to control the internal channel and porosity. The feasible sol-gel synthesis was used to produce different formulations of nanocomposites with high TCH degradation efficiency. The band-gap of the composite was calculated to be 2.86 eV and its pore sizes (4.81 nm) allowed to improve the remediation efficacy. TCH degradation reactions were found to be the first-order and reaction rates to be fastened from 1.206 × 10⁻²to 1.839 × 10⁻²M·s-1when using RGO5-TiO2and PVP-templated RGO5-TiO2nanocomposites, respectively. The degradation efficiency achieved more than 90% with about 8% increase based on a comparison between PVP-K30 templated RGO5-TiO2with RGO5-TiO2. This improvement is mainly due to the increase in pore size and surface area upon porogen templation, and prolonged charge carries life spans.
Author contributions
Dr. LI Cuixia from Lanzhou University of Technology (LUT) conceived this project and oversaw the progress. Two graduate students from LUT, ZHANG Yuhang, and Hu Ruibing conducted the synthesis and characterization under the supervision of Dr. LI Cuixia Dr. LIU Jingbo Louise from Texas A&M University (TAMU)-Kingsville and TAMU Energy Institute wrote the first draft, re-evaluated the raw data, and conducted the Laue analyses. Dr. BASHIR Sajid from TAMU-Kingsville revised the manuscript, plotted graphs of the spectroscopic data, formulated the mechanism, and summarized the previous research on TCH remediation using photocatalysts. All authors proof-read this final version of the manuscript and agreed to submit the manuscript to this distinguished journal.
