Meso-scale corrosion expansion cracking of ribbed reinforced concrete based on a 3D random aggregate model*
2021-11-21ZhiqiangZHANGYonglongLIXingyuZHUXinhuaLIU
Zhi-qiang ZHANG, Yong-long LI, Xing-yu ZHU, Xin-hua LIU
Meso-scale corrosion expansion cracking of ribbed reinforced concrete based on a 3D random aggregate model*
Zhi-qiang ZHANG†1,2, Yong-long LI1,2, Xing-yu ZHU1,2, Xin-hua LIU1,2
School of Civil Engineering, Southwest Jiaotong University, Chengdu 610031, China Key Laboratory of Transportation Tunnel Engineering, Ministry of Education, Southwest Jiaotong University, Chengdu 610031, China †E-mail: clarkchang68@163.com
In reinforced concrete structures, corrosion of the rebar produces 2–6 times more corrosion product than the original material, creating pressure on the surrounding concrete, leading to cracking. The study of corrosion and cracking in reinforced concrete structures is therefore of great importance for enhancing the durability of concrete. Unlike many previous studies, we used ribbed rebar similar to that used commercially and considered the mechanical behavior of the interface transition zone (ITZ) between the aggregate and mortar to simulate the processes of corrosion and cracking of reinforced concrete structures. We explored the failure mode of the interface layer under uniform corrosion and the influence of different factors on the corrosion expansion cracking and the shedding mode of a concrete cover. This was achieved by establishing a three-phase meso-scale model of concrete based on secondary development of ABAQUS, simulating the mechanical behavior of the ITZ using a cohesive element, and establishing a rust expansion cracking model for single and multiple rebars. The results showed that: (1) Under uniform rust expansion, concrete cracks are distributed in a cross pattern with a slightly shorter lower limb. (2) When the corrosion rate is low, the ITZ is not damaged. With an increase in the corrosion rate, the proportion of elements with tensile damage in the ITZ first increases and then decreases. (3) In the case of a single rebar, the larger the cover thickness, the higher the corrosion rate corresponding to ITZ failure, and the arrangement of the rebar has little influence on the ITZ failure mode. (4) In the case of multiple rebars, the concrete cover cracks when the rebar spacing is small, and wedge-shaped spalling occurs when the spacing is large.
Rebar corrosion; 3D meso-scale model; Cohesion model; Interface transition zone; Failure mode
1 Introduction
The product of rebar corrosion is 2–6 times larger than the original material (Samanta et al., 2021) and exerts pressure on the concrete around the rebar. When corrosion has progressed to a certain extent, the concrete cracks, which makes it easier for corrosive substances to enter the concrete, thereby accelerating rebar corrosion.
Many studies have been carried out to address this problem. Tan et al. (2020) presented a succinct review of studies of the durability of calcium sulfoaluminate cement (CSAC) concrete and explained that CSAC concrete protects steel rebar well from corrosion when exposed to a marine tidal zone. Sanz et al. (2013) determined the crack distribution state of concrete under electrified accelerated corrosion by impregnating resin containing fluorescein. They developed an ‘expansive joint elements’ model to simulate the expansion of corrosion products, using cohesive cracks to describe the cracking of concrete. Their numerical simulation and laboratory test results were in good agreement. Qiao et al. (2016) simulated non-uniform corrosion along the length of rebars by setting various sizes of sodium chloride pools on the concrete cover. The influence of non-uniform corrosion and local corrosion on the propagation of concrete rust expansion cracks was then assessed. Šavija et al. (2013) studied concrete cracking caused by pitting and uniform corrosion based on a 2D lattice model. The results showed that pitting corrosion can significantly reduce the cracking pressure compared to uniform corrosion. Amalia et al. (2018) studied the development of cracks on the surface and inside concrete, and the distribution of corrosion products using electrified corrosion tests. The test results showed that the diffusion of corrosion products in cracks affected their propagation. Based on theoretical derivation, Zhang and Su (2020) proposed a model of the corrosion expansion cracking of corner rebars, considering both the corrosion unevenness and the boundary conditions of the concrete cover. This model can be used to determine the corrosion rate of rebars by measuring the width of the bulge and/or crack on the surface of the cover. Wang et al. (2014) proposed a new cover cracking model for rebar corrosion. Then, some experiments were made for comparison with the analytical results and good agreement indicated that the proposed model could be used to predict both the variation of strain fields in structures during the corrosion process and the cover cracking time. Jin et al. (2020) established a 3D meso-scale model of concrete and characterized the mechanical action of corrosion products by applying uneven radial displacement, to study the influence of factors such as the diameter of corner rebars and the thickness of the cover on corrosion expansion cracks. Cheng et al. (2018) put forward a numerical model based on 2D diffusion mechanics to analyze the cracks on concrete covers caused by the uneven corrosion of rebars. They used the model to explore the effects of the rebar spacing, thickness of the cover, rebar diameter, and different rebar arrangements on the pattern and quantity of corrosion expansion cracks. Zhang et al. (2019) tested the corrosion expansion cracking of concrete covers with different current densities. They examined the composition of corrosion products and the distribution of cracks inside and on the surface of specimens using X-ray diffraction technology, intelligent aggregate technology, and digital image correlation methods. Finally, based on a two-stage model, they predicted the critical corrosion rates under different current densities. Otieno et al. (2019) studied the influences of the water–cement ratio and cement types on the corrosion cracking of concrete covers through lab tests. The results showed that, under the same cover thickness, the steel corrosion rate of concrete with a high water–cement ratio was higher when the cover surface had cracked. In addition, the steel corrosion rate of mixed cement concrete cover surface cracks was higher than that of ordinary Portland cement. Wu et al. (2020) developed an algorithm to generate a high aggregate content and established a meso-scale analysis model considering the confining pressure of the concrete. They analyzed and discussed the influence of the confining pressure, size, and spatial distribution of the aggregate, concrete tensile strength, and other factors on corrosion expansion cracks. Yu and Jin (2020) established a 3D diffusion mechanics model of reinforced concrete with transverse cracks based on the extended finite element method. The model considered the influence of the transverse crack angle on corrosion expansion cracks. The results showed that the deflection angle of transverse cracks not only affects the width and length of corrosion expansion cracks, but also determines their locations. Based on a damage-plastic model of concrete, Hu et al. (2020) studied the influence of the thickness–diameter ratio, concrete strength, and other factors on corrosion expansion cracks. They then put forward a fitting formula for the corrosion expansion force based on the calculation results, and verified the accuracy of the formula through comparisons with experimental results. Xu et al. (2020) comprehensively considered the effects of temperature, water, and chloride ions, and studied the influence of the rebar position and arrangement on concrete corrosion expansion cracks using Comsol and ABAQUS software. The results showed that, under the same conditions, the corrosion of corner rebars is greater than that of central rebars, and the arrangement of the rebars has a great influence on the crack patterns. Zhang and Xiong (2020) studied the corner rebars of concrete cube specimens, simulated the whole development of corrosion by applying time-related uneven displacement around the rebars, and explored the effects of different factors on corrosion expansion cracking. Their results showed that the thickness of the cover had the greatest influence on corrosion expansion cracking. Wang et al. (2018) established a three-phase meso-scale model of concrete based on the secondary development of ABAQUS. They simulated the uneven corrosion of rebars with interference fit, analyzed the whole process of cracking from initiation to propagation and penetration of the cover, and discussed the relationships between factors such as aggregate gradation, rebar position, cover thickness, and crack patterns. Yang et al. (2019) performed experiments on corner rebar corrosion under different cover thicknesses. The experimental results showed that the crack width was linearly related to the corrosion rate under the same cover thickness. Through statistical analysis of the experimental data, a relational expression for the corrosion rate, crack width, and cover thickness was proposed.
In summary, in lab experimentation, most scholars have adopted an electrification method to accelerate rebar corrosion and generate concrete corrosion expansion cracks. They obtained information such as the shape and number of cracks through various observation methods, and finally carried out analysis based on the experimental results. In terms of numerical simulation, most scholars have used temperature expansion (Zhang, 2003), interference fit (Wang et al., 2018), and hole displacement (Jin et al., 2020) to simulate corrosion expansion and study the influence of different factors on concrete corrosion expansion cracking.
The above studies considered the effects of several factors such as the rebar spacing, protective layer thickness, concrete material, rebar diameter, and aggregate size on the corrosion expansion cracking of ribbed reinforced concrete by means of experiments or numerical simulations. These studies instigated the development of a complete system for research on the corrosion expansion cracking of ribbed reinforced concrete, laying a solid foundation for subsequent research.
However, the existing numerical simulations have several limitations. The failure modes of the interface transition zone (ITZ) were rarely studied. In addition, most of the research objects were plain round bars (Zhao, 2013), whereas most rebars in general practice are ribbed. Therefore, there was a need for further research on reinforced concrete corrosion expansion.
In this study, a three-phase meso-scale model of concrete was established based on the secondary development of ABAQUS, and the mechanical behavior of the ITZ was simulated using cohesive elements. The failure mode of the interface layer under uniform corrosion was studied by numerical simulation, and the influence of factors such as the cross-sectional arrangement of ribbed bars, rebar spacing, and cover thickness on the corrosion expansion cracking and the shedding mode were explored.
2 Generation of the meso-scale model
A fine view model consisting of mortar, an interface layer, and aggregate was established through secondary development. This differs from the general user-defined material base (Jin et al., 2018; Yang et al., 2020), but uses a reasonable combination of existing materials to make the mechanical behavior of the model more representative of that of actual concrete.
2.1 Generation of single irregular polyhedral aggregate
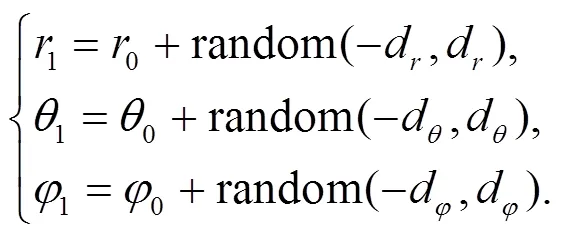
Our process for generating a single aggregate was as follows: firstly, an ellipsoid was generated into a dodecahedron (Fig. 1a), and then the vertex position of each aggregate (0,0,0) randomly fluctuated (Figs. 1b and 1c); the vertex coordinates after fluctuation (1,1,1) are shown in Eq. (1), whered,d, anddare the random variations in length (0) and angle (0,0), respectively.
Unlike previous well-established parameter optimization algorithms (Yin et al., 2018; Jin and Yin, 2020), the problem in this study was a shape parameter optimization problem based on a 3D entity. Trial calculations were performed to avoid the need for a large number of samples and to make this 3D entity closer to the actual aggregate shape.
Through many trial calculations based on our understanding of the parameters, we found that whend=0.5(whereis the shortest axial length of the ellipsoid) andd,d=25°, the aggregate shape generated was close to the actual aggregate shape.
Fig. 1 Random fluctuations of base aggregate and vertices
(a) Base aggregate; (b) Node fluctuating outward; (c) Node fluctuating inward
2.2 Generation and placement of aggregate inventory
In practical engineering, concrete is often used with aggregates with different particle sizes in a certain proportion, which is called gradation. In this study, the gradation commonly used in engineering proposed by Fang et al. (2013) was adopted. After the aggregate gradation was determined, an aggregate inventory was generated according to the flow diagram shown in Fig. 2.
A meso-scale model was established by generating a geometric model directly from a defined grid. The process of aggregate placement is shown in Fig. 3.
To verify the effectiveness of the above aggregate generation and placement method, a placement example was studied. The placement area was a square with side lengths of 150 mm, element sizes of 3 mm, and 125 000 cells in total, and the aggregate was a tertiary mix with 40% content. The total time for the entire aggregate generation and placement was 6638.489 s (the test platform was as follows: CPU: Intel Core i7-8700K @ 3.7 GHz; memory: 32 GB of DDR4 3000 MHz RAM; hard disk: Intel SSD P4510, 2 TB).
An example of the placement is shown in Fig. 4, along with the actual concrete section and the meso-scale model section generated in this study. It can be seen that they have a high degree of similarity, which shows that the methods proposed in this paper for aggregate generation, placement, and meso-scale modeling are highly practicable.
2.3 Generation of the interface transition zone
Cohesive elements in ABAQUS were used to model adhesives between two components, each of which could be deformable or rigid. The cohesive elements can be used to study the adhesion between structures and complex multi-crack propagation, as well as the characterization of interface composite materials. They are useful when simulating the corrosion expansion cracking of ribbed reinforced concrete. Cohesive elements were used to characterize the mechanical properties of the ITZ. Cohesive elements were connected to elements on both sides through shared nodes.
The interface layer element was inserted using HyperMesh and Python. The main steps were as follows: (1) divide the aggregate set and mortar set for the model into which the aggregate inventory is entered; (2) generate a common node between the aggregate and mortar with HyperMesh; (3) use Python to record the information of common nodes, and when all the nodes in a certain plane of the element are common nodes, a cohesive element is inserted in the plane; (4) take the newly generated elements as ITZ sets.
The technique for simulating the corrosion expansion cracking of ribbed reinforced concrete in this way is similar to the discrete element modeling method (Yin et al., 2020; Zhu et al., 2020). However, it differs from the multiscale modeling approach (Zhao et al., 2018; Xiong et al., 2019). The base unit of the model in this study was an element, and there is no other more detailed study on the method of a coupled unit and micromechanical model.
In this calculation model, only a cohesive element needs to be inserted between the aggregate and the mortar. Therefore, its shape is the same as that of the aggregate external surface grid. The generated ITZ is shown in Fig. 5. Thus, the meso-scale model is generated.

Fig. 2 Aggregate inventory generation process
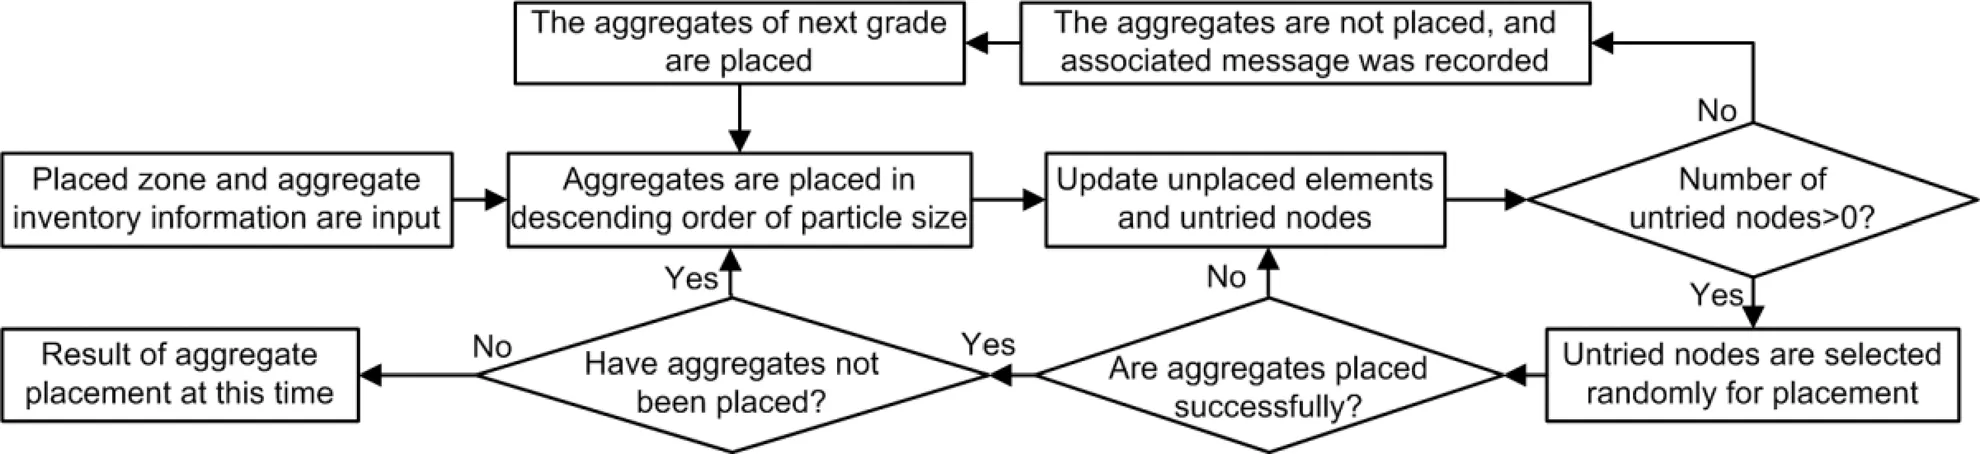
Fig. 3 Aggregate placement process

Fig. 4 Aggregate placement results
(a) Aggregate placement result; (b) Actual concrete cross- section; (c) Cross-section of the generated meso-model

Fig. 5 Aggregate elements (a) and cohesive elements of the interfacial transition zone (b)
3 Material constitutive model and parameter determination
3.1 Mortar constitutive model and parameter determination
The mechanical behavior of mortar was characterized by the JH-2 model proposed by Johnson and Holmquist (1994). Mortar parameters from Lv et al. (2018) were used for calculation (Table 1).
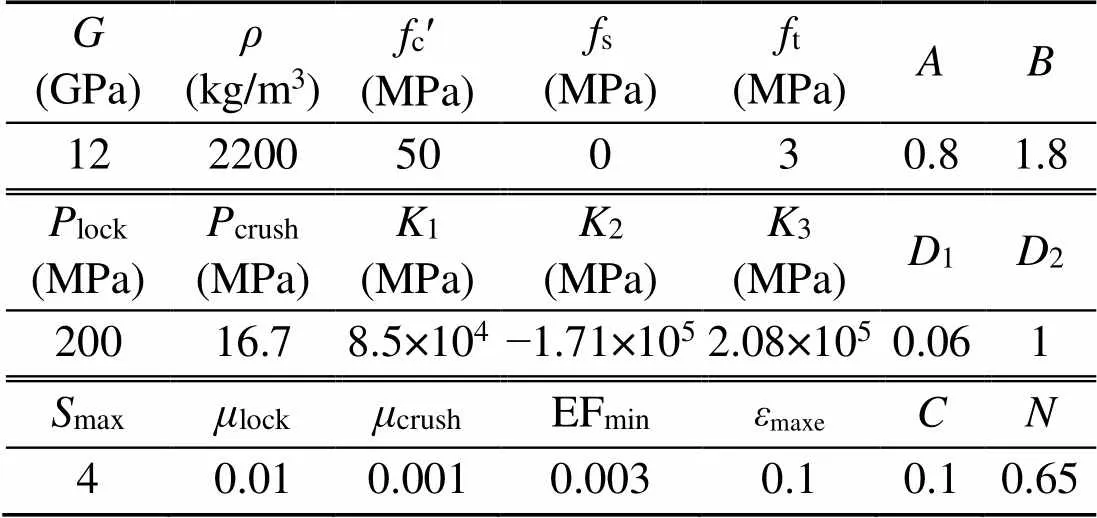
Table 1 Mortar calculation parameters
,,c¢,s, andtare the shear modulus, density, compressive strength, shear strength, and tensile strength of mortar, respectively;crush,lock,crush, andlockare the pressure and volumetric strain when the material is crushed and fully compressed in the uniaxial stress compression test of material, respectively;1,2, and3are constants used for the material with no voids;,,,, andmaxare defined as the normalized cohesive strength, normalized pressure hardening coefficient, pressure hardening exponent, strain rate coefficient, and normalized maximum strength, respectively; EFminis the equivalent plastic strain to fracture the material;maxeis the maximum erosion principal strain;1and2are the damage constants
3.2 Constitutive model and parameter determination of the interface transition zone
The ITZ was characterized by cohesive elements, and the initial cracking criterion adopted the maximum nominal stress criterion (Maxs). In this criterion, when the stress in any one of the three main directions of the material reaches the critical value, the material starts being damaged. That is:

wheren,s, andtare the stresses in the normal and tangential directions, respectively.
After cracking, the bilinear tension–displacement criterion with good convergence was used to characterize the subsequent damage evolution, as shown in Eqs. (3) and (4) and Fig. 6:

In the formulas and figures,is the normal or tangential displacement value,,max,n0,nf, andncare the normal stress, maximum stress, initial and final displacements of cracking, and fracture energy, respectively, and,max,t0,tf, andtcare the corresponding tangential values. The parameters selected for calculation were shown in Table 2.
3.3 Constitutive model and parameter determination for aggregate and rebar
The existing meso-scale concrete research findings show that aggregate generally does not crack (Unger and Eckardt, 2011; Wang et al., 2020; Naderi et al., 2021). In this study, an elastic model was used to characterize the mechanical behavior of aggregate, and the aggregate parameters were selected with reference to Yang et al. (2020). An HRB400 bar was regarded as an ideal elastic–plastic material, and its calculation parameters were selected according to MOHURD (2010) as shown in Table 3.
It is considered that corrosion expansion displacement occurs only in the cross-section of a rebar and that axial displacement can be ignored (Jin et al., 2020). Here, thermal expansion was used to simulate uniform corrosion expansion, and the anisotropic thermal expansion coefficients were defined asα=1.2×10⁻⁵°C−1,α=1.2×10⁻⁵°C−1; the expansion coefficient in the other directions was 0 °C−1.

Fig. 6 Traction–separation relationship of the bilinear tension displacement criterion

Table 2 Interface transition zone calculation parameters
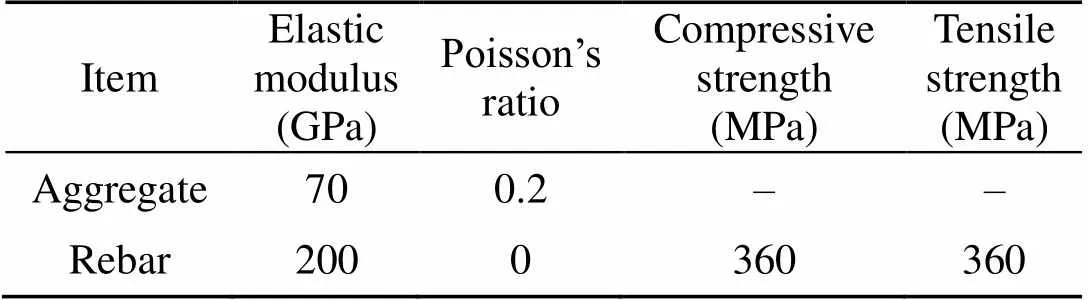
Table 3 Rebarand aggregate parameters
4 Scenario of a single rebar
4.1 Finite element model
In the model, the dimension of the concrete was length×width×height=150 mm×150 mm×150 mm, and the rebar was a ribbed bar with a nominal diameter of 20 mm and a length of 290 mm, whose geometric parameters were determined mainly according to ISO (2015). The established finite element model is shown in Fig. 7.
A schematic diagram of the corroded rebar section is shown in Fig. 8. According to the principle that the temperature expansion area is equal to the corrosion expansion area, the corresponding temperature variation of the rebars under a certain corrosion rate can be calculated.
The calculation formulae of temperature variation ∆is shown in Eqs. (5)–(8). We assumed that the corrosion rate for the rebars developed to.
Herein, the corrosion rateis equal to the cross-sectional loss rate:
The nominal corrosion layer thickness,, is:
whereis the radius of the steel bar. The nominal corrosion layer thickness is (−1) times the corrosion depth, andis a constant Then, the expanded area at the cross-section of rebar is

The linear expansion coefficient of the rebar is=1.2×10⁻⁵°C−1, and when the temperature changes Δ, the expansion area at the cross-section of the rebar is

In this calculation,is taken as 2 (Wang, 2018)the corrosion rate=5%, and=10 mm. Through the above formulae, the solution is Δ=2110.05 °C, i.e. the rebar’s temperature increases from 0 to 2110.05 °C in the simulation. In this study, the predefined field in ABAQUS was used to apply the thermal loading. Recreating the corrosion expansion cracking process of ribbed reinforced concrete by numerical simulation is complicated. To improve the convergence of the numerical simulation, the explicit module in ABAQUS was used for the calculation.
Four different cover thicknesses and five different arrangement modes, totaling 20 working conditions, were set. The thicknesses of the covers were 20, 30, 40, and 50 mm; the arrangement of the rebars is shown in Fig. 9.
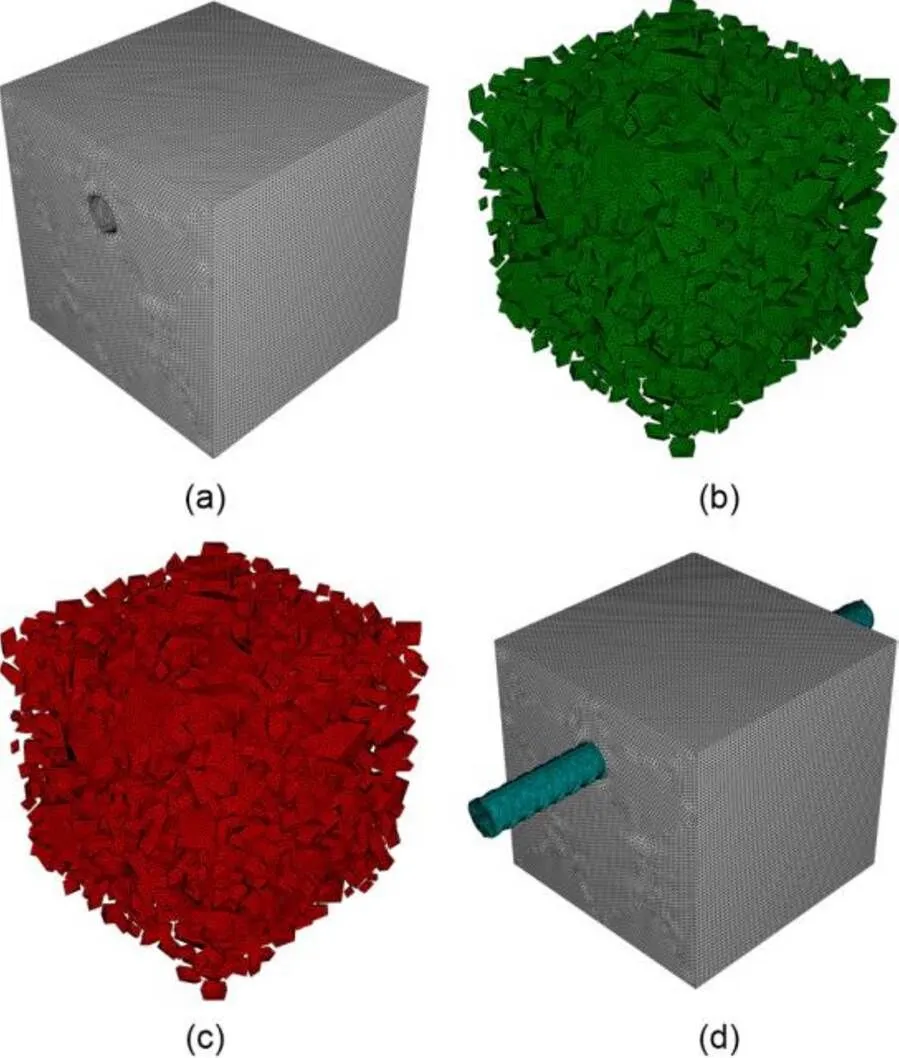
Fig. 7 Finite element numerical model
(a) Mortar elements; (b) Cohesive elements; (c) Aggregate elements; (d) Numerical model
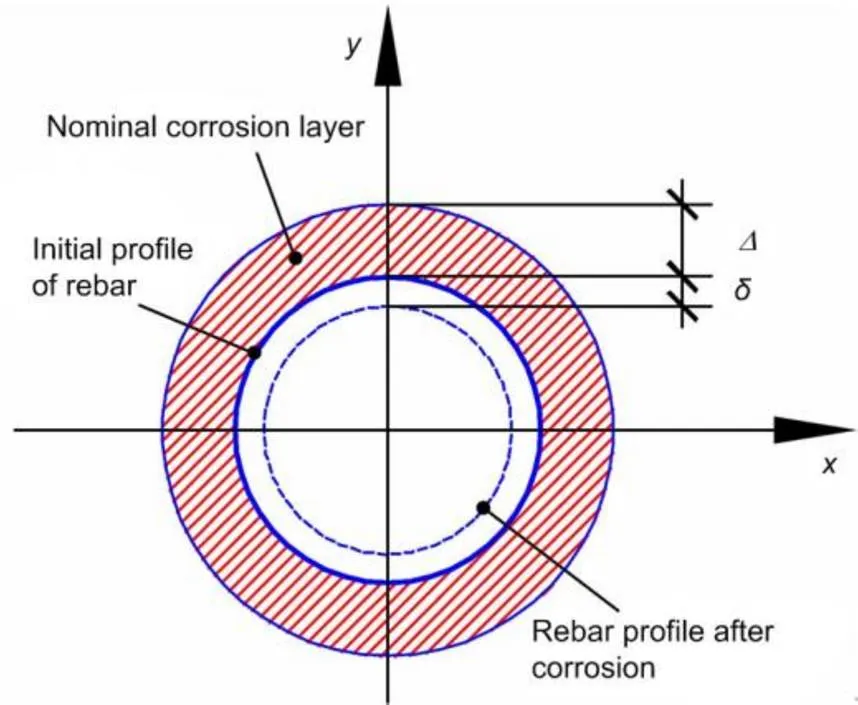
Fig. 8 Section of the corroded rebar
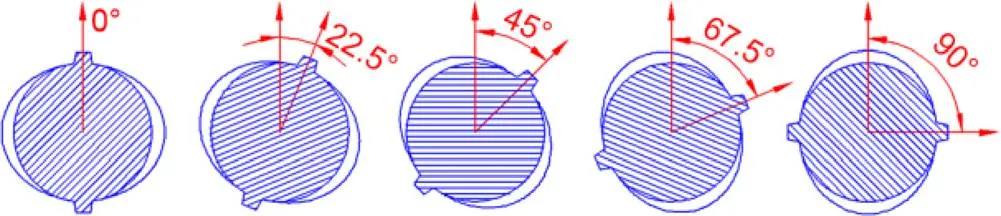
Fig. 9 Arrangement of rebars
4.2 Analysis of corrosion expansion crack pattern and the ITZ failure mode
4.2.1 Patterns of corrosion expansion cracks
Taking a cover thickness of 30 mm and an included angle of 0° as an example, it can be observed that there were four main cracks in the specimen, including two oblique, one vertical under the rebar, and one vertical through the concrete cover. The overall crack pattern was a “cross” with a slightly short lower limb. Our results are in good agreement with the pattern of internal cracks of concrete (Fig. 10) obtained in a lab-based electrifying corrosion experiment conducted by Tran et al. (2011), which verifies the rationality of the numerical simulation performed in this study.
4.2.2 Failure mode and distribution of ITZ
is the overall scalar stiffness degradation variable, which is displayed in the output variable SDEG. Cohesive elements in the ITZ with complete failure (=1.0) are distributed as shown in Fig. 11, concentrated mainly near the cracks penetrating the cover and along two long inclined cracks.
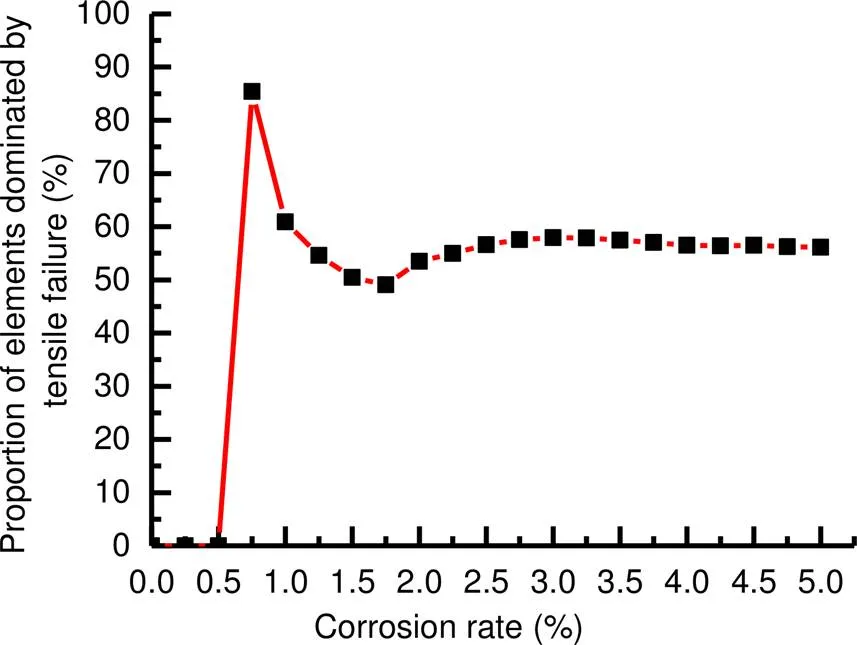
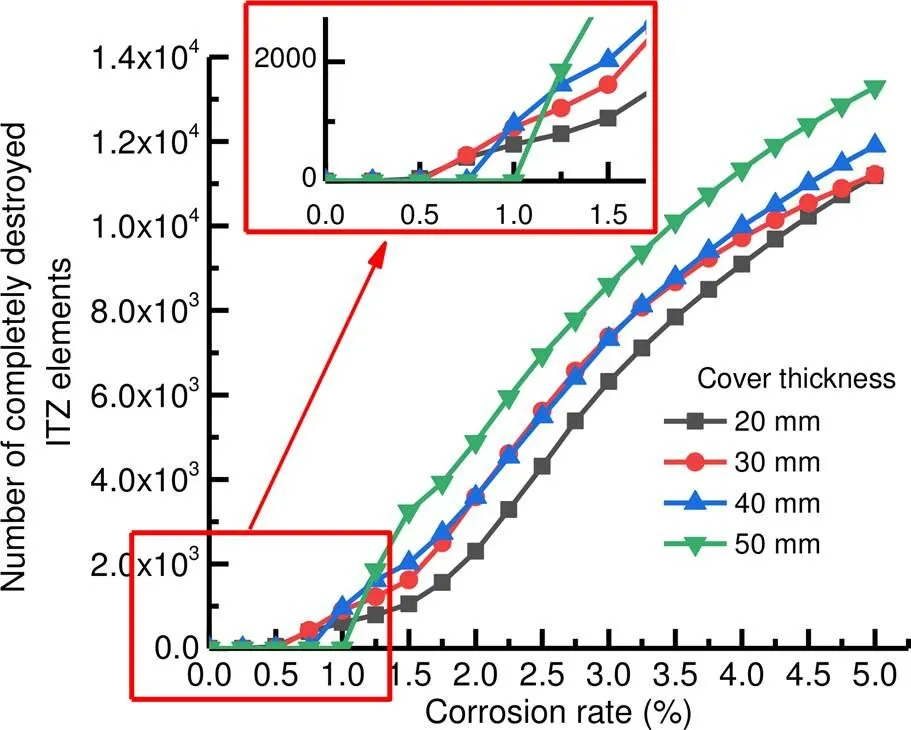
To study the processes of rusting and swelling in ribbed reinforced concrete until the protective layer cracks, the concrete damage pattern was studied for corrosion rates of from 0% to 5%. Fig. 12 shows the relationship between the number of completely damaged ITZ elements and the corrosion rate. When the corrosion rate was low (<0.5%), no ITZ elements were completely destroyed. Beyond that, the number of completely damaged ITZ elements grew rapidly, then finally became generally stable.
There are three basic fracture types for cohesive elements in the ITZ, Types I, II, and III, which correspond to open type, sliding type, and tearing type, respectively (Fig. 13).
Type I (open type) cracks are caused by tensile stress, and so are called tensile failures, whereas Type II (sliding type) and Type III (tearing type) cracks are caused by shear stress, and so are called shear failures. The failure mode identified by the finite element method is determined from the MMIXDMI field output. The relevant calculation formulae are as follows:
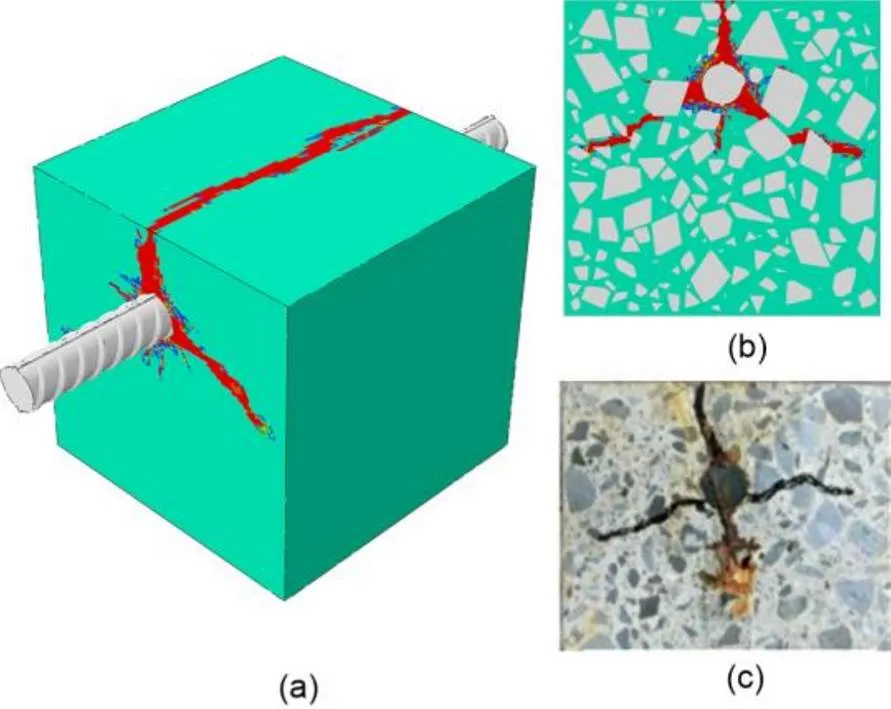
Fig. 10 Comparison of diagrams of numerical simulation and a test result
(a) Surface cracks; (b) Internal cracks; (c) Test result (Tran et al., 2011)
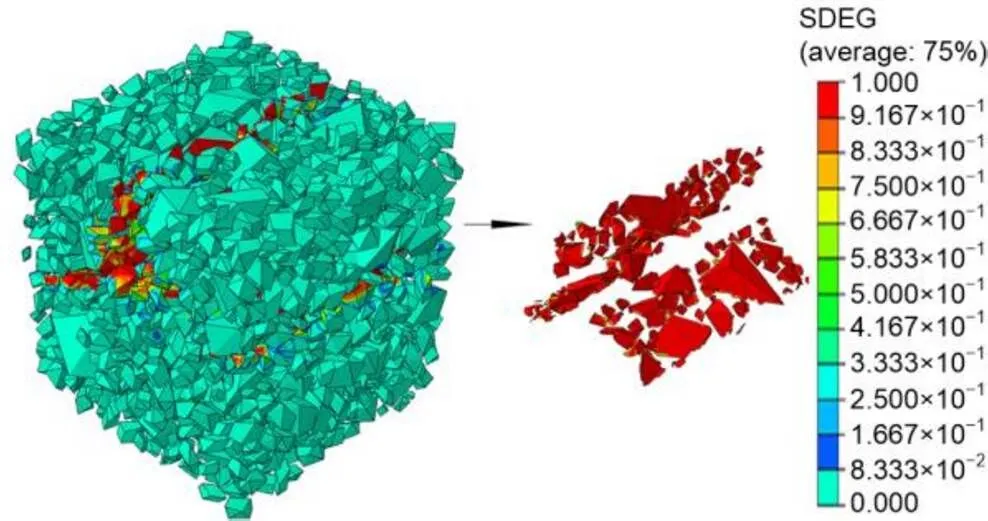
Fig. 11 Completely destroyed ITZ elements (D=1.0)

Fig. 12 Relationship between the number of completely destroyed ITZ elements and the corrosion rate
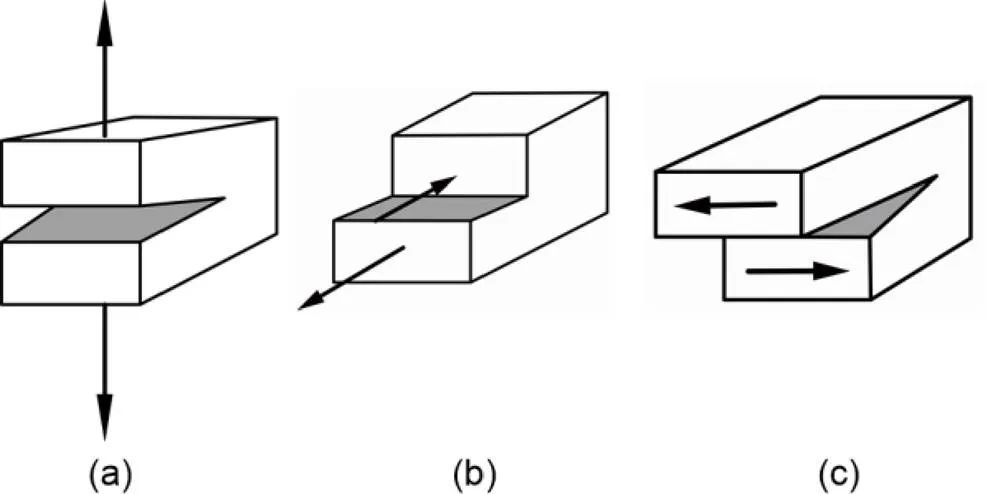
Fig. 13 Fracture types of cohesive elements
(a) Type I (open type); (b) Type II (sliding type); (c) Type III (tearing type)
MMIXDMI=1−1.(9)
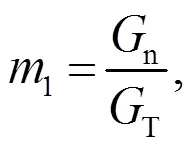
where1is the mode mixing amount,nis the fracture energy of Type I (open type), andTis the sum of the fracture energies of Types I, II, and III.
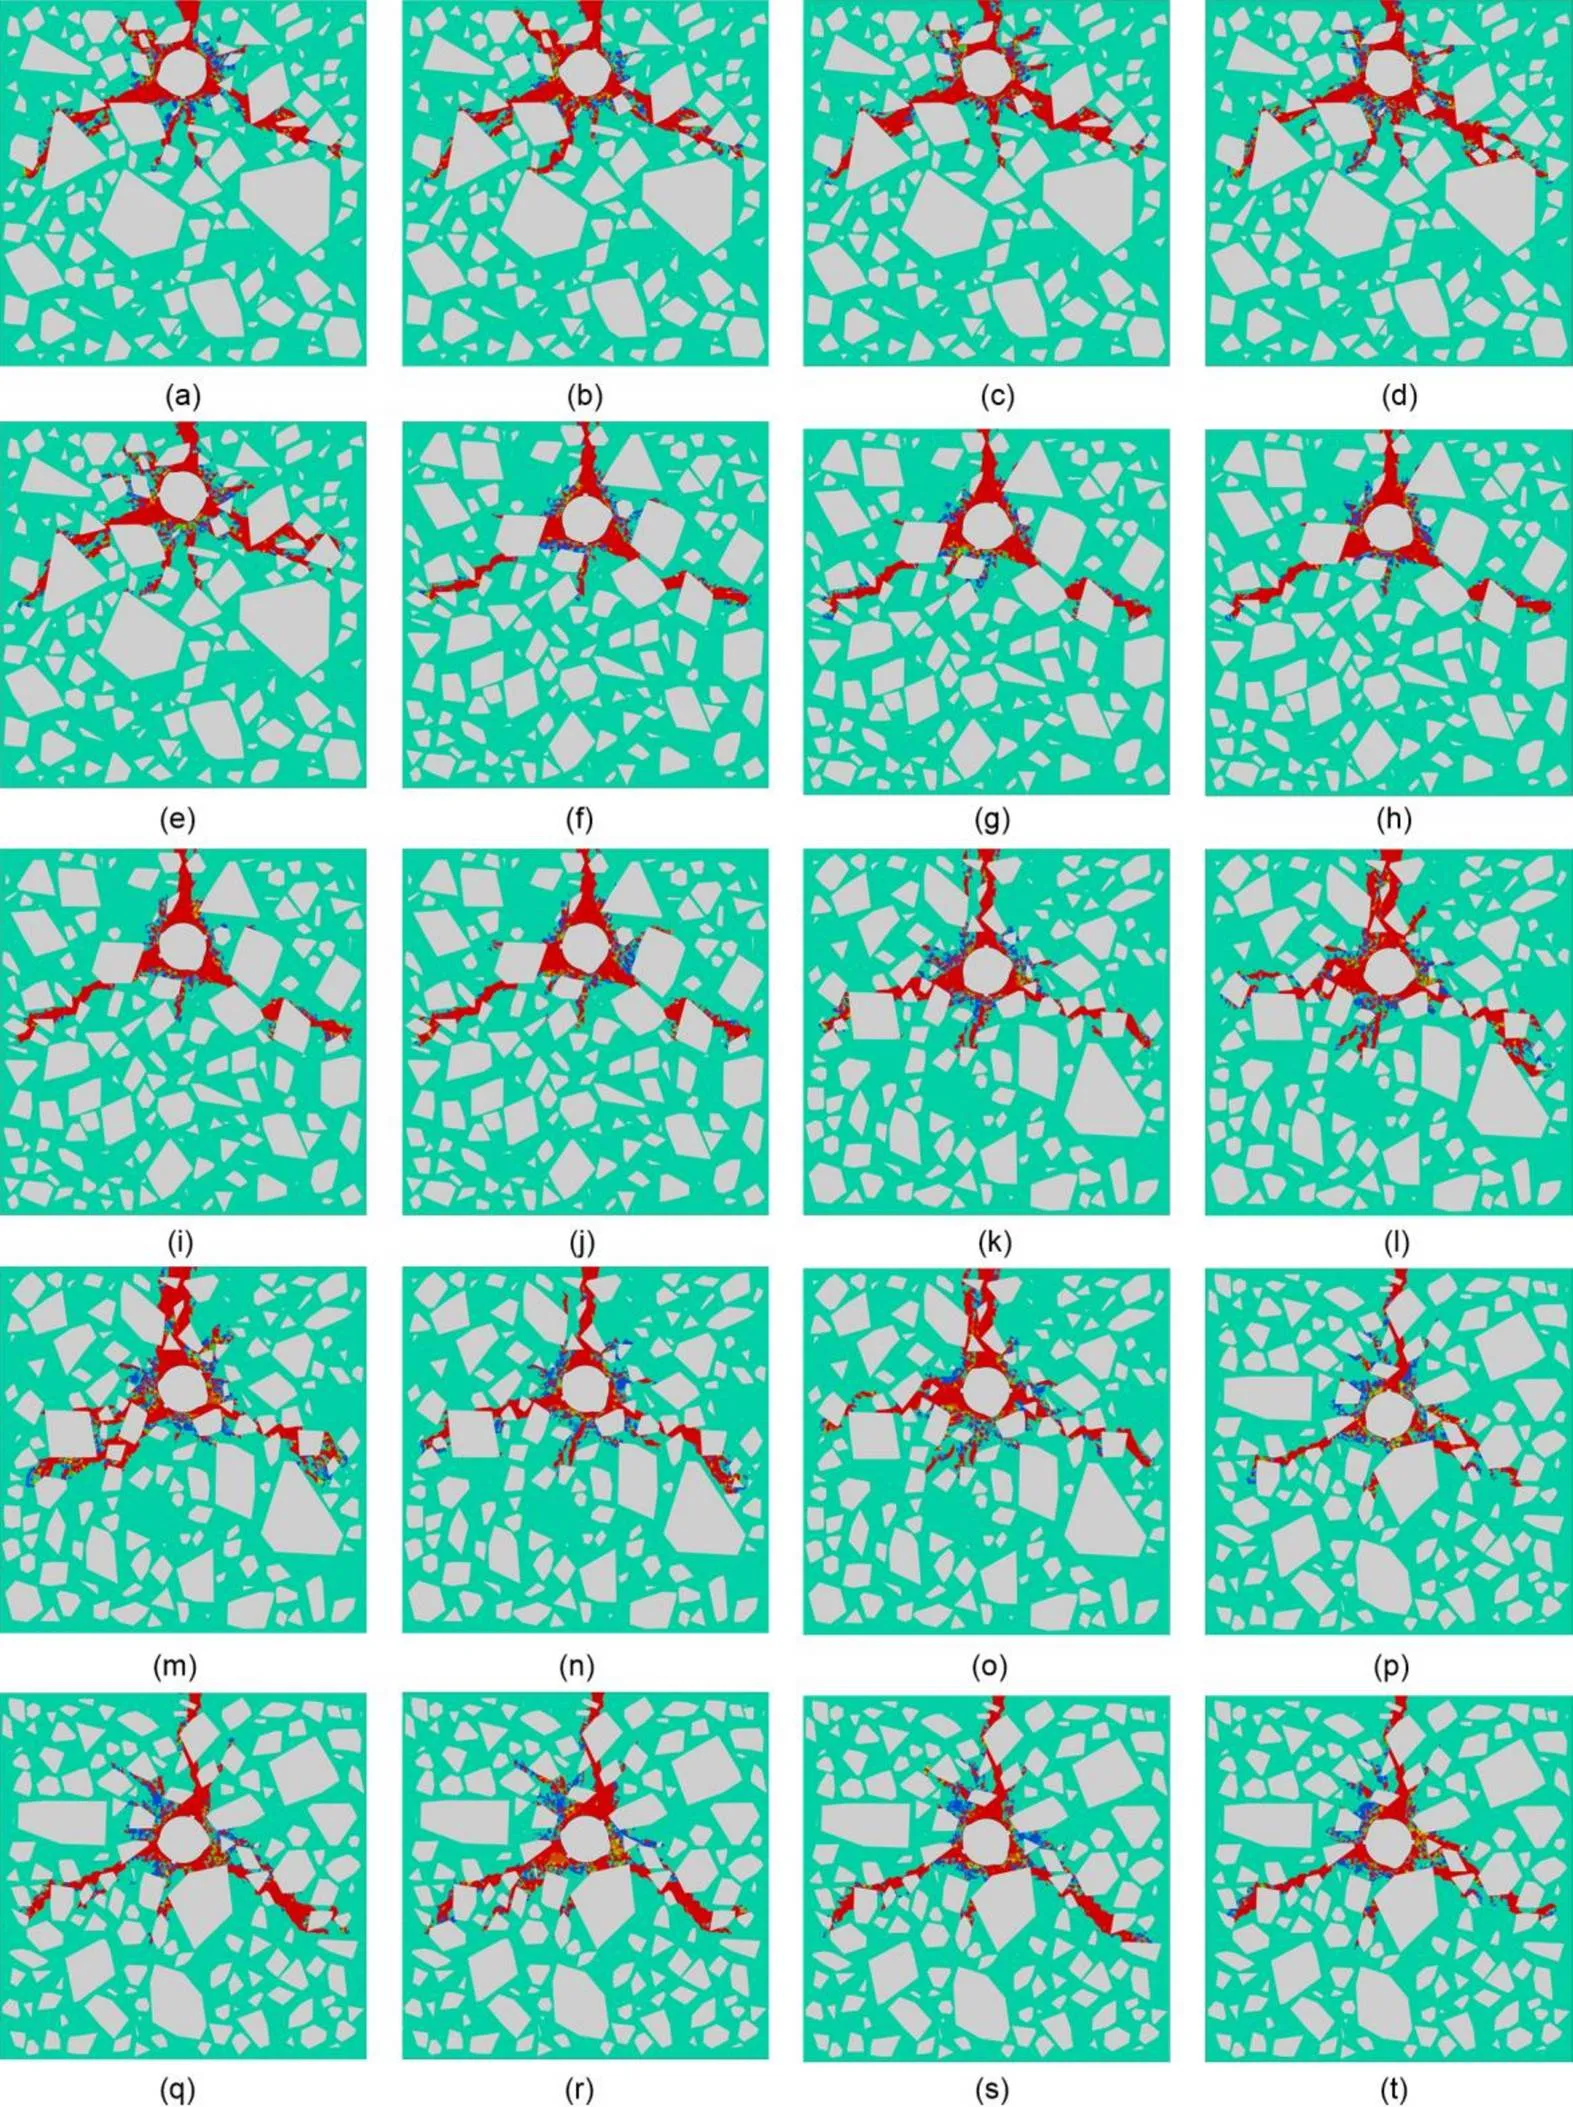
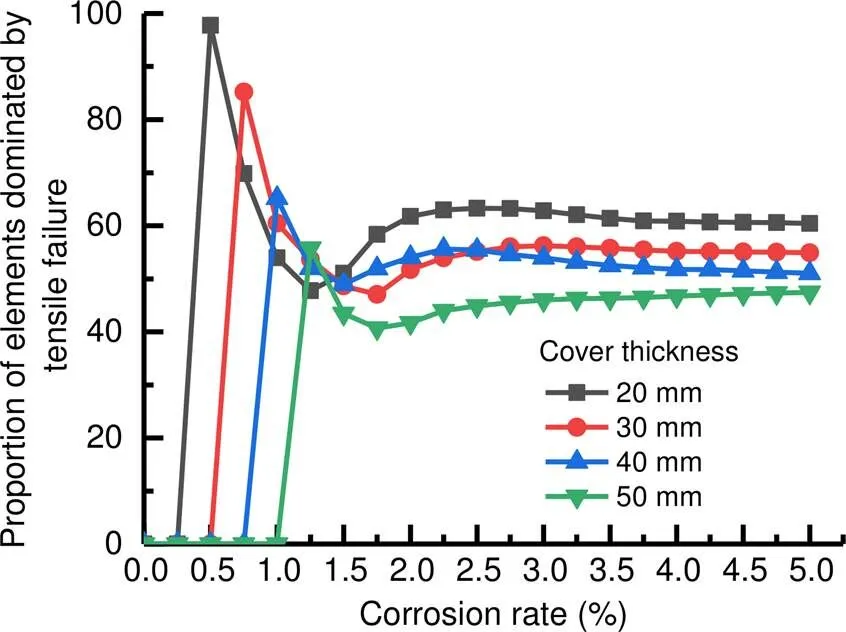
The proportion of the fracture energy of Type I fractures can reflect the type of failure. Therefore, the value of1and MMIXDMI can be used to determine the fracture types of cohesive elements. When1=1.0 and MMIXDMI=0, the failures of the cohesive elements are tensile failures. When1=0 and MMIXDMI=1.0, the failures of cohesive elements are shear failures. When 0<1<1.0, and 0 To more intuitively characterize the change in failure types of ITZ elements in the process of corrosion expansion cracking, the ratio of elements with tensile failure to all completely damaged elements under different corrosion rates was extracted to reflect the change in failure type in corrosion expansion cracking (Fig. 15). When the corrosion rate was low (<0.5%), there were no completely destroyed ITZ elements. Corrosion continued to develop, ITZ elements were gradually damaged, and most were dominated by tensile failure. When the corrosion rate reached 0.75%, the proportion of ITZ elements dominated by tensile failure reached its maximum of 85.4%. After that, the proportion of ITZ elements dominated by tensile failure decreased with the increasing corrosion rate and reached the minimum value of 49.1% at a corrosion rate of 1.75%. With the further development of corrosion, the proportion of ITZ elements dominated by tensile failure slowly increased and finally stabilized, maintaining a value of around 56.2%. Fig. 14 Distribution of tensile and shear failure elements Fig. 15 Relationship between the proportion of tensile failure-dominated elements and the corrosion rate 4.3.1 Influence on crack patterns Fig. 16 shows the crack patterns in specimens with different cover thicknesses and arrangements. Most of the cracks were in the shape of a cross with a slightly shorter lower limb. By comparing the arrangement of rebars at different angles under protective layers of the same thickness, it can be observed that the main internal crack modes were similar. However, there were some differences in the shape and number of secondary cracks. This indicates that the arrangement angle of the cross-section of the rebar has little effect on the main cracks, but some effect on the secondary cracks. When the thickness of the cover increased, the length of cracks penetrating the cover also increased, but the patterns of the main cracks changed little. Fig. 16 Internal crack morphology of specimens under different protective layer thicknesses and respective angles (a) 20 mm, 0°; (b) 20 mm, 22.5°; (c) 20 mm, 45°; (d) 20 mm, 67.5°; (e) 20 mm, 90°; (f) 30 mm, 0°; (g) 30 mm, 22.5°; (h) 30 mm, 45°; (i) 30 mm, 67.5°; (j) 30 mm, 90°; (k) 40 mm, 0°; (l) 40 mm, 22.5°; (m) 40 mm, 45°; (n) 40 mm, 67.5°; (o) 40 mm, 90°; (p) 50 mm, 0°; (q) 50 mm, 22.5°; (r) 50 mm, 45°; (s) 50 mm, 67.5°; (t) 50 mm, 90° 4.3.2 Influence on the ITZ failure mode The relationship between the proportion of elements with tensile-dominated failure and the corrosion rate under different cover thicknesses and cross-section arrangements of rebars was obtained (Fig. 17). The proportions of ITZ elements dominated by tensile failure among the specimens with the same cover thickness and different arrangements differed slightly. Therefore, we conclude that the cross-section arrangement of rebars had little influence on the ITZ failure mode. Fig. 17 Relationship between the proportion of tensile failure-dominated elements and corrosion rate (a) The thickness of the cover is 20 mm; (b) The thickness of the protective layer is 30 mm; (c) The thickness of the protective layer is 40 mm; (d) The thickness of the protective layer is 50 mm Fig. 18 shows the relationship between the number of completely destroyed ITZ elements (the average value for all the specimens with the same cover thickness) under each cover thickness and the corrosion rate. With increasing cover thickness, the corrosion rate of ITZ elements completely destroyed for the first time also increased, which shows that an increase in the cover thickness can delay the occurrence of cracks to a certain extent. In addition, the greater the cover thickness, the greater the number of ITZ elements that were completely destroyed for the first time. Fig. 19 shows the relationship between the proportion of elements with tensile-dominated failure under each cover thickness and corrosion rate. With increasing cover thickness, the peak proportion of elements with tensile-dominated failure decreased,and the greater the cover thickness, the greater the corrosion rate when the peak proportion was reached. The curves for different cover thicknesses tended to stabilize, and the greater the cover thickness, the smaller the stable proportion of elements with tensile-dominated failure. 群落的垂直结构是群落在空间上的垂直分化,反映树种在群落中的分层结构[10]。百米林带中乔灌草型与乔灌型所占比例最高,分别占35%和34%,其次为单层型(17%)、乔草型(13%)、灌草型(1%),其中单层型群落占了不小比例,多为纯林地。反映出了百米林带生态防护的最初定位,建设初期追求快速成林,并没有过多考虑复层型结构模式。 Fig. 20 shows the finite element models. Four rebars were arranged side by side at center distance, with a cover thickness of 30 mm. The width and height of the concrete and the rebar diameter were the same as those of the single rebar. Five different rebar spacings were set from 60 to 220 mm, at intervals of 40 mm. Fig. 18 Relationship between the number of completely destroyed ITZ elements and the corrosion rates under different cover thicknesses Fig. 19 Relationship between the proportion of tensile failure-dominated elements and the corrosion rate under different cover thicknesses Fig. 20 Finite element numerical model (a) Mortar elements; (b) ITZ elements; (c) Aggregate elements; (d) Numerical model 5.2.1 Influence of rebar spacing on patterns of surface corrosion expansion cracks The surface cracks of specimens with different rebar spacings are shown in Fig. 21. According to the patterns and positions, the cracks can be divided into parallel cracks on the parallel plane of the axis of the rebar, and vertical, horizontal, and oblique cracks on the vertical plane of the axis of the rebar. In the case of a small rebar spacing, the cracks in the vertical plane of the axes of the rebars were generally distributed horizontally, except for the vertical cracks penetrating the covers. In the case of a large rebar spacing, except for the above-mentioned vertical cracks penetrating the cover, the remaining cracks on the vertical plane of the axis of the rebars were generally distributed obliquely to the surface of the cover. Due to the random distribution of aggregates and the influence of rebar spacing, some of the rebar locations did not have corresponding cracks parallel to the rebars. 5.2.2 Influence of rebar spacing on patterns of internal corrosion expansion cracks Fig. 22 shows the patterns of corrosion expansion cracks in the specimens. There were obvious differences in the patterns of cracks between the corner and the middle. Fig. 21 Specimen surface corrosion expansion crack patterns (a) Rebar spacing: 60 mm; (b) Rebar spacing: 100 mm; (c) Rebar spacing: 140 mm; (d) Rebar spacing: 180 mm; (e) Rebar spacing: 220 mm Fig. 22 Patterns of corrosion expansion cracks in the specimens (a) Rebar spacing: 60 mm; (b) Rebar spacing: 100 mm; (c) Rebar spacing: 140 mm; (e) Rebar spacing: 180 mm; (e) Rebar spacing: 220 mm Fig. 23 Forms of peeling of the concrete protective layer (a) Spalling caused by horizontal crack penetration; (b) Peeling caused by diagonal crack penetration; (c) Spalling (Wang, 2018); (d) Wedge-shaped peeling (Wang, 2018). Reprinted from (Wang, 2018), Copyright 2018, with permission from Southwest Jiaotong University In the case of a small rebar spacing, there were three main cracks in the corner: vertical cracks penetrating the cover, horizontal cracks connected with the middle cracks, and oblique cracks developing towards the side cover. In contrast, the middle part included only two horizontal cracks connected with the corner cracks. In the case of a large rebar spacing, there were four main cracks in the corner: vertical cracks penetrating the cover, horizontal cracks penetrating the side cover, oblique cracks developing towards the side cover, and oblique cracks developing towards the top cover. The middle part showed mainly three cracks distributed in an inverted T-shape. In this study, a meso-scale analysis model was established through the secondary development of ABAQUS, which reproduces the whole process of the initiation and development of concrete cracks under corrosion. The effects of the cross-section arrangements of rebars, rebar spacing, cover thickness, and other factors on corrosion expansion cracks were studied, as were the failure modes of the interface layer under the condition of a single rebar and the shedding mode of the concrete cover under multiple rebars. The main conclusions are as follows: 1. A line of thought for generating and placing a single, irregular, dodecahedral aggregate and corresponding aggregate inventory based on an ellipsoid is put forward. On this basis, the secondary development was conducted in ABAQUS, and a meso-scale modeling method was constructed for directly generating 3D solids based on a defined grid. 2. The overall pattern of cracks caused by corrosion expansion cracking of rebars was cross-shaped, with a slightly shorter lower limb. 3. No ITZ elements were completely destroyed when the corrosion rate was low. As corrosion continued to develop, complete destruction of ITZ elements occurred gradually, and most ITZ elements were dominated by tensile failure. After that, the proportion of ITZ elements dominated by tensile failure decreased with an increase in the corrosion rate and reached the minimum value. With a further increase in the corrosion rate, the proportion of ITZ elements dominated by tensile failure slowly increased and finally exhibited a stable trend. 4. In the case of a single rebar, the cross-sectional arrangement of rebars had little influence on the patterns of corrosion expansion cracks and ITZ failure modes. With an increase in the cover thickness, the corrosion rate for ITZ elements that were completely destroyed for the first time also increased, which shows that increasing the cover thickness can delay the occurrence of cracks to a certain extent. 5. In the case of multiple rebars, when the rebar spacing was small, the horizontal cracks and oblique cracks between rebars were connected, and horizontally penetrated the whole cover, causing it to peel off. In the case of a large rebar spacing, the cracks between rebars did not penetrate through, but oblique cracks on both sides of the rebars penetrated the cover, causing the part of the cover between the two oblique cracks to fall off. The detached part was larger at the top than at the bottom, and so this process was called “wedge-shaped peeling”. Zhi-qiang ZHANG designed the research. Zhi-qiang ZHANG and Yong-long LI wrote the first draft of the manuscript. Xing-yu ZHU processed the corresponding data and completed the visualization of data. Xin-hua LIU realized the secondary development of ABAQUS and organized the manuscript. Zhi-qiang ZHANG revised and edited the final version. Zhi-qiang ZHANG, Yong-long LI, Xing-yu ZHU, and Xin-hua LIU declare that they have no conflict of interest. Amalia Z, Qiao D, Nakamura H, et al., 2018. Development of simulation method of concrete cracking behavior and corrosion products movement due to rebar corrosion., 190:560-572. https://doi.org/10.1016/j.conbuildmat.2018.09.100 Cheng XD, Su QZ, Ma FL, et al., 2018. Investigation on crack propagation of concrete cover induced by non-uniform corrosion of multiple rebars., 201:366-384. https://doi.org/10.1016/j.engfracmech.2018.07.037 Fang Q, Zhang JH, Huan Y, et al., 2013. The investigation into three-dimensional mesoscale modelling of fully-graded concrete., 30(1):14-21 (in Chinese). https://doi.org/10.6052/j.issn.1000-4750.2011.06.0398 Hu ZJ, Xia LL, Cheng C, et al., 2020. Investigation on corrosion-induced cracking and corrosion expansive pressure in reinforced concrete members., 52(3):99-105 (in Chinese). https://doi.org/10.11918/201812061 ISO (International Organization for Standardization), 2015. Steel for the Reinforcement of Concrete-Part 2: Ribbed Bars, ISO 6935-2:2015. ISO, Switzerland. Jin L, Liu M, Zhang R, et al., 2020. Cracking of cover concrete due to non-uniform corrosion of corner rebar: a 3D meso-scale study., 245:118449.https://doi.org/10.1016/j.conbuildmat.2020.118449 Jin YF, Yin ZY, 2020. Enhancement of backtracking search algorithm for identifying soil parameters., 44(9):1239-1261. https://doi.org/10.1002/nag.3059 Jin YF, Yin ZY, Wu ZX, et al., 2018. Numerical modeling of pile penetration in silica sands considering the effect of grain breakage., 144:15-29. https://doi.org/10.1016/j.finel.2018.02.003 Johnson GR, Holmquist TJ, 1994. An improved computational constitutive model for brittle materials., 309(1):981. https://doi.org/10.1063/1.46199 Lv TH, Chen XW, Chen G, 2018. The 3D meso-scale model and numerical tests of split Hopkinson pressure bar of concrete specimen., 160:744-764. https://doi.org/10.1016/j.conbuildmat.2017.11.094 MOHURD (Ministry of Housing and Urban-rural Development of the People’s Republic of China), 2010. Code for Design of Concrete Structures, GB 50010-2010. China Architecture Publishing & Media Co. Ltd., China (in Chinese). Naderi S, Tu WL, Zhang MZ, 2021. Meso-scale modelling of compressive fracture in concrete with irregularly shaped aggregates., 140: 106317. https://doi.org/10.1016/j.cemconres.2020.106317 Otieno M, Ikotun J, Ballim Y, 2019. Experimental investigations on the influence of cover depth and concrete quality on time to cover cracking due to carbonation-induced corrosion of steel in RC structures in an urban, inland environment., 198: 172-181. https://doi.org/10.1016/j.conbuildmat.2018.11.215 Qiao D, Nakamura H, Yamamoto Y, et al., 2016. Crack patterns of concrete with a single rebar subjected to non-uniform and localized corrosion., 116:366-377.https://doi.org/10.1016/j.conbuildmat.2016.04.149 Samanta R, Alessandro T, Jelke D, et al., 2021. A closer look at corrosion of steel reinforcement rebars in concrete using 3D neutron and X-ray computed tomography., 144:106439.https://doi.org/10.1016/j.cemconres.2021.106439 Sanz B, Planas J, Sancho JM, 2013. An experimental and numerical study of the pattern of cracking of concrete due to steel reinforcement corrosion., 114:26-41. https://doi.org/10.1016/j.engfracmech.2013.10.013 Šavija B, Luković M, Pacheco J, et al., 2013. Cracking of the concrete cover due to reinforcement corrosion: a two-dimensional lattice model study., 44:626-638. https://doi.org/10.1016/j.conbuildmat.2013.03.063 Tan BW, Okoronkwo MU, Kumar A, 2020. Durability of calcium sulfoaluminate cement concrete., 21(2):118-128.http://doi.org/10.1631/jzus.A1900588 Tran KK, Nakamura H, Kawamura K, et al., 2011. Analysis of crack propagation due to rebar corrosion using RBSM., 33(9):906-917. https://doi.org/10.1016/j.cemconcomp.2011.06.001 UngerJF, Eckardt S, 2011. Multiscale modeling of concrete., 18(3):341-393. https://doi.org/10.1007/s11831-011-9063-8 Wang B, 2018. A Model for Prediction of Time to Corrosion-induced Concrete Cover Cracking and Analysis of Meso-crack Propagation. PhD Thesis, Southwest Jiaotong University, Chengdu, China (in Chinese). Wang B, Wang H, Zhang ZQ, et al., 2018. Analysis of non-uniform corrosion of concrete cover under mesoscopic scale., (2):157-160 (in Chinese). https://doi.org/10.3969/j.issn.1002-3550.2018.02.040 Wang JM, Jivkov AP, Li QM, et al., 2020. Experimental and numerical investigation of mortar and ITZ parameters in meso-scale models of concrete., 109:102722. https://doi.org/10.1016/J.TAFMEC.2020.102722 Wang Z, Jin XY, Jin NG, 2014. Cover cracking model in reinforced concrete structures subject to rebar corrosion., 15(7):496-507.http://doi.org/10.1631/jzus.A1300393 Wu B, Yang Y, Zhang LL, et al., 2020. Meso-scale numerical study on the non-uniform corrosion-induced cracking of confined concrete., 260:120463. https://doi.org/10.1016/j.conbuildmat.2020.120463 Xiong H, Yin ZY, Nicot F, 2019. A multiscale work-analysis approach for geotechnical structures., 43(6):1230-1250. https://doi.org/10.1002/nag.2893 Xu L, Pang MW, Li XN, et al., 2020. Effect of rebar position and rebar arrangement on rust expansion laws of reinforced concrete beam., 53(1):106-113 (in Chinese). https://doi.org/10.16577/j.cnki.42-1215/tb.2020.01.020 Yang J, Yin ZY, Laouafa F, et al., 2020. Three-dimensional hydromechanical modeling of internal erosion in dike-on-foundation., 44(8):1200-1218. https://doi.org/10.1002/nag.3057 Yang XM, Yang ZB, Yang L, 2019. Relationship between corrosion rate and width of corrosion cracks in corner of concrete components with different depth of cover., 38(10):3332-3338 (in Chinese). https://doi.org/10.16552/j.cnki.issn1001-1625.2019.10.043 Yang ZJ, Huang YJ, Yao F, et al., 2020. Three-dimensional meso-scale cohesive fracture modeling of concrete using a Python script in Abaqus., 37(8):158-166 (in Chinese). https://doi.org/10.6052/j.issn.1000-4750.2019.09.0559 Yin ZY, Jin YF, Shen JS, et al., 2018. Optimization techniques for identifying soil parameters in geotechnical engineering: comparative study and enhancement., 42(1):70-94. https://doi.org/10.1002/nag.2714 Yin ZY, Wang P, Zhang FS, 2020. Effect of particle shape on the progressive failure of shield tunnel face in granular soils by coupled FDM-DEM method., 100:103394. https://doi.org/10.1016/j.tust.2020.103394 Zhang JH, Xiong J, 2020. Concrete cover cracking behaviors induced by the non-uniform corrosion of corner-located rebars., 42(1):70-78 (in Chinese). https://doi.org/10.13255/j.cnki.jusst.2020.01.012 Zhang WP, Chen JY, Luo XJ, 2019. Effects of impressed current density on corrosion induced cracking of concrete cover., 204: 213-223. https://doi.org/10.1016/j.conbuildmat.2019.01.230 Zhang Y, 2003. Durability of Concrete Structures. Shanghai Scientific & Technical Publishers, Shanghai, China (in Chinese). Zhang YL, Su RKL, 2020. Corner cracking model for non-uniform corrosion-caused deterioration of concrete covers., 234:117410. https://doi.org/10.1016/j.conbuildmat.2019.117410 Zhao CF, Yin ZY, Hicher PY, 2018. A multiscale approach for investigating the effect of microstructural instability on global failure in granular materials., 42(17):2065-2094. https://doi.org/10.1002/nag.2842 Zhao YX, 2013. State-of-art of corrosion-induced cracking of reinforced concrete structures., 43(5):1122-1134 (in Chinese).https://doi.org/10.3969/j.issn.1001-0505.2013.05.035 Zhu HX, Yin ZY, Zhang Q, 2020. A novel coupled FDM-DEM modelling method for flexible membrane boundary in laboratory tests., 44(3): 389-404. https://doi.org/10.1002/nag.3019 https://doi.org/10.1631/jzus.A2100304 U451.4; TU375 July 2, 2021; Aug. 24, 2021; Oct. 25, 2021 *Project supported by the National Natural Science Foundation of China (Nos. U1934213 and 51878572) © Zhejiang University Press 2021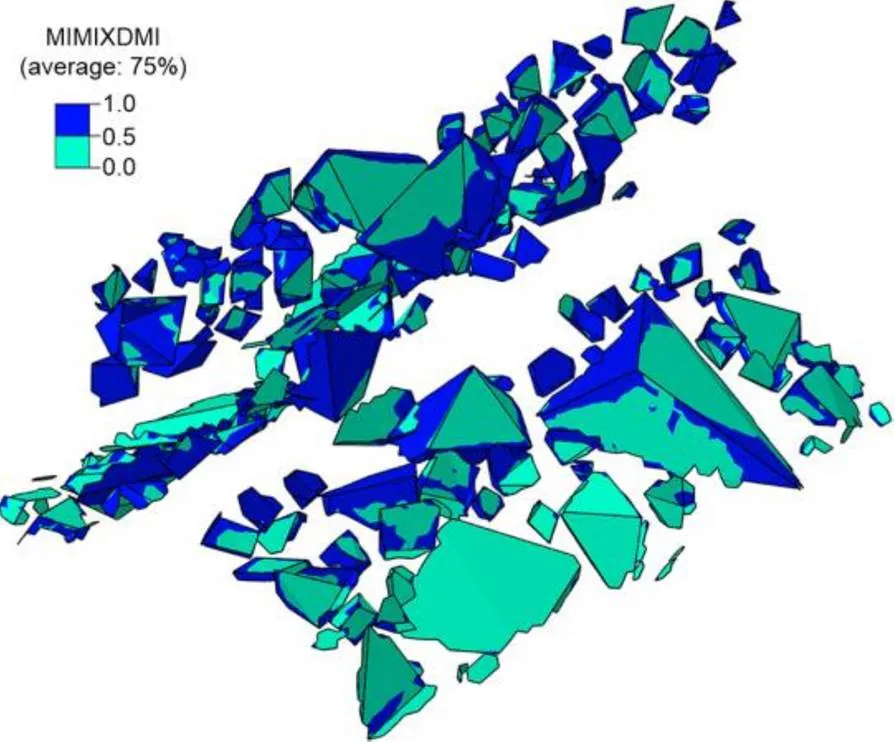
4.3 Influence of cross-section arrangement of rebars and cover thickness on corrosion expansion cracks

5 Scenario of multiple rebars
5.1 Finite element model

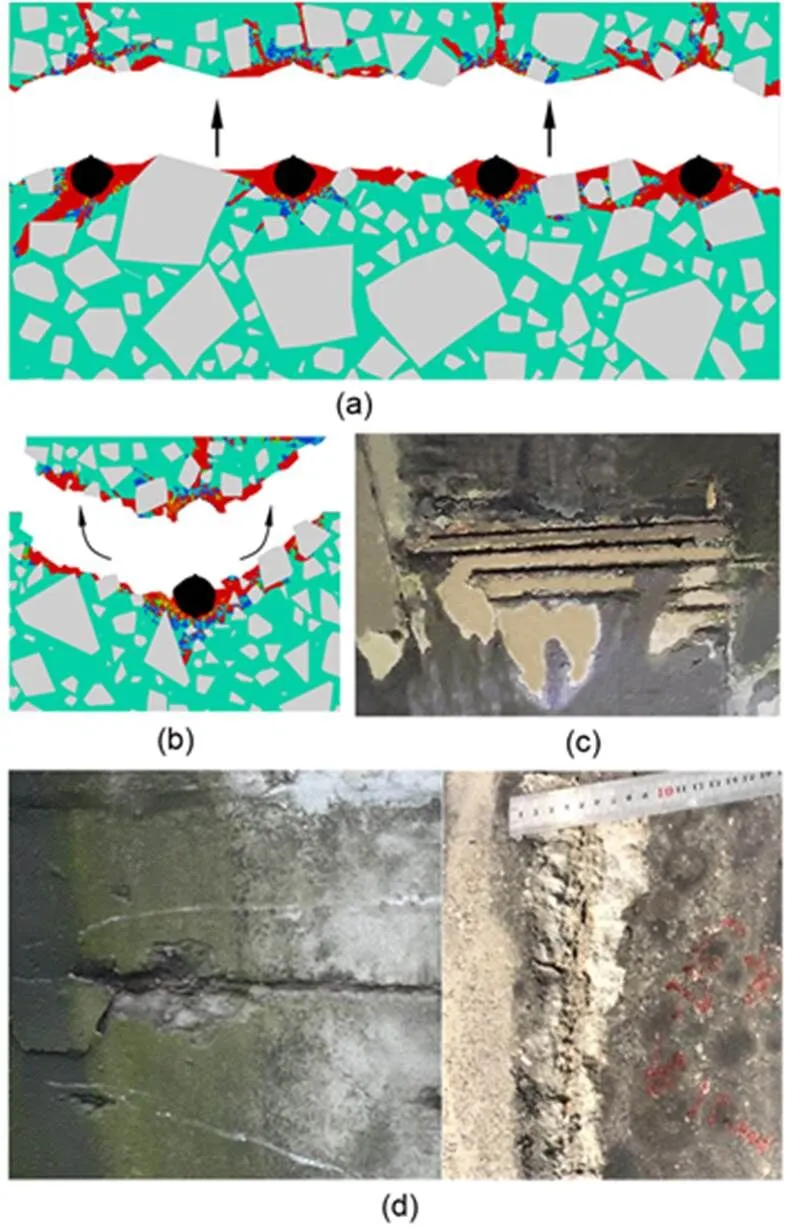
5.2 Influence of rebar spacing on the corrosion expansion crack and shedding mode of the cover


6 Conclusions
Contributors
Conflict of interest
猜你喜欢
杂志排行

Journal of Zhejiang University-Science A(Applied Physics & Engineering)的其它文章
- Large deformation analysis in geohazards and geotechnics
- Large deformation analysis of slope failure using material point method with cross-correlated random fields*
- Analysis of large deformation geotechnical problems using implicit generalized interpolation material point method*
- Implementation of absorbing boundary conditions in dynamic simulation of the material point method*