Crystal growth,structure and optical properties of Pr3+-doped yttria-stabilized zirconia single crystals*
2021-07-30DaiNiWang王黛妮ShouLeiXu徐守磊XiangYuWang王翔宇SiYaoLi李思瑶XingHong洪杏BernardGoodmanandWenDeng邓文
Dai-Ni Wang(王黛妮), Shou-Lei Xu(徐守磊), Xiang-Yu Wang(王翔宇), Si-Yao Li(李思瑶),Xing Hong(洪杏), Bernard A.Goodman, and Wen Deng(邓文)
School of Physical Science and Technology,Guangxi University,Nanning 53004,China
Keywords: yttria-stabilized zirconia(YSZ)single crystal,praseodymium-doped,optical floating zone method,luminescence
1. Introduction
The lanthanide elements have an abundance of electron energy levels,and transitions between them form the basis for a wide range of luminescence properties and applications.[1-3]Furthermore, their excited state lifetimes are relatively long,and their strong absorption capacity, high conversion rate,and stable physical and chemical properties make them important dopants for inorganic materials in solid-state optical devices.[4]Among the lanthanide ions,Pr3+has a wide range of emission characteristics in both the visible and infrared regions,and visible laser output has been reported in numerous Pr-doped hosts.[5-8]In addition,the emission band of Pr3+includes RGB components, which in principle can emit white light with the aid of other ions.[9]
Pr3+absorbs in the blue light region with a cross-section up to 10-19cm2, and energy absorbed in the blue region by Pr3+produces transitions at multiple wavelengths corresponding to blue-green to deep red light. The absorption peak near 450 nm corresponds to the output wavelength of an InGaN blue light diode (LD), and there is thus the possibility of using a blue LD as an absorption pump to achieve efficient green to deep red broadband spectral emission.[5]One strategy for white light emission (W-LED) is to combine a yellow emitting phosphor with blue LED chips, but because of the absence of red light, W-LEDs with blue chips have poor white light display and a low color rendering index.[10]However,the most intense emission peak obtained from Pr3+corresponds to red-orange light, and can be generated using a blue LD as an absorption pump.[10-12]This then offers the additional possibility of using Pr3+-doped yttria-stabilized zirconia(YSZ)for W-LED in combination with a yellow-emitting phosphor and blue LED chips.
Although fluorides typically have low phonon energies,high refractive index, and high thermochemical stability,their potential for use as lasers is limited by poor mechanical strength, high toxicity, and relatively high preparation costs.[13]Other halides also have similar advantages and disadvantages to fluoride, and halides in general are highly deliquescent.[14,15]The use of sulfides as host materials is limited by their sensitivity to both water and oxygen,and oxides.Compared with fluoride materials, oxides have better stability and are simpler to prepare,[16]and a combination of high mechanical strength with good physical,chemical and thermal properties makes them the most appropriate host materials for use in long-term applications.Among oxides,zirconium dioxide(ZrO2)is an effective host for promoting the luminescence of most lanthanide ions,because of its wide bandgap and low phonon energy (470 cm-1), combined with high hardness,high refractive index, good chemical stability, high dielectric constant, and low conductivity.[17]However, its high melting point and the existence of three crystal phases make it difficult to grow high-quality single crystals by common methods,and most reports of the optical properties of lanthanide ions doped in ZrO2have focused on phosphors, which suffer from having low luminosity. An additional problem in the use of ZrO2crystals arises from the appreciable volume changes accompanying the phase transitions that occur on cooling,[18]and it is very difficult to produce pure crystals from melts without cracking defects. However,the high-temperature cubic phase can be stabilized by addition of Y2O3,[19]and crystals of YSZ with high transparency, good crystallinity and purity can be grown by the optical floating zone method.[20]
This paper describes the growth and characterization of large high-quality single crystals of YSZ doped with different Pr concentrations using the optical floating zone method.The crystal structure and Pr oxidation state were determined in addition to characterizing the effects of Pr concentration on the optical absorption and luminescence properties,including calculation of their chromaticity coordinates and color purity.
2. Experimental details
Pr-doped YSZ single crystals were prepared with a composition ofxmol% Pr6O11+(8.00-x) mol% Y2O3+92.00 mol%ZrO2(x=0.01, 0.05,0.10, 0.15,0.20 and 0.30)as described in Table 1. ZrO2, Pr6O11and Y2O3nano powders with a purity of 99.99% were used as starting materials.The well-mixed powders were pressed into balloon molds,using a hydraulic pressure of 68 MPa to form dense, uniform and straight rods. These were then calcined at 1500°C for 12 h to form ceramic rods,which were used as seed and feed rods for single crystal preparation by the optical floating zone method. Crystals were grown at a tension rate of 5 mm/h,speed rotation of 10 rpm,as the upper and lower rods were rotated in opposite directions to aid the uniformity of the growth process.[21]The resulting Pr6O11: YSZ crystals were about 50 mm in length and 5 mm in diameter. The growth rate of crystals is related to the difference in the rate of attachment and separation of atoms at the solid-liquid interface.[22]As shown in Fig.1,these crystals were of high quality and free of pores,cracks,or inclusions;they were tawny in color and their color intensity increased with increasing Pr concentration.

Table 1. Chemical compositions of Pr-doped YSZ single crystals.
After synthesis,single crystals and ceramic samples were prepared for XRD, XPS and EPR measurements by grinding into powders in an agate mortar.Crystal samples were also cut into 1.0 mm thick slices and polished for Raman spectroscopic and optical measurements, as shown in Fig. 1(b), where the underlying text can be clearly seen through the sample discs.

Fig. 1. Photographs of (a) Pr-doped YSZ single crystal rods with initial Pr6O11 concentrations of 0.01,0.05,0.10 mol%,and(b)1.0 mm thick single crystal discs with initial Pr6O11 concentration of 0.01,0.10,0.15,0.30 mol%.
Analytical measurements were made on a crystal wafer prepared with 0.15 mol% of Pr6O11using energy-dispersive x-ray(EDX)spectroscopy on our SEM instrument,and x-ray photoelectron spectroscopy (XPS) on powders from a similar crystal,an equivalent ceramic,and the oxide mixture used in the synthesis. The EDX measurements showed that all of the elements were evenly distributed,and thus the doping elements were well dispersed in the crystal,as shown in Fig.2.

Fig.2. The elemental distribution of 0.15 mol%Pr-doped YSZ crystal.
Because of conductive adhesive tape used for the XPS measurements and the presence of hydrocarbon pollutants in the air, there was interference from C and O in the measurements. However, these could be compensated by comparing results from the powder mixture used for the synthesis with the corresponding ceramic and crystal samples. Results for the samples prepared using 0.15 mol% Pr6O11are shown in Table 2.

Table 2. Percentages of the metal atoms in the YSZ single crystalsprepared with 0.15 mol%Pr6O11.
The structures and properties of the various Pr-doped YSZ samples were characterized by a range of physical techniques. X-ray diffraction (XRD) (Dandong Haoyuan Instrument Co.,Ltd.,China)was performed on powder samples using CuKαradiation(λ=1.5418 ˚A)with a 0.6°/s scan rate,and 0.02°step size within the scan range 20°-80°2θdiffraction angles. Raman spectra of crystal discs were measured in the range 300-1000 cm-1with a confocal Raman microprobe spectroscope (Finder One, Zolix from Beijing Zhuoli Hanguang Company) equipped with a 532 nm laser. X-ray photoelectron spectroscopy(XPS)(Thermo Fisher ESCALAB 250XI) utilized an AlKamonochromator operating with a vacuum of 1×10⁻¹⁰mba, 150 W power, with analysis of a 500 μm beam spot. Charge correction was performed by using the C 1s orbital (284.8 eV). Electron paramagnetic resonance (EPR) spectra of powder samples from single crystals were acquired at room temperature with a Bruker Biospin A300 X-band spectrometer, which used a Gunn diode as the microwave bridge and was equipped with a high-sensitivity resonator cavity. G-values were obtained by reference to the Bruker ER4119HS-2100 marker accessory with a value of 1.9800. Optical absorption spectra in the range 400-640 nm were obtained with a UV-Vis spectrophotometer (Shimadzu,UV-2700). Photoluminescence excitation (PLE) and photoluminescence (PL) spectra were measured at room temperature using a PL spectrometer (ZLF-325 type, Beijing Zhuoli Hanguang Optical Instrument) with a 150 W xenon lamp as the excitation source. Chromaticity coordinates were calculated using Go-CIE software to define the color space, where the abscissaxrepresents the proportion of red in the color,and the ordinateyrepresents the proportion of green in the color.
3. Results
3.1. Identification of the structures of the Pr-doped YSZ samples
The XRD patterns of ground YSZ crystal samples prepared with different Pr6O11concentrations are shown in Fig.3.They are all similar and only show peaks from the(111),(200),(220),(311),(222)and(400)lattice planes of the c-ZrO2structure(PDF 04-006-5589),[23]which belongs to theFm3m(225)space group. However, as illustrated for the sample prepared using 0.15 mol%Pr6O11(Fig.4),the ceramic powder pattern showed an additional weak diffraction peak at 28.18°and a broad peak between 30.60°and 31.46°, which respectively correspond to the(-111)and(111)planes of monoclinic ZrO2(JCPDS No.00-037-1484).[24]In addition to being present exclusively in a stable cubic phase,all of the Pr-doped YSZ crystal samples prepared by the FZ method showed narrower and more intense diffraction peaks than those from ceramics, and thus have greater crystallinity. Furthermore, the lattice constantaincreased progressively with increasing Pr concentration, as shown in Table 3. This indicates that doping leads to lattice expansion and is consistent with the Pr being incorporated uniformly in the YSZ structure. All the samples were measured and refined under identical conditions, and all of the diffraction peaks were taken into consideration in order to minimize the overall error in the analysis.

Fig.3. XRD patterns for powders of Pr-doped YSZ single crystals prepared with different concentrations of Pr6O11.

Fig.4. XRD patterns for powders ground from the ceramic and single crystal samples of YSZ prepared with 0.15 mol%Pr6O11.
The lattice parameters of the sample were calculated by the following formula for the cubic crystal system:

whereais the lattice constant,dis the interplanar spacing,andh,landkare the crystal plane indices.

Table 3. Lattice parameters for Pr-doped YSZ crystals.
Although the XRD results from the Pr-doped YSZ crystals are all consistent with the cubic phase, the patterns of the cubic and tetragonal phases of ZrO2are quite similar,and there is considerable overlap in their diffraction peaks at 30°,35°, 50°, and 60°.[25]Therefore, further investigation of the structures of the Pr-doped YSZ crystals were performed using Raman spectroscopy,since this can clearly distinguish the two phases,[26]which are determined by the symmetry of the crystal unit cell and the number of types of atom. The tetragonal zirconia (t-ZrO2) structure is characterized by six Raman active modes (A1g+2B1g+3Eg),[27]whereas c-ZrO2has only one Raman active mode(F2g)at about 625 cm-1.[28]The Raman spectra of YSZ single crystal discs prepared with different concentrations of Pr6O11(x=0.10, 0.15, 0.30 mol%) under 532 nm laser excitation in the range 300-1000 cm-1are shown in Fig.5. These have a single distinct energy band centered at about 622 cm-1,corresponding to the F2gRaman active mode of c-ZrO2,and confirm that the Pr-doped YSZ crystals all have a cubic structure at room temperature.

Fig. 5. Raman spectra for discs of Pr-doped YSZ single crystals prepared from different concentrations of Pr6O11.
3.2. Determination of the Pr oxidation state
Commercial praseodymium oxide has the general formula Pr6O11, and contains both the Pr3+and Pr4+oxidation states.[29]In order to determine the oxidation state(s) of Pr in the YSZ samples, XPS measurements were performed on powders from both ceramic and single crystal samples. As illustrated for samples prepared with 0.15 mol%Pr6O11, these showed peaks corresponding to Pr 3d,O 1s,Pr 4s,C 1s,Zr 3d,Y 3d,Pr 4d,Pr 5s and Pr 5p(Fig.6)(the C was derived from atmospheric pollutants and the conductive tape used to hold the sample in the measurement). A high-resolution spectrum of the Pr 3d peaks(Fig.7)shows the main peak with a binding energy (BE)of 933.18 eV in both the ceramic and single crystal samples. This is very close to the value of 933.4 eV for Pr2O3, which was used as a reference for Pr3+, and considerably smaller than the value 935.5 eV for PrO2which was used as a reference for Pr4+.[30,31]In addition, the spin-orbit splitting has been reported to be 20.7 eV for the oxide with Pr3+and 17.8 eV for the oxide with Pr4+;[31]thus the 20.9 eV separation of the peaks at 933.18 eV and 954.08 eV from the Pr 3d5/2and Pr 3d3/2electrons,respectively(Fig.7),provides further evidence for Pr being solely Pr3+.

Fig. 6. XPS spectra for ground YSZ ceramic and crystal samples prepared with 0.15 mol%Pr6O11.

Fig. 7. XPS spectra of the Pr 3d level for ground YSZ ceramic and crystal samples prepared with 0.15 mol%Pr6O11.
The ground single crystal samples were also investigated by EPR spectroscopy, and first derivative spectra from the sample prepared with 0.15 mol%Pr6O11are shown in Fig.8.The spectrum in Fig. 8(a) is dominated by an intense broad signal withg ≈11 along with two weak signals from free radical defects, which are shown in expanded form in Fig. 8(b).There is no evidence for any signal that could be associated with an isolated Pr4+ion,which contains a single 4f electron,and would thus be anisotropic withg-values<2.0. Although the absence of such a signal does not definitively exclude the presence of Pr4+,this result is consistent with the XPS result,which showed that Pr was in the form of Pr3+. The two weak signals,which haveg-values of 2.0024 and 2.0005,show quite different microwave power saturation responses,and thus correspond to different types of radical defect, and will be the subject of a more detailed investigation in the future.
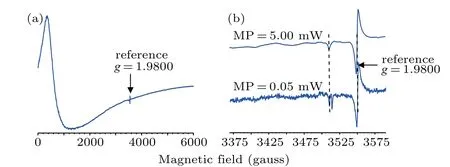
Fig. 8. EPR spectra from a ground crystal sample of YSZ prepared with 0.15 mol%Pr6O11 (a)wide scan,and(b)narrow scan showing the influence of microwave power.
3.3. Optical properties
The absorption spectra in the 400-640 nm range, illustrated in Fig. 9 for the YSZ single crystal prepared with 0.15 mol% Pr6O11, are composed of five distinct peaks, centered at 450 nm,472 nm,486 nm,584 nm and 612 nm. These correspond to the transitions3H4→3P2,3H4→3P1+1I6,3H4→3P0,3H4→1D2, respectively, in the Pr3+ion.[32]It should also be noted that splitting of the3H4and1D2energy states results in two absorption peaks in the yellow-orange light range.
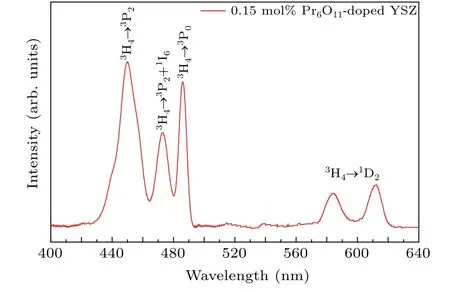
Fig. 9. Absorption spectrum of Pr-doped YSZ crystal prepared with 0.15 mol%Pr6O11.
The room-temperature PLE and PL spectra of Pr-doped YSZ single crystals,presented in Figs.10 and 11,respectively,show the characteristic excitation and emission peaks of trivalent Pr3+.[33]The PLE spectrum in the 300 nm to 590 nm range of the YSZ single crystal prepared with 0.15 mol%Pr6O11was measured by monitoring the strongest emission peak at 614 nm, and shows several excitation peaks centered on 338,450,469,482 and 582 nm.
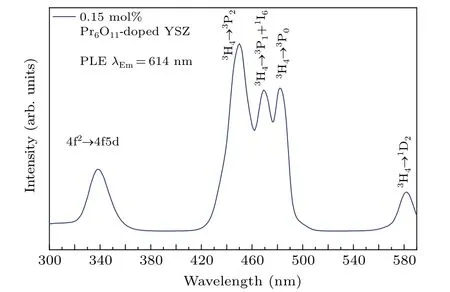
Fig. 10. Photoluminescence excitation spectrum of Pr-doped YSZ crystal prepared with 0.15 mol%Pr6O11 obtained by monitoring at 614 nm.

Fig. 11. Photoluminescence emission spectra of Pr-doped YSZ crystal prepared from different concentrations of Pr6O11 obtained by the excitation at 450 nm.
The PL spectra in the visible range of various Pr-doped YSZ single crystals are presented in Fig. 11 for excitation at 450 nm. The shape of the emission lines was insensitive to the Pr content,and several emission peaks were observed that are characteristic of Pr3+transitions. The strongest peak was detected at 614 nm,and this was accompanied by a less intense green emission at 564 nm, a weak yellow-orange emission at 587 nm,an intense orange-red emission at 614 nm,an intense red emission at 639 nm,and a very weak deep red emission at 716 nm.
4. Discussion
4.1. Structure and composition of the Pr-doped YSZ crystals
Results obtained from powder XRD and Raman spectroscopy showed that all of the Pr-doped YSZ crystal samples prepared in this work by the FZ method were solely in a stable cubic phase. This is analogous to the structures of other YSZ crystals doped with rare earth ions,[20,23]and indicates that replacement of some of the Y in YSZ by Pr has no effect on the crystal structure, although it does result in an increase in the lattice dimensions. These crystals were all free from cracks and occlusions, thus confirming the value of the FZ method for preparation of high-quality single crystals. In contrast,ceramic samples with the same composition had a mixture of phases with broader and less intense XRD peaks than those from the single crystals, a result which indicates a more uniform structure in the single crystal samples.
The Pr6O11starting material used in this work contains a mixture of the Pr3+and Pr4+oxidation states, and is the stable Pr oxide formed by thermal decomposition of various oxide, hydroxide, and carbonate species.[34,35]Furthermore,several Pr oxide species exist with compositions ranging from Pr2O3to PrO2,[36]and different forms are stable at different temperatures.[37]Thus it was important to establish the oxidation state of Pr in the YSZ crystals prepared in this work,and this was shown by XPS to be exclusively in the Pr3+state. It has been reported that Pr6O11decomposes reversibly on heating to a mixture of Pr3+and O2at temperatures>770°C,[35]and the current results indicate that the reverse reaction is prevented by dispersion of the Pr3+in the YSZ matrix during the solid-state reaction. The increasing lattice expansion with increasing Pr doping of YSZ shown by the XRD results is also consistent with Pr being at least primarily in the Pr3+state,which is larger than that of Y3+for the same coordination environment,[38]whereas Pr4+is smaller, and the absence of any resonance that could be associated with Pr4+in the EPR spectra provides further evidence for Pr being in the Pr3+oxidation state when doped into YSZ.
4.2. Significance of the optical properties
The optical absorption spectra are all consistent with transitions in the Pr3+ion, and correspond to the transitions between the3H4ground state and the3P2,3P1+1I6,3P0,and1D2excited states. In the absorption spectra,the3H4→1D2transition is split into a doublet,and as reported by Savoiniet al.,[32]is associated with transitions from the3H4ground state to the two Stark components of the1D2state. The strong splitting(~800 cm-1)observed in this transition indicates a relatively strong crystal field around the Pr3+ion.[32]However,the most intense absorption is in the blue region (the strongest peak is at 450 nm),and this result is consistent with the published results for Pr3+, such as Pr: CNGG crystal[39]and Pr3+-doped Na3La9O3(BO3)8crystal.[11]
As expected, the PLE wavelengths in the range of 400-590 nm of Pr-doped YSZ single crystals are similar to those in the absorption spectrum(Fig.8),and are similarly assigned to transitions between the3H4ground state and the3P2,3P1+1I6,3P0and1D2excited states. However,the most intense excitation peak at 450 nm is at an appreciably lower energy than that reported for micro-spherical ZrO2:Pr3+phosphors where the strongest excitation peak is near 300 nm, and may be the consequence of the structural differences.[40]It is also worth noting that 450 nm coincides with the emission band of blue LED chips, which represent an additional source for a blue light pump, such as commercial InGaN LED chips, and indicates that that these could be used to activate Pr-doped YSZ as a laser material.
The PLE excitation band centered at 338 nm is assigned to the 4f2→4f5d transition of Pr3+. Short-lived emission lines have been reported previously for Pr3+-doped zirconia ceramics[41]and vary according to the crystal symmetry,with the first f→d transition of the monoclinic phase being located at 345 nm and that of the tetragonal phase at 300 nm. However,with both the PLE spectra under 614 nm monitoring and the PL spectra after excitation at 450 nm, the single crystals showed fewer heteropeaks than the tetragonal and monoclinic zirconia ceramics,[41]and this is probably a reflection of the more uniform structure of the single crystals.

Fig.12. Schematic energy level diagram for Pr3+ in YSZ following excitation at 450 nm.
The various transitions that are responsible for the luminescence results are summarized in Fig. 12. Excitation from the ground3H4level to the excited3P2level by 450 nm radiation is followed by rapid non-radiative decay to the3P0and1D2levels, which then undergo photonic emissions as they decay to lower energy levels; they finally return to the ground state by multiphonon relaxation and non-radiative transitions. The emission peaks centered around 564 nm,587 nm,614 nm and 716 nm correspond to the transitions3P0→3H5,1D2→3H4,3P0→3H6,and3P0→3F3,respectively.The emission band in the range 630-675 nm centered on 639 nm is broad,and may represent a combination of the3P0→3F2and1D2→3H5transitions. As can be seen from the PL spectra in Fig. 11, the luminescence intensity first increased, then subsequently decreased with increasing Pr concentration,and the maximum intensity was observed in the sample prepared with 0.15 mol%Pr6O11. Furthermore,the PL spectra show that the intensities of emissions from the3P0and1D2energy levels are both sensitive to the Pr concentration, but the peak position is little changed,and the luminescence transition mechanism is not affected. Thus this result is in contrast to those observed with Pr3+-doped glasses,such as calcium aluminosilicate (CAS),[42]and other materials that are more sensitive to their environments.
4.3. Fluorescence quenching mechanism
Quenching of the fluorescence emission intensity was observed in samples prepared with Pr6O11concentrations>0.15 mol%. This could result from either exchange or multipole-multipole interactions, which produce nonradiative energy transfer between neighboring Pr3+ions.[43]However, it is possible to determine the type of interaction mechanism responsible for the quenching process by calculating the critical distance(Rc)between the neighboring Pr3+ions by the formula[10,44]

whereVis the volume of the unit cell,Nis the number of activated ions in the unit cell,andXcis the critical ion concentration. Using the data in Table 2(i.e.,V=135.92 ˚A3,N=4,Xc=0.90 mol%Pr3+),Rcis calculated to be 19.32 ˚A.For exchange interactions,Rcis<5 ˚A,[45,46]and electric multipolemultipole interactions thus represent the principal mechanism for energy transfer between Pr3+ions in our YSZ crystal.
4.4. Chromaticity coordinates
The chromaticity coordinate (CIE) is a mathematical method for defining color space, which refers to the position of the color in the chromaticity diagram, and is an important parameter for measuring the quality of fluorescence emission spectra.[47]The calculation of the chromaticity coordinates and the dominant wavelength in color purity calculations are determined from the PL emission spectra in Fig.10,and their values determined using Go-CIE software for the Prdoped YSZ crystal samples are shown in Fig.13.The emission peaks of all samples were similar,and the chromaticity coordinates of the YSZ crystal prepared with 0.15 mol%Pr6O11are located in the red-orange light region around(0.6559,0.3437)in the CIE 1931 chromaticity diagram.
The color purity of the YSZ crystal prepared with 0.15 mol%Pr6O11can be calculated by the formula[48]

where (xs,ys), (xi,yi) and (xd,yd) are the CIE coordinates (0.6559,0.3437), the coordinates of the light source(0.1510,0.0364) and the coordinates of the main peak of the emission spectrum (0.6731,0.3269), respectively. The calculated value of about 98.9% for the color purity of the YSZ crystal prepared with 0.15 mol% Pr6O11is appreciably higher than that of the phosphor Ca7Zn2(PO4)6(CZP):Pr (90.7%).[49]In addition, the color purity of Pr-doped YSZ crystals is higher than that of Sm-doped YSZ crystals(96.7%),[23]which have already been considered as good candidates for red emission lasers. Thus Pr-doped YSZ crystals could replace the phosphor for output of red-orange light,and have potential applications in red laser devices. They could also have applications for W-LED by improving the colorrendering index of a combination of a yellow-emitting phosphor and blue LED chips.
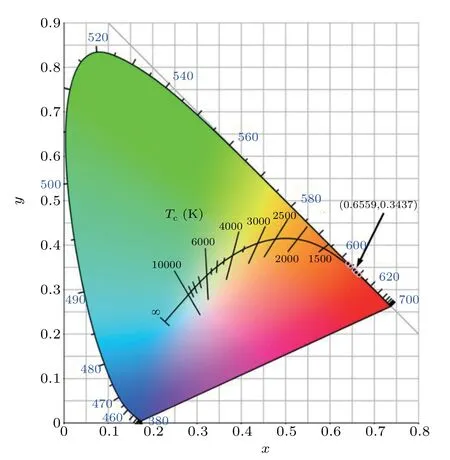
Fig. 13. Chromaticity diagram of Pr-doped YSZ single crystals prepared from different concentrations of Pr6O11.
5. Conclusion
This work shows that the FZ method is able to produce Pr-doped YSZ single crystals with excellent optical properties.Also, in contrast to the results from ceramic samples which contained a mixture of phases,single crystal samples were all exclusively in the cubic phase.
Although the Pr6O11,which was used as the source of Pr,contains a mixture of oxidation states, the XPS and EPR results indicate that only Pr3+was present in the YSZ crystals produced by the FZ method.
The absorption and PLE spectra of the Pr-doped YSZ crystals showed strong absorption in the blue light region,and thus demonstrate that a blue light pump source,such as a commercial LED chip, could be used for generation of PL. Under excitation by a 450 nm xenon lamp,five prominent emission peaks were observed at 565 nm(green),588 nm(yelloworange),614 nm(orange-red),638 nm(red)and 716 nm(deep red).
The maximum intensity for the emission peak at 614 nm was obtained for the crystal prepared with 0.15 mol%Pr6O11,and higher Pr concentrations resulted in a decrease in intensity as a result of concentration quenching, which was shown to occur primarily by an electric multipole-multipole process.
The calculated CIE coordinates and color purity results indicate that the emission from Pr-doped YSZ crystals may have potential applications as red lasers,and in the production of W-LED.
Finally, as materials with UV, visible, and infrared response elements,Pr3+-doped YSZ crystals have the necessary structure to utilize a full spectrum of solar radiation.
Acknowledgment
Daini Wang thanks Dr. Xiaojun Tan and Dr. Lei Zhang for help in experiments.
猜你喜欢
杂志排行

Chinese Physics B的其它文章
- Projective representation of D6 group in twisted bilayer graphene*
- Bilayer twisting as a mean to isolate connected flat bands in a kagome lattice through Wigner crystallization*
- Magnon bands in twisted bilayer honeycomb quantum magnets*
- Faraday rotations,ellipticity,and circular dichroism in magneto-optical spectrum of moir´e superlattices*
- Nonlocal advantage of quantum coherence and entanglement of two spins under intrinsic decoherence*
- Universal quantum control based on parametric modulation in superconducting circuits*