Effect of laser focus in two-color synthesized waveform on generation of soft x-ray high harmonics
2023-02-20YanboChen陈炎波BaochangLi李保昌XuhongLi李胥红XiangyuTang唐翔宇ChiZhang张弛andChengJin金成
Yanbo Chen(陈炎波), Baochang Li(李保昌), Xuhong Li(李胥红),Xiangyu Tang(唐翔宇), Chi Zhang(张弛), and Cheng Jin(金成),2,†
1Department of Applied Physics,Nanjing University of Science and Technology,Nanjing 210094,China
2MIIT Key Laboratory of Semiconductor Microstructure and Quantum Sensing,Nanjing University of Science and Technology,Nanjing 210094,China
Keywords: high-order harmonic generation,two-color waveform,soft x-rays,macroscopic propagation,laser focus
1. Introduction
High-order harmonic generation(HHG)by interaction of a strong femtosecond laser with a gaseous medium has been used as a tabletop light source with wavelength covering the extreme ultraviolet (XUV) to soft x-rays.[1–3]It has also unbolted attosecond science since it can be employed to produce an ultrafast optical pulse with temporal duration of tens or hundreds of attoseconds.[4–11]Such temporal characteristics of HHG have made it a unique tool for studying timeresolved spectroscopy and for probing electron dynamics in atoms,molecules,and solids.[12–15]
With the conventional Ti:sapphire lasers operating at the wavelength of 0.8 μm,the HHG is mostly limited in the XUV spectral region.[4]Advance of mid-infrared(MIR)lasers with wavelength of a few microns has made it possible to generate high harmonics in the soft x-ray spectral region.[1,16–18]Meanwhile, a variety of gating methods have been applied to produce isolated attosecond pulses in soft x-rays.[19–23]From a simple-man model or a three-step model,[24,25]one knows that the cutoff photon energy of single-atom HHG by a laser with intensityI0and wavelengthλ0is given by ¯hω=Ip+3.17Up,where the ponderomotive energyUp∝,withIpbeing the ionization potential and ¯hthe reduced Planck constant. On the other hand,the HHG yields from each atom drop quickly with increasing laser wavelength, which follows the scaling law of.[26–29]Thus, how to improve the low conversion efficiency of soft x-ray HHG with MIR lasers becomes a critical issue as they are highly in demand for attosecond experiments.[14]
One of feasible ways to increase the conversion efficiency of HHG in soft x-rays is to modify the sub-cycle waveform of driving laser, through which the single-atom HHG yields can be significantly improved by precisely controlling the ionization and propagation steps of electrons in the laser field.[30–36]This has been achieved by accurately synthesizing the multi-color laser pulses. This technology becomes mature as demonstrated by a number of examples of synthesizing multi-color waveform in labs since 2011[37–41]due to development in optical parametric amplification(OPA)and optical parametric chirped pulse amplification (OPCPA). From theoretical side, optimized multi-color waveforms for enhancing soft x-ray HHG yields have been proposed in the single-atom response level. For example, in 2009, Chipperfieldet al.[42]constructed the so-called “ideal waveform” by synthesizing five-color laser pulses to dramatically increase the HHG cutoff energy. In 2014, Jinet al.[43]proposed an optimization scheme for obtaining a waveform with synthesized two- or three-color laser pulses based on genetic algorithm,which can enhance single-atom HHG yields by one to two orders over the single-color one without the increase of the total laser power.However, high harmonics are coherently generated from all atoms in the gas medium. To finally realize the enhancement of HHG yields by optimized multi-color laser waveforms,one has to consider the nonlinear macroscopic propagation of the fundamental driving laser together with the generated highharmonic field.[44–51]To take into account macroscopic conditions for HHG with optimized multi-color waveforms,for simplicity,it has been usually assumed that all colors are focused at the same plane.[42,43,52–54]To the best of our knowledge,there are no studies to discuss how the macroscopic generation of HHG is affected if laser focuses are varied in the synthesis of multi-color waveforms.
In this work,our main goal is to systematically investigate how and why the change of laser focuses of multi-color laser waveform can influence the macroscopic HHG.We obtain the optimal conditions for enhancing the HHG yields in soft xrays by applying the optimized multi-color waveform obtained in the single-atom response. We mainly focus on two extreme conditions: very low and very high gas pressures. As shown in Fig.1,we adopt a two-color optimized waveform consisting of a mid-infrared(1600 nm)and its third harmonic(533 nm)fields presented in Ref. [43]. A gas jet is fixed atz=0 mm,and two laser components are focused atz1andz2, respectively. By varyingz1andz2,high harmonics in the soft x-ray spectral region are greatly modified. This paper is arranged as follows: In Section 2, we give some necessary theoretical methods for simulating both the single-atom and macroscopic HHG.In Section 3,we show the laser-focus dependent high harmonics by using different two-color waveforms, and analyze the HHG phase-matching mechanism by examining the evolution of two-color waveforms and time-frequency harmonic emissions in the gas medium. The conclusion is given in Section 4.
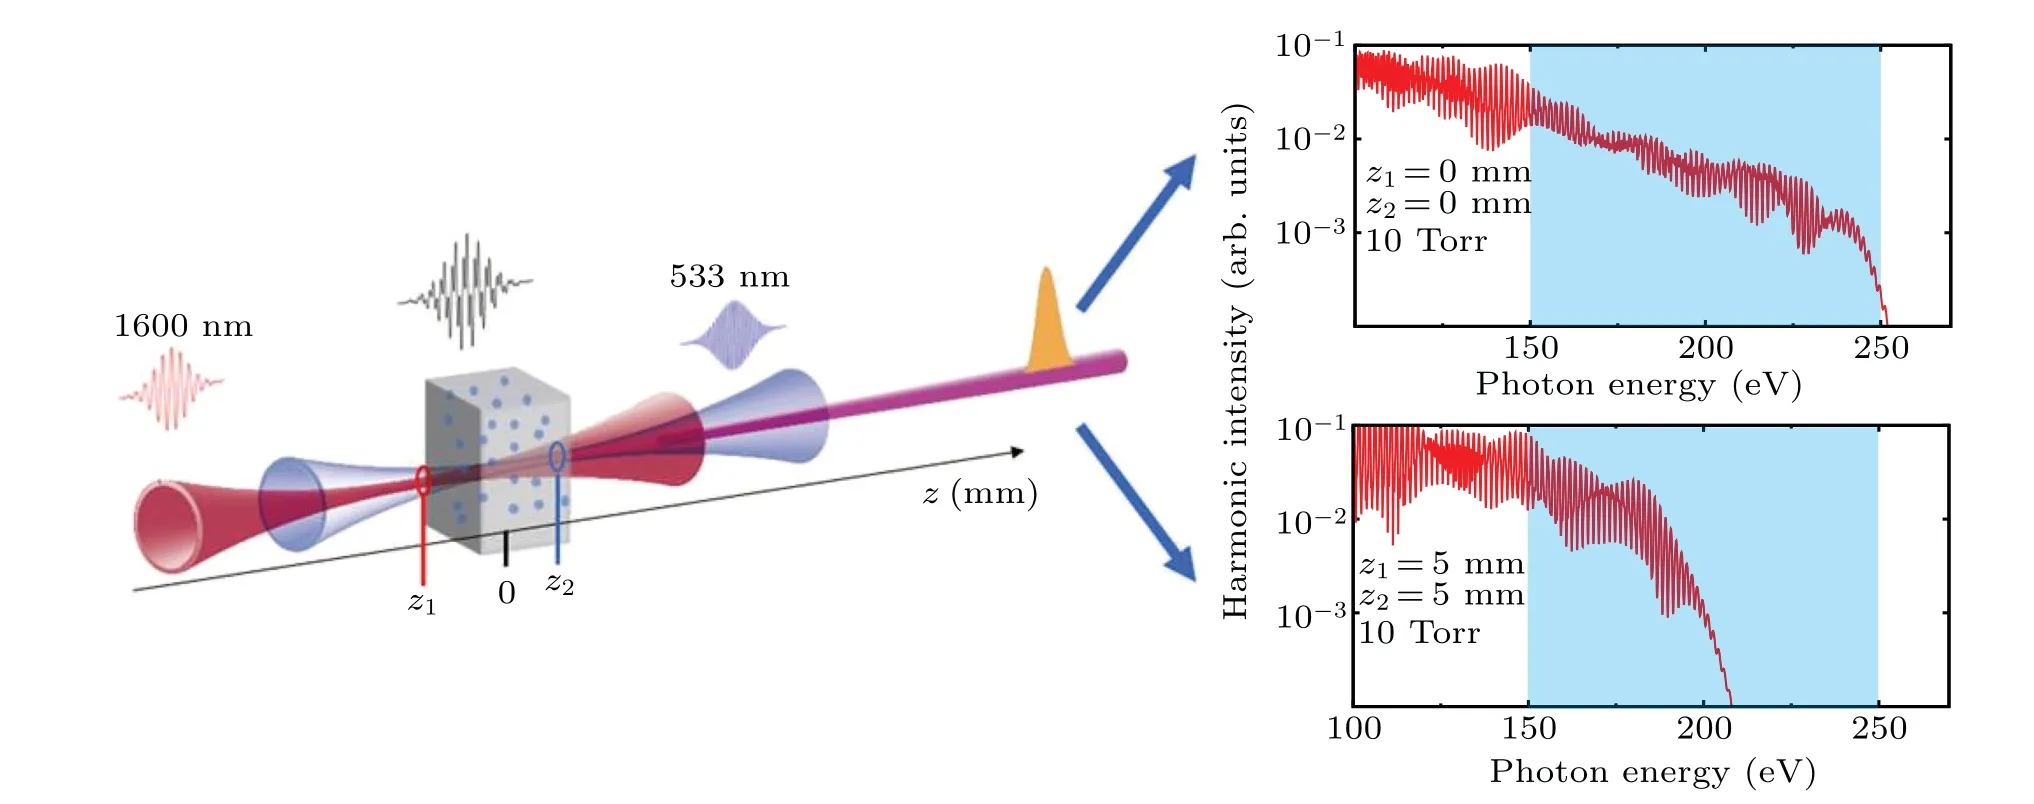
Fig.1. Schematic of two-color (1600+533 nm) Gaussian beams focused at different places interacting with a gas medium. Generated macroscopic HHG spectra in the soft x-ray region(from 150 eV to 250 eV)are varied(including both yield and spectral region)with the two-color laser focuses.
2. Theoretical methods
2.1. Single-atom response
To simulate the interaction of an atom with an intense driving laser pulse, one needs to solve the time-dependent Schr¨odinger equation (TDSE). This equation can be solved analytically with a strong-field approximation (SFA),[55]the induced dipole can thus be computed by using the timedependent wave function of active electron. The accuracy of the SFA can be greatly improved by a quantitative rescattering(QRS)model.[56,57]Within the QRS model,the complexvalued induced dipoleD(ω)of an atomic target can be written as

whered(ω) is the complex photorecombination transition dipole matrix element,andW(ω)is the complex microscopic electron wave packet. The former can be obtained by solving the time-independent Schr¨odinger equation with including the effect of long-range Coulomb potential, and the latter can be accurately calculated under the SFA asW(ω) =DSFA(ω)/dSFA(ω). The QRS has a high accuracy comparable to the TDSE, but costs less computation time nearly as the same as the SFA. Thus this model can be efficiently used for simulating macroscopic HHG.
2.2. Macroscopic propagation of driving laser and highharmonic fields in the gas medium
For the aim at calculating the soft x-ray high harmonics emitted in a gaseous medium, both the single-atom induced dipole and the macroscopic response are necessary. The QRS model discussed above can be used to calculate the former one,and the latter part can be computed by solving the propagation equations of driving laser and high-harmonic fields in the nonlinear medium. The details of these propagation equations have been given in a number of references.[44–48]Here we only give some key equations.
In a dense and ionizing gaseous medium,the macroscopic propagation of a driving laser pulse is affected by refraction,nonlinear self-focusing, ionization, and plasma defocusing.The pulse evolution in such an atomic medium is usually described by a three-dimensional (3D) Maxwell wave equation(MWE)[44]

whereE1(r,z,t) is the transverse electric field of the driving laser,ηeffis the effective refractive index, andJabsis the absorption term due to the ionization. The 3D propagation equation of high-harmonic field is given by[44]

The polarizationP(r,z,t) consists of both linear and nonlinear parts. The latter term is related to the single-atom induced dipole momentD(r,z,t). Once the high-harmonic field at the exit of gas medium (z=zout) is computed, the macroscopic harmonic spectrum at the near field can be obtained by integrating over the transverse plane as follows:

3. Results and discussion
3.1. Simulated high harmonics with 1600+533 nm twocolor waveforms
In this work,we use Ne as the target atom. To check the effect of laser focus on the HHG, we choose three different two-color waveforms,which have 1600-nm and 533-nm laser wavelength components. Laser parameters to compose these waveforms, labeled as waveform 1 (WF1), WF2, and WF3,are given in Table 1. In the simulations, the center of a 1-mm-long gas jet is fixed atz=0 mm,and the focusing points of 1600-nm and 533-nm lasers are labeled usingz1andz2,respectively. It is assumed that gas density is distributed uniformly. Both laser beams are assumed to be Gaussian. The beam waist of 1600-nm laser is set as 70 μm, while it is set as 40 μm for the 533-nm one so that they both have the same Rayleigh length (zR) of about 10.0 mm. Since the geometric(or Gouy) phase of focused laser beam changes dramatically betweenz=-zR/2 andzR/2,the distance from the center of gas jet to laser focus is varied in this range. The full width at half maximum (FWHM) pulse duration for both lasers are taken to be 3 optical cycles of 1600 nm. Peak intensity and carrier-envelope phase (CEP) at the focus for both lasers are chosen in accordance with the two-color waveform parameters listed in Table 1. This means that desired two-color waveform can only be formed atz=0 mm whenz1=z2=0 mm.
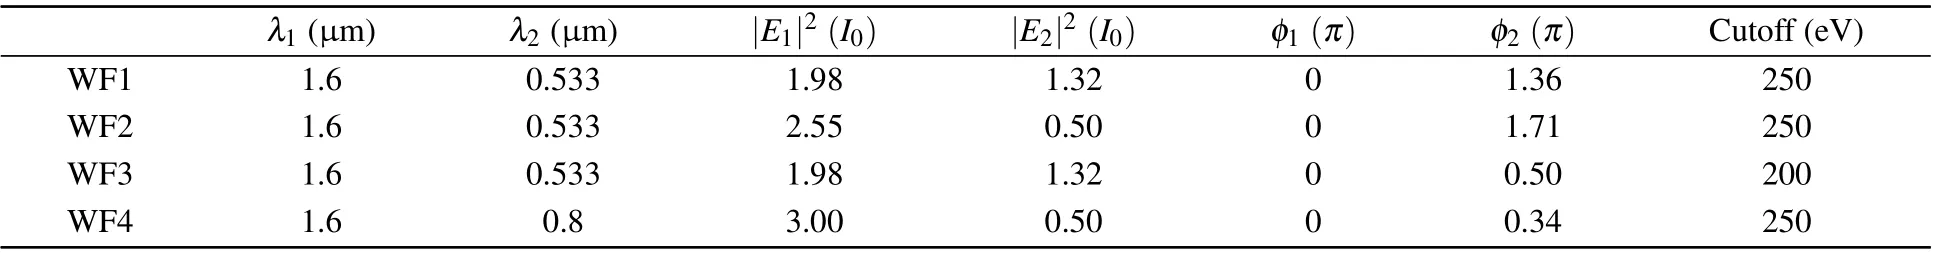
Table 1. Laser parameters of two-color waveforms. WF1,WF2,and WF4 are adopted from Ref.[43],and WF3 is modified from WF1. Cutoff energy of single-atom HHG spectrum by two-color waveform is also given for reference. Here,λi,Ei,and φi (i=1,2)are laser wavelength,amplitude,and CEP for each color. I0=1014 W/cm2.
We first choose WF1 and WF2 for our investigation.These waveforms have been optimized in Ref. [43] for efficiently generating single-atom high harmonics extended to the soft x-ray region up to 250 eV. In WF1, the optimization goal has been set to enhance the harmonic emissions from the“short”trajectory. Its waveform in one optical cycle(o.c.) of 1600-nm laser is shown (red line) in Fig. 2(a), and the timefrequency picture of generated single-atom high harmonics is shown in Fig.2(b). While in WF2,as shown in Fig.2(c),the harmonic emissions from the “long” trajectory are dominant,and its waveform (green line) in Fig. 2(a) is quite different from WF1.If we vary the positions of two-color laser focuses,i.e.,z1andz2in the vacuum,the two-color waveform formed atz=0 mm will also vary.We show the integrated single-atom harmonic yields from 150 eV to 250 eV atz=0 mm as a function ofz1andz2in Fig.2(d)for WF1 and in Fig.2(g)for WF2,respectively. The QRS model is employed to calculate the single-atom HHG. One can see that the change of harmonic yields withz1andz2is quite similar for the two cases, i.e.,in a broad area the integrated harmonic yields remain about the same. Thus only considering the change of peak intensity and CEP in the two-color waveform introduced by the spatial variation of intensity and phase of focused laser beam cannot effectively change the HHG.If we consider a 1-mm-long gas jet centered atz=0 mm, the macroscopic propagation effect becomes important when we change the two laser focuses.We select two gas pressures: a very low one at 10 Torr and a very high one at 300 Torr.For WF1,we show the integrated macroscopic harmonic yields from 150 eV to 250 eV as a function ofz1andz2in Figs.2(e)and 2(f)for gas pressures of 10 Torr and 300 Torr,respectively. Similar results are shown in Figs.2(h)and(i)for WF2. From these figures,one can see that(i)at low gas pressure,the strongest harmonic yields appear when both lasers are focused before the gas jet, i.e.,z1<0 andz2<0;(ii) at high gas pressure, if both lasers are focused after the gas jet,the harmonic yields tend to be substantial;and(iii)the general trends of high-harmonic yields withz1andz2do not differ much for WF1 and WF2. Therefore,for both two-color WF1 and WF2,the macroscopic propagation of HHG is very sensitive to gas pressure.
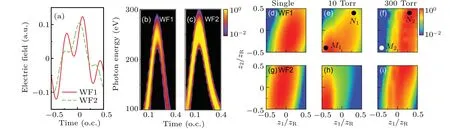
Fig.2. Waveforms of WF1 and WF2(a)for selectly enhancing short-or long-trajectory harmonic emissions,and time-frequency analysis[(b),(c)] of single-atom harmonic emissions with two waveforms. (d)–(i) Integrated single-atom harmonic yields (labeled as “Single”) obtained by the two-color waveform at z=0 mm and integrated macroscopic harmonic yields(labeled with the value of gas pressure)obtained from a 1-mm-long gas jet as a function of two laser focusing positions z1 and z2 (in units of Rayleigh length zR). The results in(d)–(f)are for WF1 while those in(g)–(i)are for WF2. The spectral region of integration is from 150 eV to 250 eV.Here,o.c. means the optical cycle of 1600-nm laser and a.u. means the atomic unit.
Fig.3. The same as Fig.2,but for WF3. Waveform and time-frequency picture are shown in(a)and(b), respectively, and integrated harmonic yields are shown in(c)–(e). A different spectral region of 140–200 eV is adopted for integrating harmonic yields.
To check whether other two-color waveforms perform similarly to WF1 or WF2, we choose WF3 in Table 1. This waveform differs from WF1 by CEP of 533-nm laser component, which is chosen as 0.5π, as shown in one optical cycle of 1600-nm laser in Fig.3(a). Both short and long trajectories contribute to the harmonic emissions, as shown in the timefrequency analysis in Fig. 3(b). The cutoff energy of singleatom HHG from WF3 is reduced to about 200 eV.We present the integrated single-atom harmonic yields from 140 eV to 200 eV atz=0 mm as a function ofz1andz2in Fig. 3(c).This figure is pretty similar to Figs. 2(d) and 2(g). This confirms that the parameter change in the two-color waveform introduced by focused laser beam does not have the considerable effect on the HHG. We then give the integrated macroscopic harmonic yields in the same spectral region in Figs. 3(d) and 3(e) for gas pressures of 10 Torr and 300 Torr, respectively.The results in these two figures are greatly different from those for WF1 and WF2 in Fig. 2. Thus the macroscopic propagation of HHG is also dependent on the two-color waveform.Note that in WF1 and WF2, harmonic emissions from either short or long trajectory are greatly enhanced while comparable harmonic emissions are from both trajectories in WF3.
3.2. Analysis of HHG phase-matching mechanism
3.2.1. Evolution of two-color waveforms in the gaseous medium
To reveal the dependence of soft x-ray high harmonics by two-color waveforms on the macroscopic conditions,we take the results of WF1 as an example for analysis. We choose four cases with very different macroscopic conditions, labeled asM1andN1in Fig. 2(e) andM2andN2in Fig. 2(f), i.e., two lasers focused before or after the gas jet at low and high pressure,respectively. We first examine how the two-color waveform behaves during its nonlinear propagation inside the gas medium. In Figs. 4(a)–4(d), we show the on-axis waveforms in a moving frame (at the speed of light velocity) at the entrance (red lines), the middle (green lines), and the end (blue lines)of gas medium forM1,M2,N1,andN2,respectively.Enlarged views in each figures clearly indicate that the propagation of two-color waveform is quite different under different macroscopic conditions. With these waveforms, we perform the calculations of resulted classical electron trajectories and show the photon energies (i.e., kinetic energies plus ionization potential) of returning electrons as a function of time in Figs.4(e)–4(h). This is an alternative way to illustrate the effect of propagation of two-color waveform. Note that the classical electron trajectories are calculated by solving the equations of Newton’s law of motion. The electron is treated as a classical free particle under the electric field of laser pulse,and the effects of tunneling ionization and Coulomb potential are not included. We assume that the initial position and velocity of the electron are zero,and for each returning electron energy the short and long electron trajectories can be obtained,which are characterized with ionization and recombination times.One can see that forM1andN2, short trajectories at different propagation distances are overlapped,implying that shorttrajectory harmonic emissions can be phase-matched during the propagation. This can explain why the strongest harmonic yields appear atM1andN2in Fig. 2. On the contrary, forM2andN1,long trajectories at different propagation distances are overlapped. Since long-trajectory harmonic emissions are suppressed in WF1, they cannot be accumulated even though they have good phase-matching conditions. Thus one can see relatively weak harmonic yields atM2andN1in Fig.2.
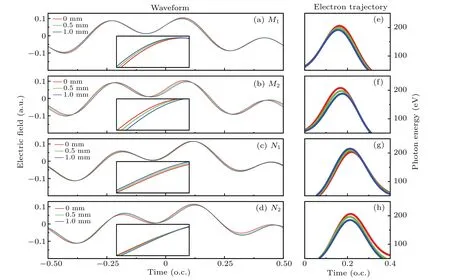
Fig.4. (a)–(d) On-axis two-color waveforms at the entrance (red lines), the middle (green lines), and the exit (blue lines) of gas medium.Enlarged views are shown for the time interval between -0.30 and -0.22 optical cycle (o.c.). (e)–(h) Photon energy (kinetic energy plus ionization potential) of classical returning electron with time, from which short and long trajectories can be distinguished. The results are shown for M1 [(a),(e)],M2 [(b),(f)],N1 [(c),(g)],and N2 [(d),(h)]labeled in Fig.2.
3.2.2. Evolution of time-frequency harmonic emissions and high-harmonic intensities in the gaseous medium
To further illustrate the variation of the phase-matching conditions with the laser focus and gas pressure, we show the evolution of on-axis time-frequency harmonic emissions with the propagation distance in Fig.5. Four propagation distances of 0.25 mm, 0.5 mm, 0.75 mm, and 1.0 mm are chosen for demonstration. Note that the normalization factor is fixed at each macroscopic condition thus the intensities of harmonic emissions can be compared directly at different propagation distances. ForM1, Figs. 5(a)–5(d) show that shorttrajectory harmonic emissions continue to grow up with the propagation distance. ForM2, in Figs. 5(e)–5(h), although short-trajectory harmonic emissions dominate,they cannot be increased with the propagation distance.In Figs.5(i)–5(l),one can see that long-trajectory harmonic emissions can survive during the propagation, however, they are still weaker than phase-mismatched short-trajectory ones.ForN2in Figs.5(m)–5(p), even though both short- and long-trajectory harmonic emissions remain after propagation, short ones are always much stronger than long ones. In Figs. 5(q)–5(t), we show the on-axis harmonic yields at 195 eV with the propagation distance. ForM1andN2, harmonic coherence length is either longer than medium length or longer than half medium length while the harmonic coherence length is much shorter than medium length forM2andN1. These results are in agreement with the characteristics of evolution of time-frequency harmonic emissions,and also in agreement with the behavior of propagation of two-color waveforms in Fig.4.

Fig.5. (a)–(p) Time-frequency analysis of on-axis high-harmonic field at selected propagation distances: 0.2 mm, 0.6 mm, 0.8 mm, and 1.0 mm. Normalization factor in each row is fixed. (q)–(t) Growth of on-axis harmonic field at 195 eV with the propagation distance. The results are shown for M1 [(a)–(d),(q)],M2 [(e)–(h),(r)],N1 [(i)–(l),(s)],and N2 [(m)–(p),(t)]labeled in Fig.2.
3.2.3. Analysis of two-color waveforms influenced by nonlinear effects
The change of phase-matching conditions by varying the laser focus and gas pressure is mainly dominant by the nonlinear propagation of two-color waveform in the gas medium.We next investigate how the nonlinear effects modify the twocolor waveform during its propagation.For a single-color laser with wavelength ofλx,the time shift of temporal pulse over a propagation distance Δzcaused by the variation of refractive index is[54]

Hereηis ionization probability, andδ1,p,N0, andreare atomic dispersion, gas pressure, neutral atomic density, and classical electron radius, respectively. Δtg, Δta, and Δtpare time shifts due to Gouy phase,atomic dispersion,and plasma defocusing, respectively. The Gouy phase termφzcan be expressed as
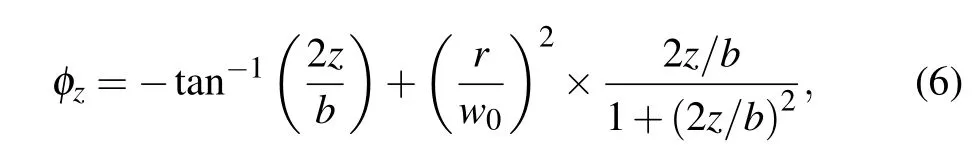
wherebis the confocal parameters,andw0is the beam waist of laser beam.
We take the pointM1for illustration. The values of time shift (from entrance to exit of gas medium) for each wavelength component are listed in Table 2. Here positive (negative) value of time shift represents laser pulse moves faster(slower) than the reference frame. These values are quite different for different wavelength components. For 533-nm laser, Δt=-21.8 as is smaller, while for 1600-nm laser,Δt=-72.8 as is larger since the time shift due to Gouy phase is dominant,which is strongly dependent on laser wavelength.To demonstrate how these nonlinear effects modify the twocolor waveform,we plot the electric field of driving two-color laser pulse at the entrance(red line)and exit(blue line)of gas cell in Fig. 6(a). These waveforms are obtained by numerically solving Maxwell’s propagation equation of driving laser.Then, we shift the electric field at the entrance according to the values of time shift in Table 2 to see if it can be overlapped with the electric field at the exit. The steps are stated as follows: First,we separate two wavelength components(in frequency) of entrance two-color waveform and obtainEi(t)(i=1,2) (in time) individually. Second,Ei(t) is shifted according to Δtfor each color, and then added up coherently to obtain the time-shifted two-color waveform. The resulted waveform(black dashed line)is plotted in Fig.6(a),and it perfectly overlaps with the electric field at the exit. We then take another pointN1. The similar analysis is carried out. According to the values of time shift in Table 3,the shifted two-color waveform at the entrance agrees very well with the waveform at the exit as shown in Fig. 6(b). Thus, the change of twocolor waveform upon propagation in the gas medium caused by nonlinear effects can be well understood by decomposing the change of refractive index(or time shift)due to each nonlinear term for individual color component.
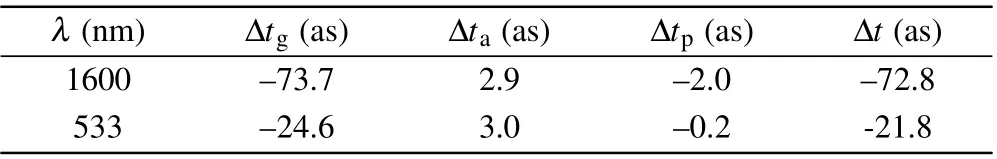
Table 2. Total time shift (Δt) of each color in two-color waveform after propagating 1 mm in the gas cell, and respective time shifts caused by geometric phase(Δtg),neutral atomic dispersion(Δta),and plasma dispersion(Δtp) are also given. Gas pressure is 10 Torr and ionization probability at the end of laser pulse is 0.15%. These values are used to mimic the change of two-color waveform at M1. Note that ionization probability is chosen according to that during the propagation in the gas jet.

Table 3. The same as Table 2 but ionization probability is 1.2%. This table is used to mimic the change of two-color waveform at N1.
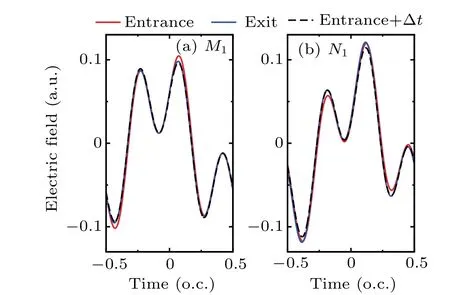
Fig.6. The on-axis two-color waveform at the entrance(red solid line)is shifted(black dashed line)according to the values of time shift in Table 2 or Table 3,which agrees well with the waveform at the exit(blue solid line). The results are shown for M1 (a)and N1 (b).
3.3. Simulated high harmonics with two-color waveform consisting of 1600-and 800-nm lasers
We finally check whether the dependence of harmonic yields on laser focus is changed using a two-color waveform with different wavelength components. We choose an optimized two-color waveform consisting of 1600-nm and 800-nm lasers from Ref.[43]. Its parameters are given in Table 1,and it is labeled as WF4. This waveform has been optimized for enhancing short-trajectory harmonic emissions and for extending the harmonic spectral region into soft x-rays in the singleatom response level. Its waveform is plotted in Fig. 7(a),and resulted time-frequency harmonic emissions are given in Fig. 7(b). The beam waist of 800-nm laser is set as 50 μm to ensure that it has the same Rayleigh length as the 1600-nm laser. Similar to Fig. 2, we show the integrated single-atom harmonic yields atz=0 mm a function of two laser focusing positions ofz1andz2in Fig.7(c). The integrated macroscopic harmonic yields withz1andz2are shown in Figs. 7(d) and 7(e) for gas pressures of 10 Torr and 300 Torr, respectively.One can see that the general trends of change of harmonic yields with two laser focusing positions are very similar to those in Fig. 2. The similar physical mechanism can be expected that only short or long trajectory harmonic emissions alone are preferably phase matched when the two-color waveform is propagated in the gas medium. Here the short trajectory harmonic emissions are dominant in the single-atom response.

Fig.7. The same as Fig. 3 but for WF4. The spectral region for integrating harmonic yields is chosen in the range 150–250 eV.
4. Conclusion
In summary, we have thoroughly studied the effect of laser focus on the generation of soft x-ray high harmonics when a two-color laser waveform is applied to interact with a macroscopic gas medium. We first choose three different two-color waveforms consisting of 1600-nm laser and its third harmonic field. It is found that if there are only short or long trajectory harmonic emissions dominant in the single-atom response under the two-color waveform, the resulted macroscopic HHG yields in the soft x-rays will have similar behaviors. At very low pressure the HHG yields are much stronger when both lasers are focused before the gas jet while they tend to have optimal ones when both lasers are focused after the gas jet at a very high pressure.If two electron trajectories have comparable contributions to the single-atom HHG,the dependence of macroscopic HHG yields on the laser focus becomes irregular. We then examine the propagation of two-color waveform in the gas medium under four selected conditions and reveal that either short-trajectory harmonic emissions or long-trajectory ones can be phase matched by calculating the classical trajectory of returning electron. We also check the phase-matching conditions of HHG by looking at the evolution of time-frequency analysis of high-harmonic fields and HHG yields at a selected photon energy along the propagation distance. We further demonstrate that the time shift of laser pulse caused by geometric phase, neutral atomic dispersion,and plasma dispersion can quantitatively reproduce the propagated two-color waveform in the gas medium. We finally show that two-color waveforms by 1600-nm laser and its second harmonic field have similar dependence of macroscopic HHG yields on laser focus to the 1600+533 nm waveform.The common thing between them is that short-trajectory harmonic emissions are greatly enhanced in the single-atom HHG response when they are optimized. We expect that this work can help experimentalists to identify the optimal macroscopic conditions for efficiently generating soft x-ray high harmonics when the technology of multi-color synthesized waveform is applied.[37,58–61]
Acknowledgements
Project supported by the National Natural Science Foundation of China (Grant Nos. 91950102, 12274230, and 11834004)and the Funding of Nanjing University of Science and Technology(Grant No.TSXK2022D005).
猜你喜欢
杂志排行

Chinese Physics B的其它文章
- The coupled deep neural networks for coupling of the Stokes and Darcy–Forchheimer problems
- Anomalous diffusion in branched elliptical structure
- Inhibitory effect induced by fractional Gaussian noise in neuronal system
- Enhancement of electron–positron pairs in combined potential wells with linear chirp frequency
- Enhancement of charging performance of quantum battery via quantum coherence of bath
- Improving the teleportation of quantum Fisher information under non-Markovian environment