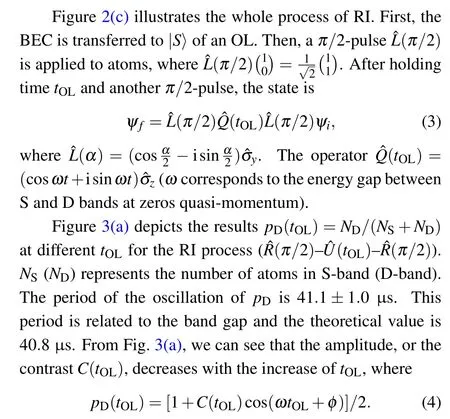
Improve the performance of interferometer with ultra-cold atoms*
2021-01-21XiangyuDong董翔宇ShengjieJin金圣杰HongmianShui税鸿冕PengPeng彭鹏andXiaojiZhou周小计
Xiangyu Dong(董翔宇), Shengjie Jin(金圣杰), Hongmian Shui(税鸿冕), Peng Peng(彭鹏), and Xiaoji Zhou(周小计)
State Key Laboratory of Advanced Optical Communication Systems and Networks,Department of Electronics,Peking University,Beijing 100871,China
Keywords: precision measurement,ultra-cold atoms,atom interferometer,gravity measurements
1. Introduction
With the superiority mentioned above,it is better to consider an interferometer by ultra-cold atoms for further precision measurements. Interferometers with atoms propagating in free fall are ideally suited for inertia measurements.[17–23]Meanwhile, with atoms held in tight traps or guides, they are better to measure weak localized interactions. For example,a direct measurement to the Casimir–Polder force is performed by I. Carusotto et al. in 2005, which is as large as 10-4gravity.[24]However,ultra-cold atoms still get some imperfections needed to be surmounted when combining with interferometry. The macroscopic matter-wave property is generated simultaneously with non-linear atom–atom interactions.Phase diffusion caused by interactions limits the coherence time,and ultimately restricts the sensitivity of the interferometers. Besides the interrogation time, the momentum splitting as well as the path number also has an impact on the sensitivity. It has been demonstrated by experiments of multipath interferometers that, interferometric fringes can be sharpened due to the higher-harmonic phase contributions of the multiple energetically equidistant Zeeman states,[25,26]whereas a decrease in the average number of atoms per path causes a greater susceptibility to shot noise. Equilibrium between these parameters could lead to an optimal resolution. In addition, we should also pay attention to the signal analysis procedure as the interferometric information is mainly extracted from the signal detected. The resulting resolution severely relies on the probing system.
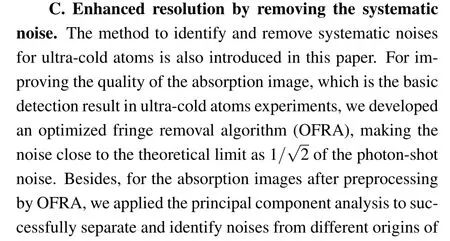
In this review,we mainly introduce our experimental developments that study these fundamental and important issues to improve the performance of the interferometer with ultracold atoms. The main developments are concentrated in three aspects: increasing coherent time, using multimode scheme,and reducing systematic noises.
A. Enhanced resolution by increasing coherent time.We introduce an effective and fast(few microseconds)method,for manipulating ultra-cold atoms in an optical lattice (OL),which can be used to construct the atom interferometer and increase the coherent time to finally get a higher resolution.This shortcut loading method is a designed pulse sequence,which can be used for preparing and manipulating arbitrary pure states and superposition states. Another advantage of this method is that the manipulation time is much shorter than that in traditional methods(around 100 ms →100 μs). Based on this shortcut method, we constructed an echo-Ramsey interferometer (RI) with motional Bloch states (at zero quasimomentum on S- and D-bands of an OL).[27]Thanks to the rapidity of shortcut methods,more time could be used for the RI process. We identified the mechanisms that reduced the RI contrast, and greatly increased the coherent time (1.3 ms→14.5 ms)by a quantum echo process,which eliminated the influence of contrast attenuation mechanisms mostly.
B. Enhanced resolution by multimode scheme. Several efforts have been made to avoiding the decays of the interferometric resolution because of the experimental noises.We demonstrated that the improvement of the phase resolution could be accomplished by a noise-resilient multi-component interferometric scheme. With the relative phase of different components remaining stable,increasing the number of paths could sharpen the peaks in the interference fringes,which led to a resolution nearly twice compared with that of a conventional double-path two-mode interferometer. Moreover, improvement of the momentum resolution was fulfilled with optical lattice pulses. We got results of atomic momentum patterns with intervals less than the double recoil momentum.The momentum pattern exhibited 10 main peaks.
2. Enhanced resolution by increasing coherent time
The macroscopic coherent properties of ultra-cold atoms[28–38]are conducive to precise measurement. To make full use of the advantages of ultra-cold atomic coherence properties,one method is to reduce the manipulation time and another is to suppress the attenuation of coherence.
Firstly, we demonstrated a shortcut process for manipulating BECs trapped in an OL.[39–41]By optimizing the parameters of the pulses,which constitute the sequence of the shortcut process,we can get extremely high fidelity and robustness for manipulating BECs into the desired states, including the ground state,the excited states,and the superposition states of one-, two-, or three-dimensional OLs. Another advantage of this method is that the manipulation time is much shorter than that in traditional methods.
This shortcut is composed of optical lattice pulses and intervals that are imposed on the system before the lattice is switched on. The time durations and intervals in the sequence are optimized to transfer the initial state to the target state with high fidelity.This shortcut procedure can be completed in several tens of microseconds,which is shorter than that in the traditional method(usually hundreds of milliseconds). It can be applied to the fast manipulation of the superposition of Bloch states.
Then, based on this method, we constructed an echo-Ramsey interferometer (RI) with motional Bloch states (at zero quasi-momentum on S- and D-bands of an OL).[27]The key to realizing a RI is to design effective π-and π/2 pulses,which can be obtained by the shortcut method.[39,42,43]Thanks to the rapidity of the shortcut methods,more time can be used for the RI process. We identified the mechanisms that reduced the RI contrast,and greatly increased the coherent time(1.3 ms→14.5 ms)by a quantum echo process,which eliminated the influence of most contrast attenuation mechanisms.
2.1. Shortcut manipulating ultra-cold atoms
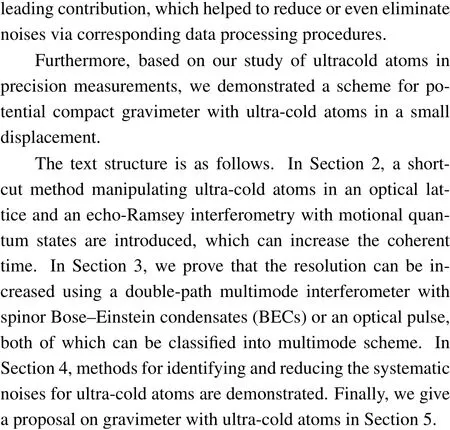
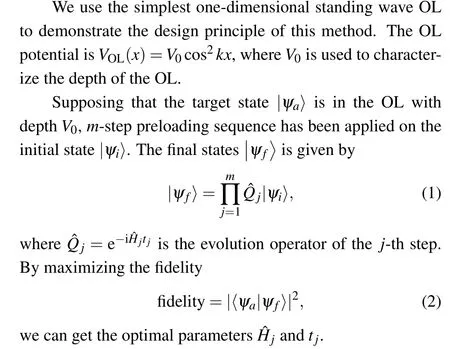
Efficient and fast manipulation of BECs in OLs can be used for precise measurements, such as constructing atombased interferometers and increasing the coherent time of these interferometers. Here we demonstrate an effective and fast (around 100 μs) method for manipulating BECs from an arbitrary initial state to a desired OL state. This shortcut method is a designed pulse sequence, in which the parameters,such as duration and interval of each step,are optimized to maximize fidelity and robustness of the final state.With this shortcut method,the pure Bloch states with even or odd parity and superposition states of OLs can be prepared and manipulated. In addition,the idea can be extended to the case of twoor three-dimensional OLs. This method has been verified by experiments many times and is very consistent with the theoretical analysis.[27,29,42,44–48]

Fig.1. Schematic diagram of the shortcut method(take ground state preparation as an example). (a)At the beginning,the BECs are formed in a weak harmonic trap. (b)Time sequence of the shortcut method. (c)Mapping the shortcut process onto the Bloch sphere. Track A →C →|S〉and track A →B →E →M →|S〉represent one pulse and two pulses shortcut processes,respectively.(d)After this shortcut process,the desired states of an 3D optical lattice are prepared. (e)Band structure of 1D OL with different quasi-momentum q when V0=10 Er. Reproduced with permission from Ref.[39].
This preprocess is called a shortcut method,which can be used for loading atoms into different bands of an optical lattice. For example, the shortcut loading ultra-cold atoms into S-band in a one-dimensional optical lattice is shown in Fig.1.
By setting different initial state and target state, different time sequences can be designed to manipulate atoms, to build different interferometers,which greatly saves the coherent time. Based on this shortcut method, we can prepare exotic quantum states[3,39,49]and construct interferometer with motional quantum states of ultra-cold atoms.[27]
2.2. Increasing coherent time in a Ramsey interferometry with motional Bloch states of ultra-cold atoms
Suppressing the decoherence mechanism in the atom interferometer is beneficial for increasing the coherence time and improving the measurement accuracy. Here we demonstrated an echo method that can increase the coherent time for Ramsey interferometry with motional Bloch states(at zero quasi-momentum on S- and D-bands of an OL) of ultra-cold atoms.[27]The RI can be applied to the measurement of quantum many-body effects.The key challenge for the construction of this RI is to achieve π-and π/2-pulses,because there is no selection rule for Bloch states of OLs.The π-or π/2-pulse sequences can be obtained by the shortcut method,[39–43]which precisely and rapidly manipulates the superposition of BECs at the zero quasi-momentum on the 1st and 3rd Bloch bands.Retaining the OL,we observed the interference between states and measured the decay of coherent oscillations.
We identified the mechanisms that reduced the RI contrast: thermal fluctuations, laser intensity fluctuation, transverse expansion induced by atomic interaction, and the nonuniform OL depth. Then, we greatly increased the coherent time (1.3 ms →14.5 ms) by a quantum echo process,which eliminated the influence of most contrast attenuation mechanisms.
2.2.1. Ramsey interferometer in an optical lattice

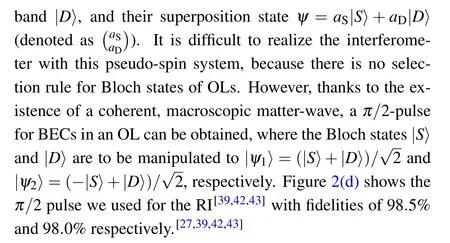
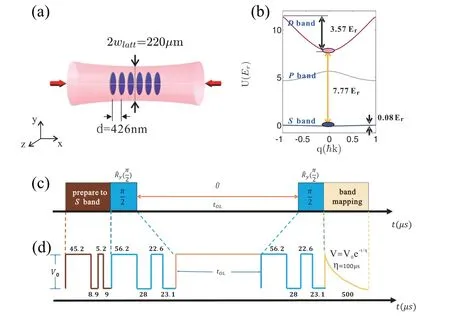
Fig. 2. Experimental configuration for a Ramsey interferometer in a V0 =10 Er lattice: (a) The BEC is divided into discrete pancakes in yz plane by a one-dimensional optical lattice along x axis with a lattice constant d =426 nm. (b) Band energies for the S-band and the D-band. (c) Time sequences for the Ramsey interferometry.The atoms are first loaded into the S band of OL, followed by the RI sequence: π/2 pulse, holding time tOL,and the second π/2 pulse. Finally band mapping is used to detect the atom number in the different bands. (d)The used pulse sequences designed by an optimized shortcut method. Reproduced with permission from Ref.[27].
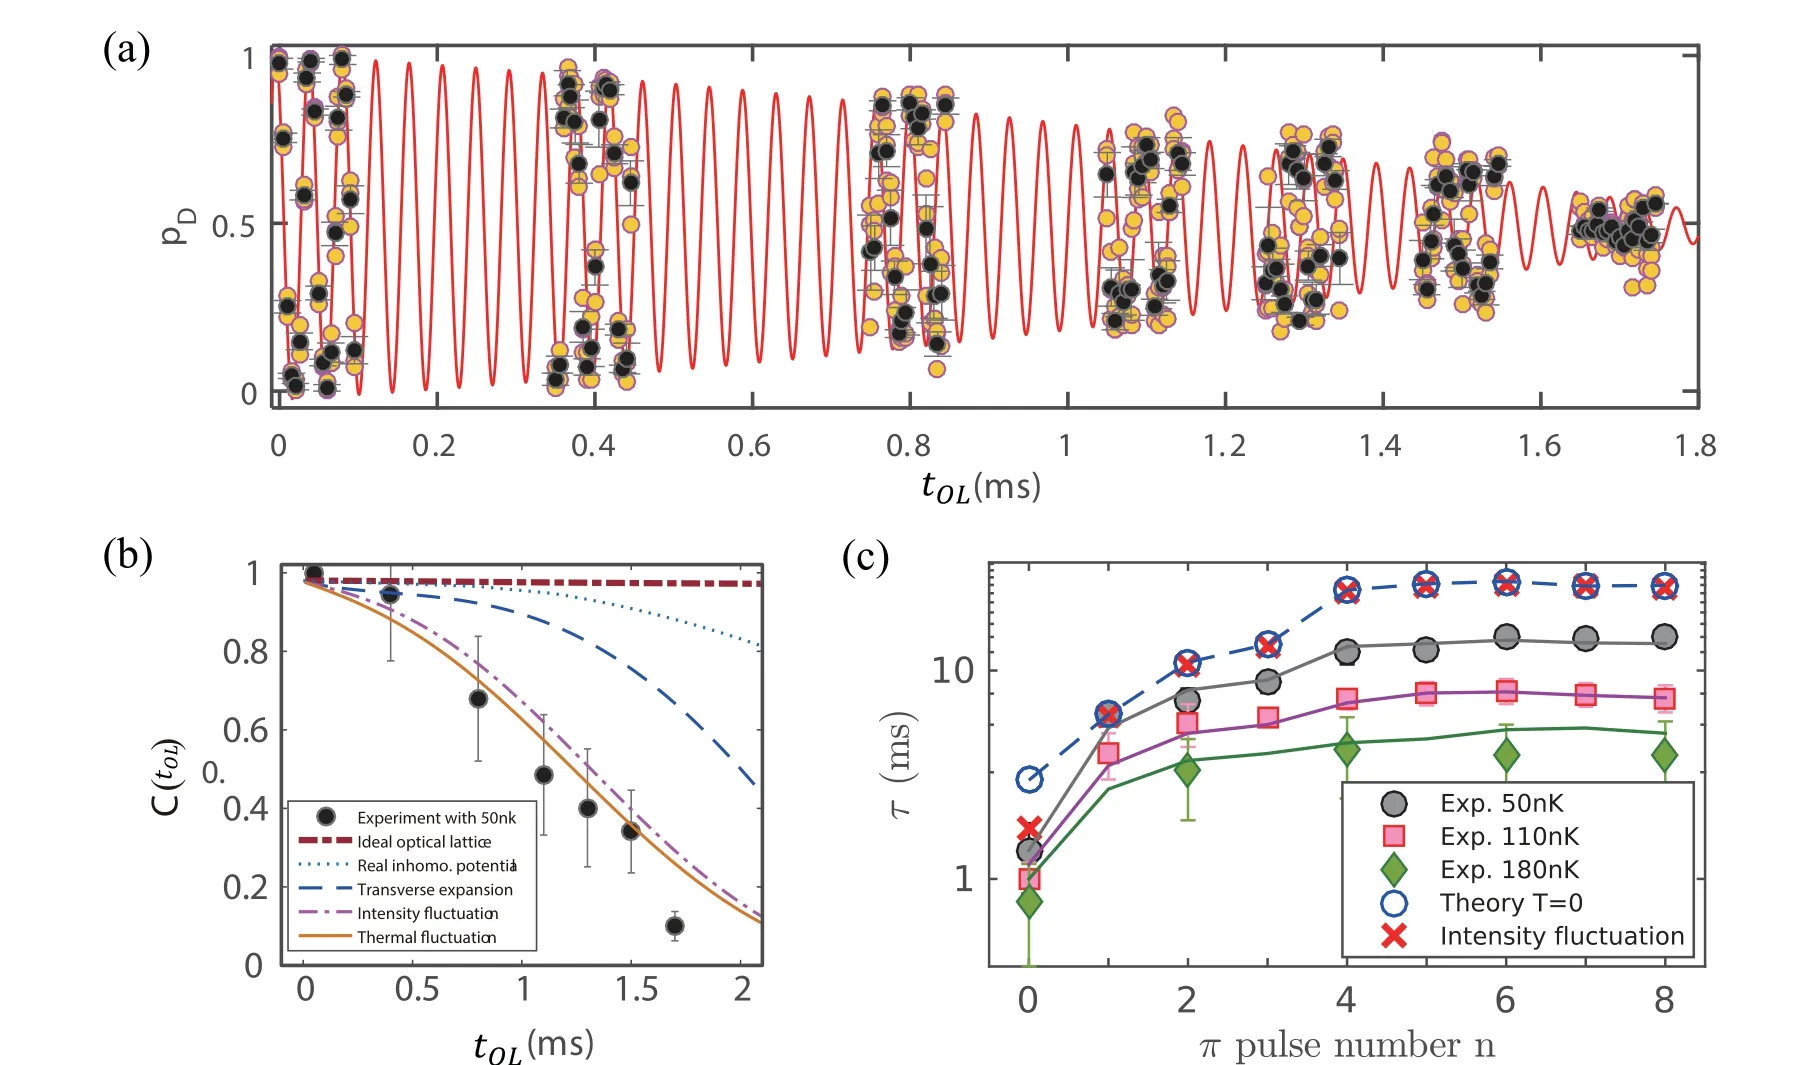
Fig. 3. (a) Change of pD, the population of atoms in the D-band, over time tOL with temperature T =50 nK. (b) Influence of different mechanisms on the RI. (c) Characteristic time τ for the different number of π pulse n and different temperatures. The circles, squares, and diamonds represent the experimental results and lines are fitting curves. Reproduced with permission from Ref.[27].
We defined a characteristic time τ,which corresponds to the time when the C(tOL) decreases to 1/e. Temperature can affect the length of τ.
2.2.2. Contrast decay mechanisms
To improve RI’s coherent time and performance, we should analyze the mechanisms that cause RI signal attenuation. By solving the Gross–Pitaevskii equation(GPE),which considers the mechanism that may lead to decay, we can get the process of contrast decay in theory.In Fig.3(b),the following mechanisms are introduced in turn: the effect of the imperfection of the π/2 pulse(brown dashed line),the inhomogeneity of the laser wavefront(blue dotted line),the transverse expansion caused by the many-body interaction (blue dashed line),the laser intensity fluctuation(dash-dotted line),and the thermal fluctuations(orange solid line). Figure 3(b)illustrates that the theoretical (the orange solid line) and experimental(black dots)curves of the final result are very consistent.
2.2.3. An echo-Ramsey interferometer with motional Bloch states of BECs
In order to extend the coherence time τ, we proposed a quantum echo method. The echo process refers to a designed π pulse (ˆL(π)) that flips the atomic populations of the two bands. So the evolution operator of echo-RI is ˆL(π/2)[ˆQ(tOL/2n)ˆL(π)ˆQ(tOL/2n)]nˆL(π/2), where n is the number of the π pulses inserted between the two π/2 pulses.
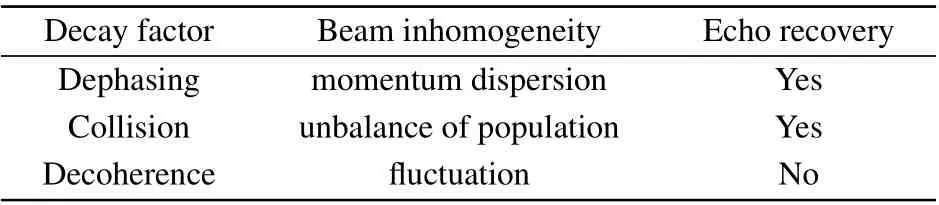
Table 1. The effects for the contrast decay.
Figure 3(c)illustrates the characteristic time τ for different n and temperatures. And the effects for the contrast decay are listed in Table 1. It can be seen from Fig.3(c)that the interferometer with the longest characteristic time(14.5 ms)was obtained when n ≥6 and T =50 nK.
3. Enhanced resolution by multimode scheme
As an essential indicator,the resolution evaluates the performance of interferometers.The resolution is theoretically restricted to shot-noise limit,or sub-shot noise limit,[55,56]however,it will decay easily due to other experimental noises,with those upper limits beyond reach. Therefore, we have made several efforts to increase the resolution in practice. Improvement of the phase resolution was accomplished by a noiseresilient multi-component interferometric scheme. With the relative phase of different components remaining stable, increasing the number of paths could sharpen the peaks in the interference fringes, which leads to a resolution nearly twice compared with that of a conventional double-path two-mode interferometer with hardly any attenuation in visibility. Moreover, improvement of the momentum resolution is fulfilled with optical lattice pulses. Under the condition of 10 EROL depth, atomic momentum patterns with interval less than the double recoil momentum can be achieved,exhibiting 10 main peaks, respectively, where the minimum one we have given was 0.6. The demonstration of these techniques is shown in the next four subsections.
3.1. Time evolution of two-component Bose–Einstein condensates with a coupling drive
For the multicomponent interferometer, it is necessary to study the interference characteristics of multi-component ultra-cold atoms. Here we introduced a basic method to deal with this problem, which simulates the time evolution of the relative phase in two-component Bose–Einstein condensates with a coupling drive.[57]
We considered a two-component Bose–Einstein condensate system with weak nonlinear interatomic interactions and coupling drive. In the formalism of the second quantization,the Hamiltonian of such a system can be written as

Previous analysis can be used to simulate the time evolution of the relative phase in two-component Bose–Einstein condensates with a coupling drive, as well as to study the interference of multi-component ultra-cold atoms. This simulation would help to construct a multimode interferometer of a spinor BEC(see Subsection 3.3).
3.2. Parallel multicomponent interferometer with a spinor Bose–Einstein condensate
Revealing the wave–particle duality, Young’s double-slit interference experiment plays a critical role in the foundation of modern physics. Other than quantum mechanical particles such as photons or electrons which had been proved in this stunning achievement, ultra-cold atoms with long coherent time have got the potential of precision measurements when utilizing this interferometric structure. We have demonstrated a parallel multi-state interferometer structure[61]in a higher spin atom system,[62–64]which was achieved by using our spin-2 BEC of87Rb atoms.
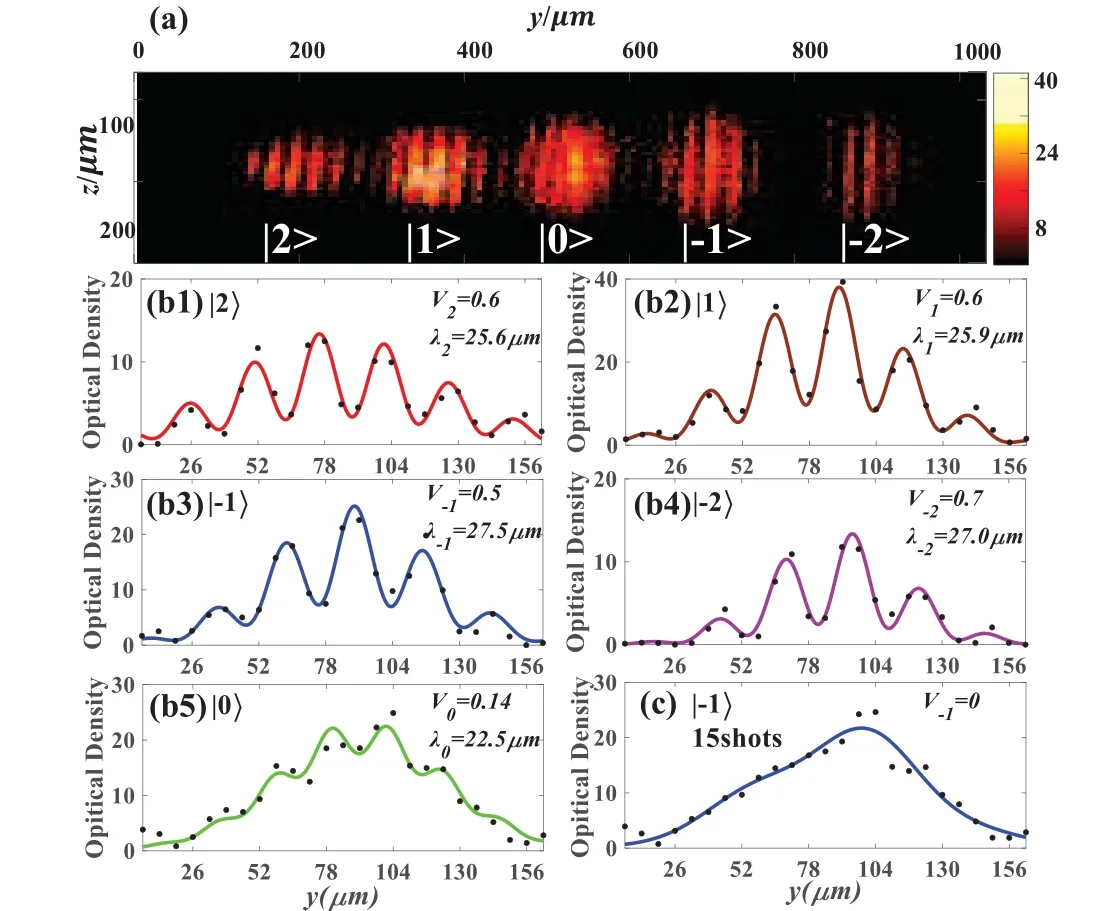
Fig. 4. (a) One typical interference picture. These spatial interference fringes come from the five sub-magnetic states of |F =2〉 hyperfine level.(b) Density distributions corresponding to different sub-magnetic components,respectively,where the points are the experimental data and the curves are fitting results according to the empirical expression.[58–60] (c) Average of 15 consecutive experimental shots with a visibility reduction to zero for the chosen state|mF =-1〉. Reproduced with permission from Ref.[61].
The experimental scheme is described as following.After the manufacture of Bose–Einstein condensates in an opticalmagnetic dipole trap, we switched off the optical harmonic trap and populated the condensates from|F =2,mF=2〉state to |mF=2〉and |mF=1〉sub-magnetic levels equally. After the evolution in a gradient magnetic field for time t1,these two wave packets were converted again into multiple mFstates(mF=±2,±1,0) as our spin states, leading to the so-called parallel path. All these states were allowed to evolve for another period time t2,then the time-of-flight(TOF)stage t3for absorption imaging. Spatial interference fringes had been observed in all the spin channels. Here, we used the technique of spin projection with Majorana transition[65–67]by switching off the magnetic field pulses nonadiabatically to translate the atoms into different Zeeman sublevels. The spatial separation of the atom cloud in different Zeeman states was reached by Stern–Gerlach momentum splitting in the gradient magnetic field.
A typical picture after 26 ms TOF is shown in Fig.4(a).Figures 4(b1)–4(b5)are the density distributions for the interference fringes.To reach the maximal visibility,we studied the correlation between the interference fringes’visibility and the time interval applying Stern–Gerlach process. Though separated partially,the interfering wave pockets must overlap in a sort of way. The optimal visibility was about 0.6,corresponding to t1=210 μs and t2=1300 μs. We also measured the fringe frequencies of different components,which exhibited a weak dependence on mF.
Special attention is required in Fig.4(c). After an average of 15 consecutive CCD (charge coupled devices) shots in repeated experiments,the interference fringe almost disappeared for the chosen state|mF=-1〉.This result manifested that the phase difference between the two copies of each component in every experimental run is evenly distributed. The poor phase repeatability could be attributed to uncontrollable phase accumulation in Majorana transitions.
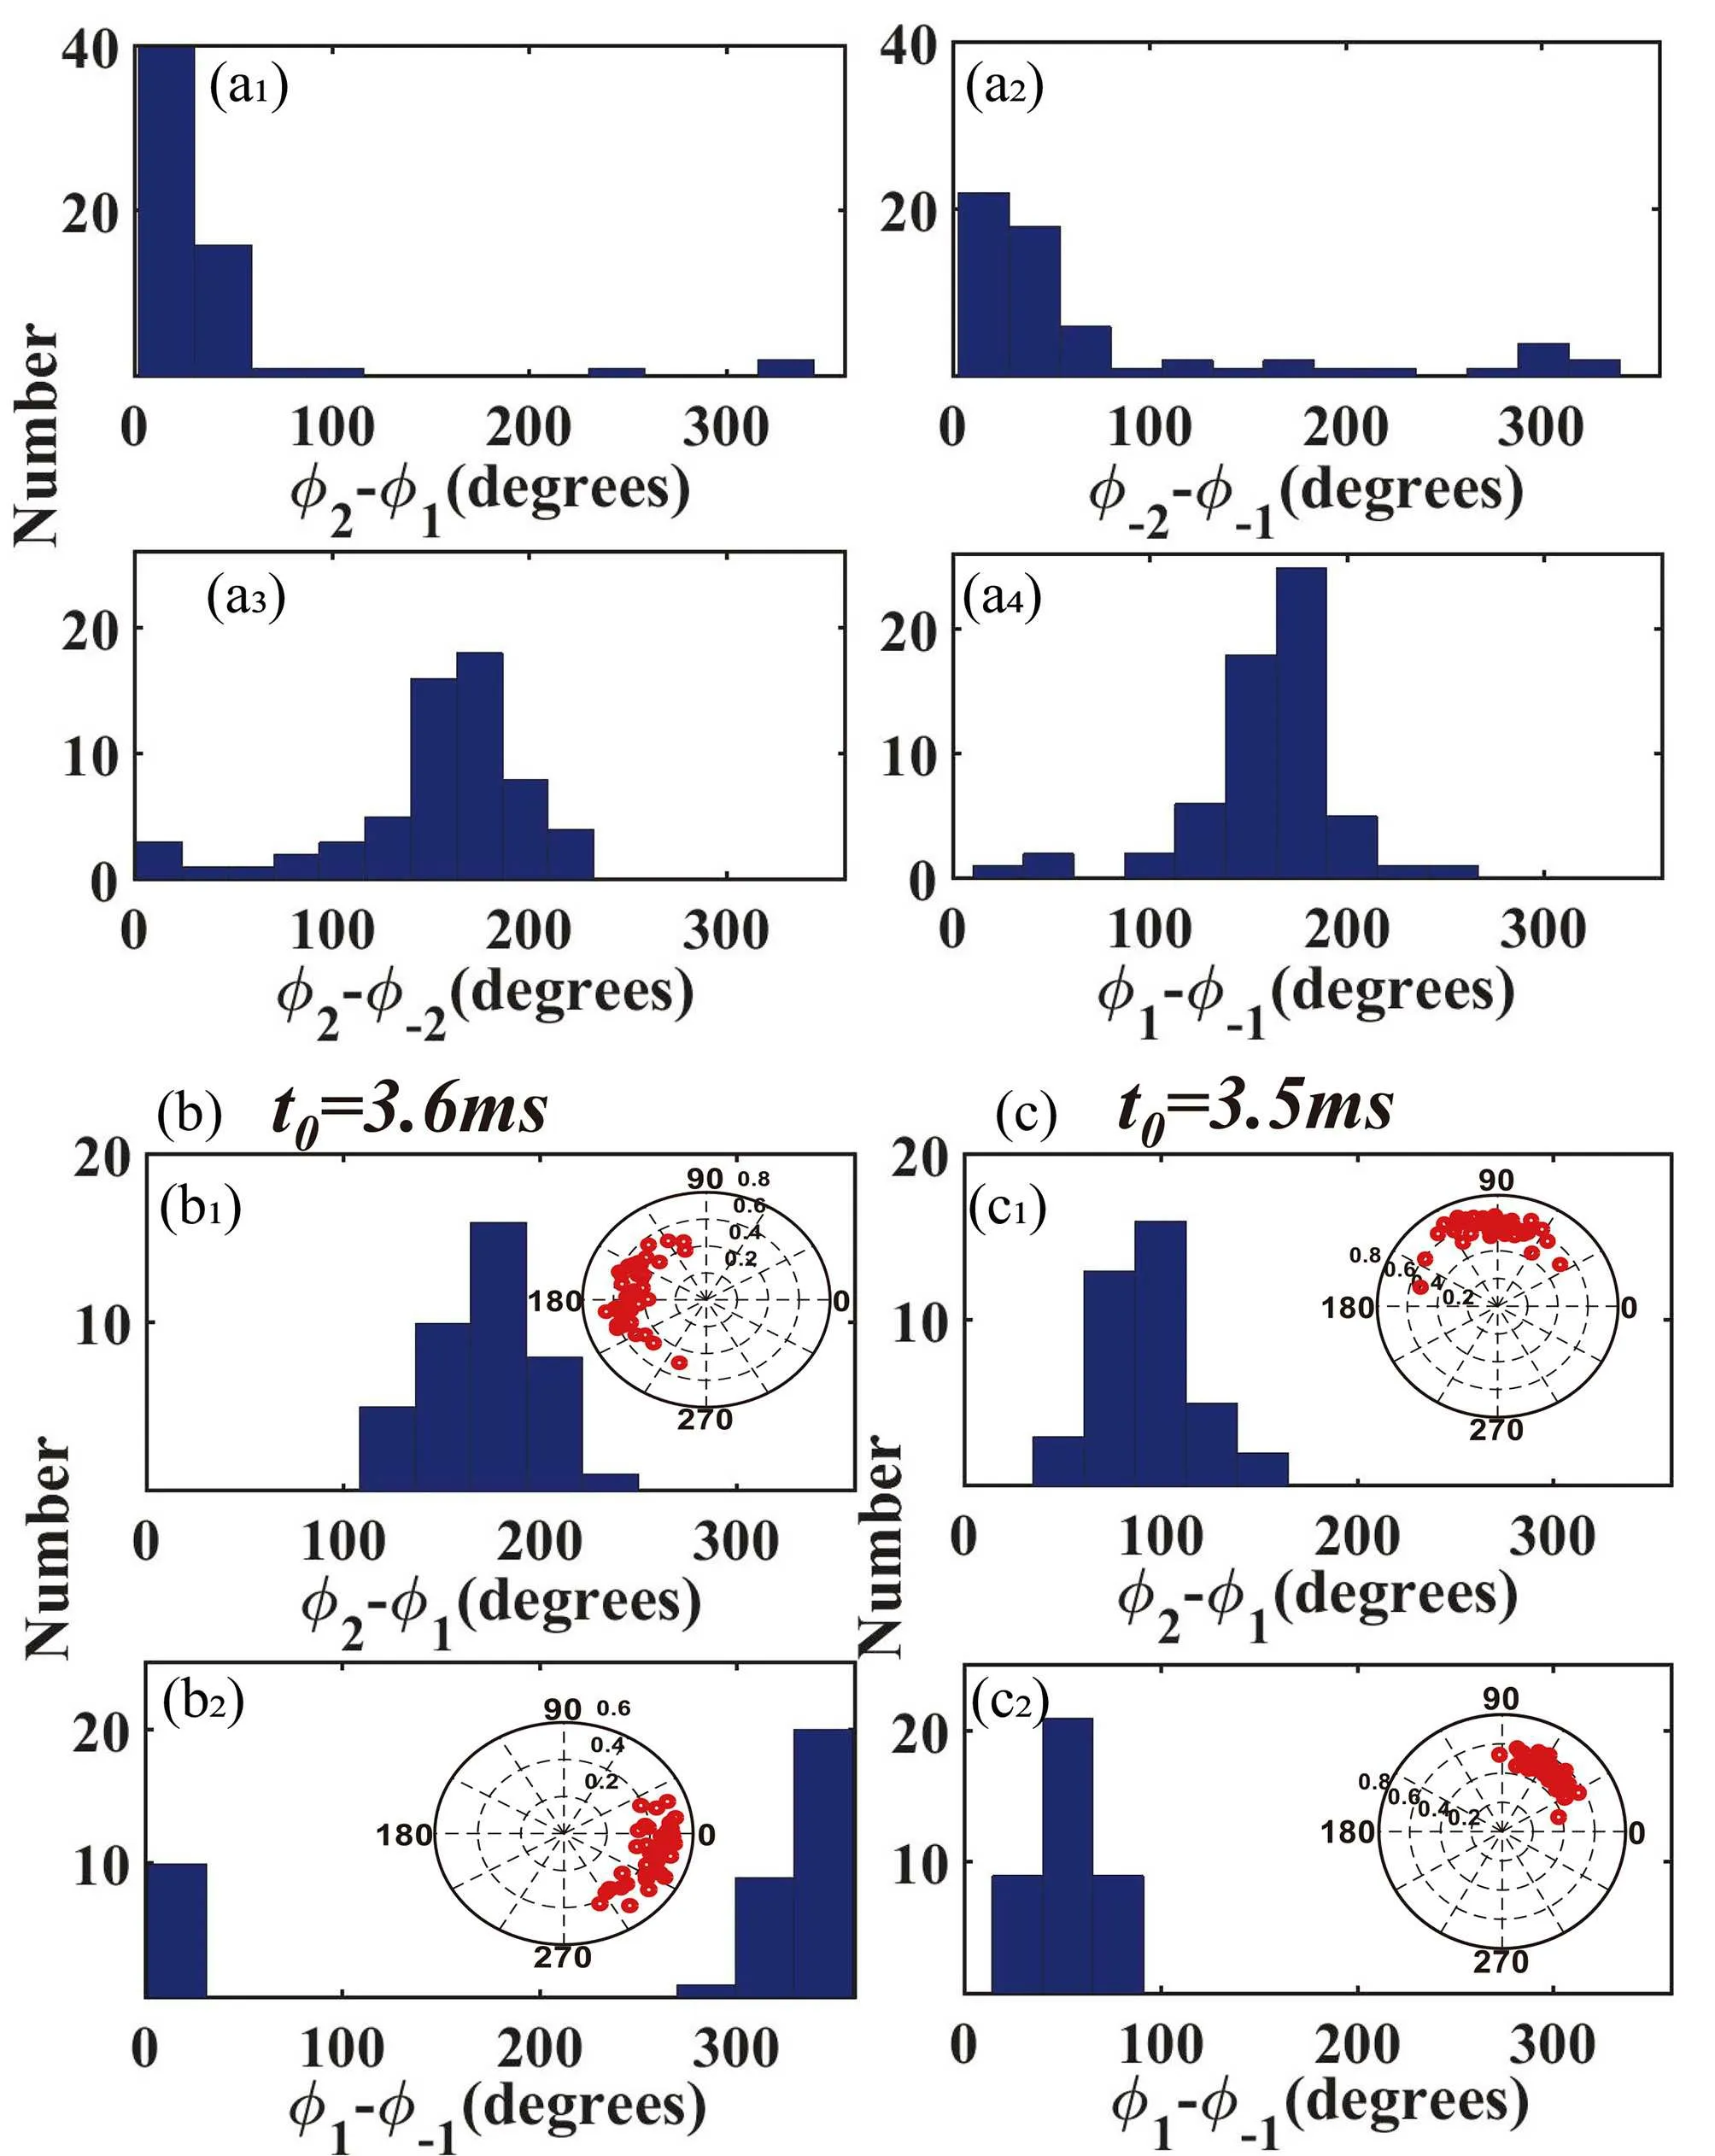
Fig.5. (a1)–(a4)Histograms of relative phases distributions(φ2-φ1,φ-2-φ-1,φ2-φ-2,and φ1-φ-1)respectively. These relative phases show good reproducibility,for the first two are concentrated at about 0◦,while the latter two are concentrated at about 180◦in 61 consecutive experimental shots.(b) Relative phase distributions of 41 consecutive experimental shots with t0=3.6 ms. Distributions of relative phases φ2-φ1 and φ1-φ-1 are shown in (b1) and (b2). (c) When t0 = 3.5 ms, distributions of relative phases φ2-φ1 and φ1-φ-1 are shown in (c1) and (c2). The polar plots of relative phase vs. visibility(shown as angle vs. radius)are shown as the insets,respectively, where the value of visibility is an average of the visibility involved in calculation. Reproduced with permission from Ref.[61].
However, the relative phase across the spin components remained the same after more than 60 continuous experiments,just as Fig. 5(a) illustrates. Furthermore, evidence has been spotted that the relative phase can be controlled by changing the time t0before the first Majorana transition, as shown in Figs.5(b)and 5(c),paving a way towards noise-resilient multicomponent parallel interferometer or multi-pointer interferometric clocks.[60]
3.3. Implementation of a double-path multimode interferometer using a spinor Bose–Einstein condensate
The experiment described above was achieved by Stern–Gerlach momentum splitting, separating the wave pockets in different spin states or Zeeman sub-magnetic states in space.The conclusion that relative phases across the spin components remain stable gives us an inspiration to carry on the double-path multimode matter wave interferometer scheme.With the number of paths increased,it will suppress the noise and improve the resolution[25,26,69–72]compared with the conventional double-path single-mode structure.The results show that the resolution of the phase measurements is increased nearly twice in time domain interferometric fringes.[68]
The experimental procedure is similar to the previous one. The major difference lies in the splitting stage, the optical harmonic trap participating in the preparation of the condensates is not going to switch off until the TOF stage, thus the Stern–Gerlach process in the gradient magnetic field mentioned above cannot significantly split the wave packets. The atomic clouds with different momentum are spatially separated only for tens of nanometers, approximately 1% of the BEC size,thus they are well overlaped.[59]As a result,multimodes from two paths will interfere in one region instead of five. Another difference lies in the second spin projection with non-adiabatic Majorana transition. Here we replace it with a radio frequency pulse for its higher efficiency as a 1 to 5 beam splitter, although we still use it to transfer the initial condensates into |mF=2〉 and |mF=1〉 sub-magnetic levels. The performance of Majorana transition is better than RF pulse as a 1 to 2 beam splitter.There are also some changes with experimental parameters that count a little and we would not discuss them here.
Hence the global view of our interferometer is as follows:The magnetic sublevels are considered as modes in the interferometer, each has its own different phase evolution rate in gradient magnetic field. The double-path configuration is made up of Majorana transition as well as the evolution of the first two mFsuperposed states during time Td,makes up path I and path II. The RF pulse leading to the multiple mFsuperposed states together with their evolution in time TNforms the multi-modes configuration. During the TOF stage,the atomic clouds expand and interfere with each other. Owing to the different state-dependent phase evolution rate ω(I,II)mF, the absorption image shows something more than spatial interference fringes, which is a periodic dependence of the visibility on the phase evolution time as the function VN(Td,TN). We refer to it as the time domain interference.
Figure 6(a)shows a group of absorption images with various combinations of Tdand TN.The observed fringe is a superposition of the interference fringes of different modes. Consequently,the visibility depends on the relative phase Δφ(Td,TN)between the interference fringes of each mode[Fig.6(c)]and can also be modulated.
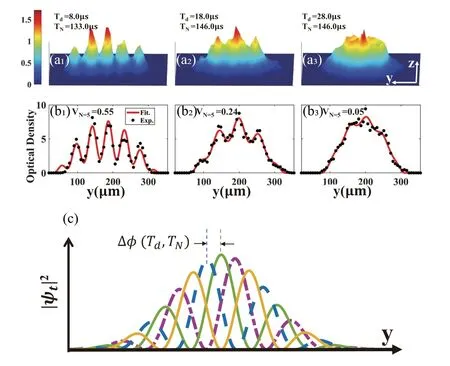
Fig. 6. (a1)–(a3) Single-shot spatial interference pattern with five interference modes after TOF = 26 ms. Fringes of each mode are (a1) in phase(a2)partially in phase(a3)complementary in space. (b1)–(b3)Black points are the experimental data by integrating the image in panels(a1)–(a3)along the z direction. Red solid lines are fitted by Thomas–Fermi Distribution.[59]Visibilities are 0.55,0.24,and 0.05,respectively. (c)Schematic of the spatial interference image. Δφ(Td,TN) is the relative phase between adjacent mode fringes. The fringe in each color represents the interference between the two wave packets of a single mode. Reproduced with permission from Ref.[68].
By carefully analyzing with expression VN(Td,TN) =〈Ψ(I)|Ψ(II)〉,[34]we can acquire the expression of the relative phase between two adjacent components
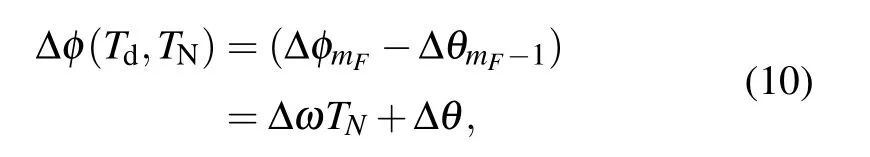
where Δω is the relative phase evolution rate between the two paths, and Δθ is the relative initial phase introduced through the double path stage Td. Yet we have already demonstrated that the visibility VNis modulated with the period 2π/Δω along with how the time domain fringe emerges theoretically.
A remarkable feature of the multi-modes interferometer is the enhancement of resolution, which is defined as (fringe period)/(full width at half maximum). We have investigated the resolution of the time domain fringe experimentally and theoretically. It can be influenced by parameters like modes number and initial phase, which is R(N,φmF). φmFrefers to the initial relative phase of mFstates accumulated in double paths Td.
Figure 7 is the numerical results considering an arbitrary number of modes. Figure 7(a)is under the condition that the phases φmFare all the same for any modes. In that case,if we denote ΔωTN=2nπ/N, then the visibility achieves VN=1 when n is the multiple of N and a major peak is observed in this case.A remarkable feature of our interferometer is the enhancement of resolution by N/2 times without any changes in visibility nor periodical time.It is the harmonics that cause the peak width to decrease with the number of modes increasing in this case.[73]Figure 7(b)indicates φmFvaries from mode to mode for comparison. Neither the maximum visibility VN=1 nor the minimum could be reached. Meanwhile,the time domain fringe shows more than one main peak in one period.Therefore, the initial phase φmFneeds to be well controlled to achieve the highest possible visibility and clear interference fringe in the time domain.
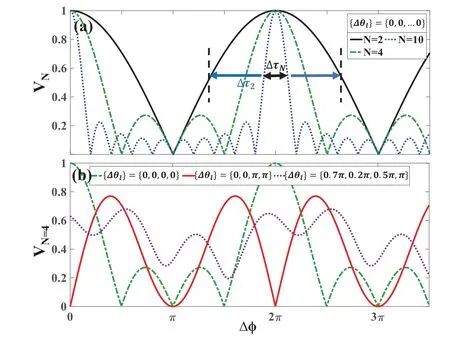
Fig. 7. Dependence of the visibility on the number of modes N and initial relative phase φmF of the same mode in two paths. (a) Dependence on N in a situation that φmF are all zero. FWHM of the N-mode fringe is 2/N times that of the two-mode fringe. (b) Dependence on φmF using N =4 as an example. The green dashed line, red solid line, and purple dotted line show the fringes with (φ1,φ2,φ3,φ4)=(0,0,0,0), (0,0,π,π),and (0.7π,0.2π,0.5π,π), respectively. Reproduced with permission from Ref.[68].
We also experimentally study the time domain fringes.The experimental data (not depicted here) coincides with the numerical results of Fig. 7(b) red line, testifying its superiority to the resolution of the phase measurement. Moreover,the relative phase evolution rate Δω can be controlled by adjusting the difference between the two paths accumulated in Tdstage.[5,58,74]With enhanced resolution, the sensitivity of interferometric measurements of physical observables can also be improved by properly assigning measurable quantities to the relative phase between two paths,as long as the modes do not interact with each other.[60,75,76]
3.4. Atomic momentum patterns with narrower interval
For ultra-cold atoms used in precise measurement, improving the precision of momentum manipulation is also conducive to improving the measurement resolution. The method to get atomic momentum patterns with narrower interval has been proposed and verified by experiments.[49]Here we applied the shortcut pulse to realize the atomic momentum distribution with high resolutions for superposed Bloch states spreading in the ground band of an OL.
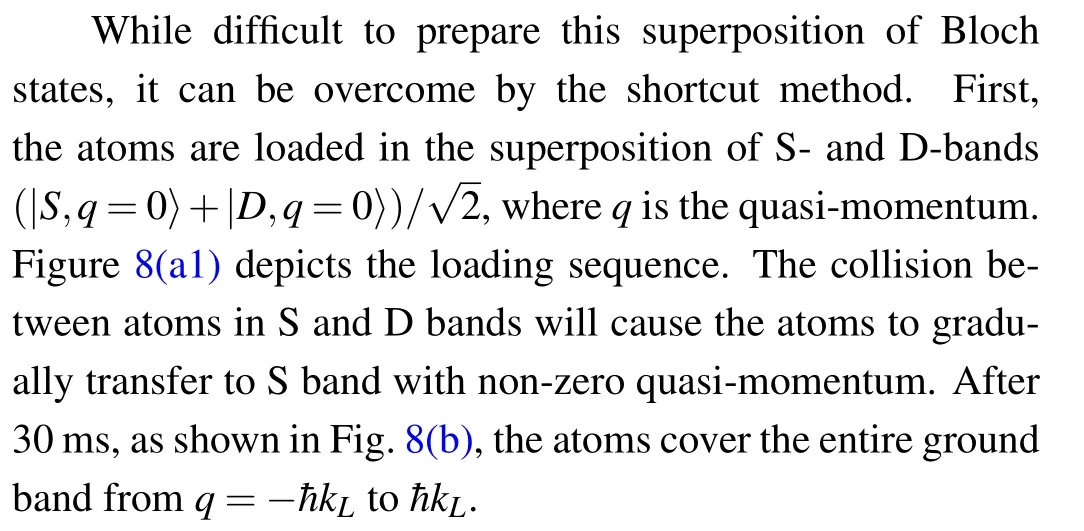
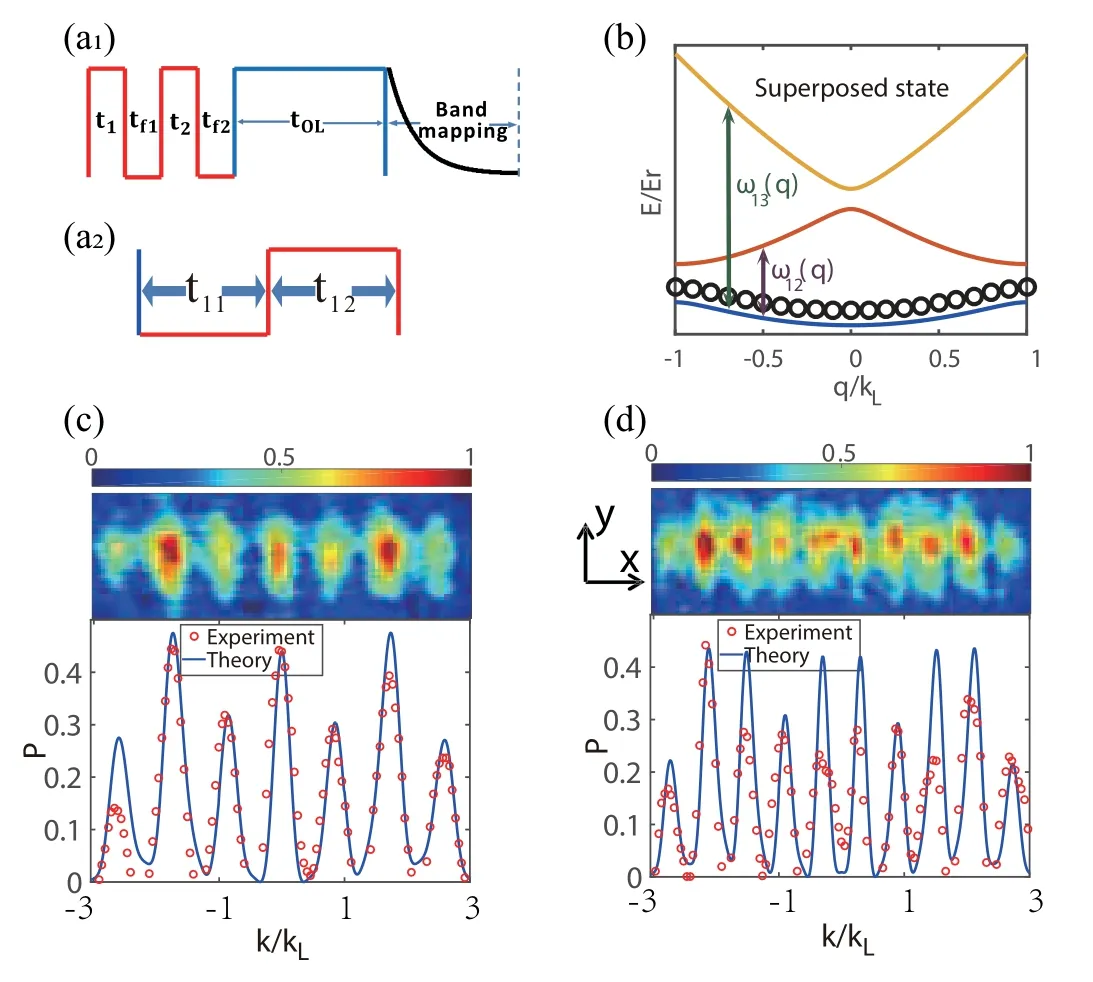
Fig.8. (a)Shortcut method for loading atoms: (a1)after the first two pulses and the 30 ms holding time in the OL and the harmonic trap, the state becomes the superposition of the Bloch states in S-band with quasi-momenta taking the values throughout the first Brillouin zone(FBZ),and is denoted by|ψ(0)〉. Then 1ms band mapping is added. (a2) The single pulse acted on the superposed state|ψ(0)〉. (b)The superposed Bloch states of S-band spreading in the FBZ (black circles). The top patterns in (c) and (d) are the TOF images in experiments. The lower parts of (c) and (d) depict the atomic distributions in experiments(red circles)and theoretical simulations(blue solid lines). There are seven peaks in (c) and ten peaks in (d) with q=±3. Reproduced with permission from Ref.[49].
The momentum distribution of the initial state is a Gaussian-like shape. After an OL standing-wave pulse,which is similar to that in the shortcut process,the different patterns with the narrower interval can be obtained.The standing-wave pulse sequence is shown in Fig. 8(a2). Figures 8(c) and 8(d)show the different designs for patterns of multimodes with various numbers of peaks under OL depth 10 Er, where the top figures are the absorption images after the pulse and a 25 ms TOF.The red circles are the experimental results of the atomic distribution along the x-axis from the TOF images. These results are very close to the numerical simulation result (blue lines). For the numerical simulation,we can get the initial superposition of states by fitting the experimental distributions(Fig.8(b)).Figures 8(c)and 8(d)depict the atomic momentum distributions with resolutions of 0.87interval(seven peaks within q=±3)and 0.6(ten peaks within q=±3)interval,respectively.
The superposed states with different quasi-momenta in the ground band cause the narrow interval(far less than double recoil momentum)between peaks,which is useful to improve the resolution of atom interferometer.[63]
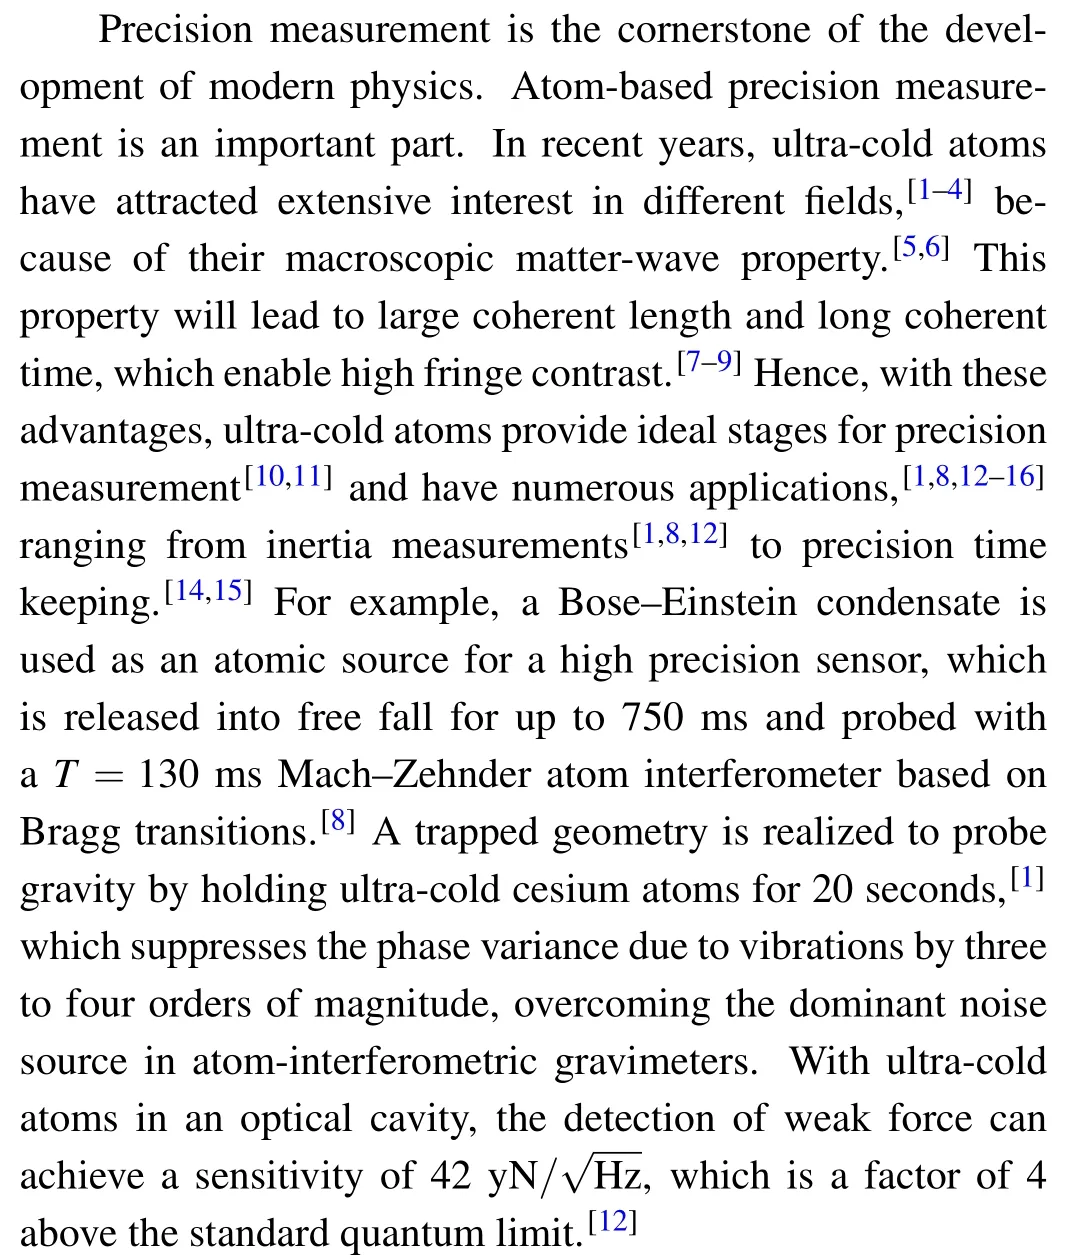
4. Enhanced resolution by removing the systematic noise
4.1. Optimized fringe removal algorithm for absorption images
Optical absorption imaging is an important detection technique to obtain information from matter waves experiments. By comparing the recorded detection light field with the light field in the presence of absorption,we can easily attain the atoms’ spatial distribution. However, due to the inevitable differences between two recorded light field distributions,detection noises are unavoidable.
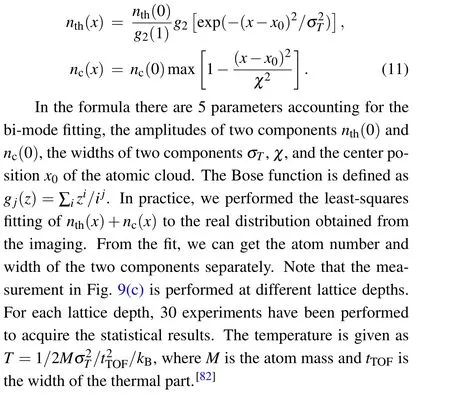
Therefore, we have demonstrated an OFRA scheme to generate an ideal reference light field. With the algorithm,noise generated by the light field difference could be eliminated,leading to a noise close to the theoretical limit.[79]The OFRA scheme is based on the PCA,we confirmed its validity by experiments of triangular optical lattices. The experimental configuration has been described in our prior work.[39,80]When the experiment was in process, the depth of the lattice was adiabatically raised to a final value, followed by a hold time of 20 ms to keep the atoms in the lattice potential before the optical absorption imaging. There are several parameters to characterize the triangle lattice system,[81]among which the visibility,the condensate fraction,and the temperature matter. Figures 9(a2)and 9(b2)are bimodal fitting to the scattering peaks by summing up the atomic distribution within the red box in the direction perpendicular to the center. Here figure 9(a)stands for the common way of calculation and figure 9(b) for the OFRA. The bi-modal curve is composed of two parts: a Gaussian distribution for the thermal component and an inverse parabola curve for the condensed atoms. For each part,the column densities along the imaging axis can be written as
For the number of condensed atoms, the fitting outcome is less affected by the fringe shown in Fig. 9(a). Whereas the influence of the fringe on the fitting of temperature is much more evident. The temperature is proportional to the width of the Gaussian distribution σTas mentioned above.Figure 9(c) shows the temperature extracted from the TOF absorption images with and without the OFRA separately,namely, Figs. 9(a1) and 9(b1). Figures 9(a2) and 9(b2) are the corresponding integrated one-dimensional atomic distributions for each method. Figure 9 depicts that the temperature we get with the common way of calculation has a large error of 400 nK,extraordinary higher than the initial BEC temperature of 90 nK.The turning on the procedure of lattice potential would indeed lead to a limited heating effect,nevertheless the proportion of condensed atom should be reduced significantly considering that our system has been heated up by 4 times.This is still not consistent with the observation. However,the temperature is measured with much small variance at a much reasonable value if we dive into the OFRA scheme. For example, the measured temperature is 123.5 nK for a lattice depth of V =4 Er,with 183.9 nK for V =9 Er. Comparison between these two results illustrates that only by using the fringe removal algorithm we can get a reliable result,especially in the case of small atom numbers when fitting physical quantities such as the temperature.
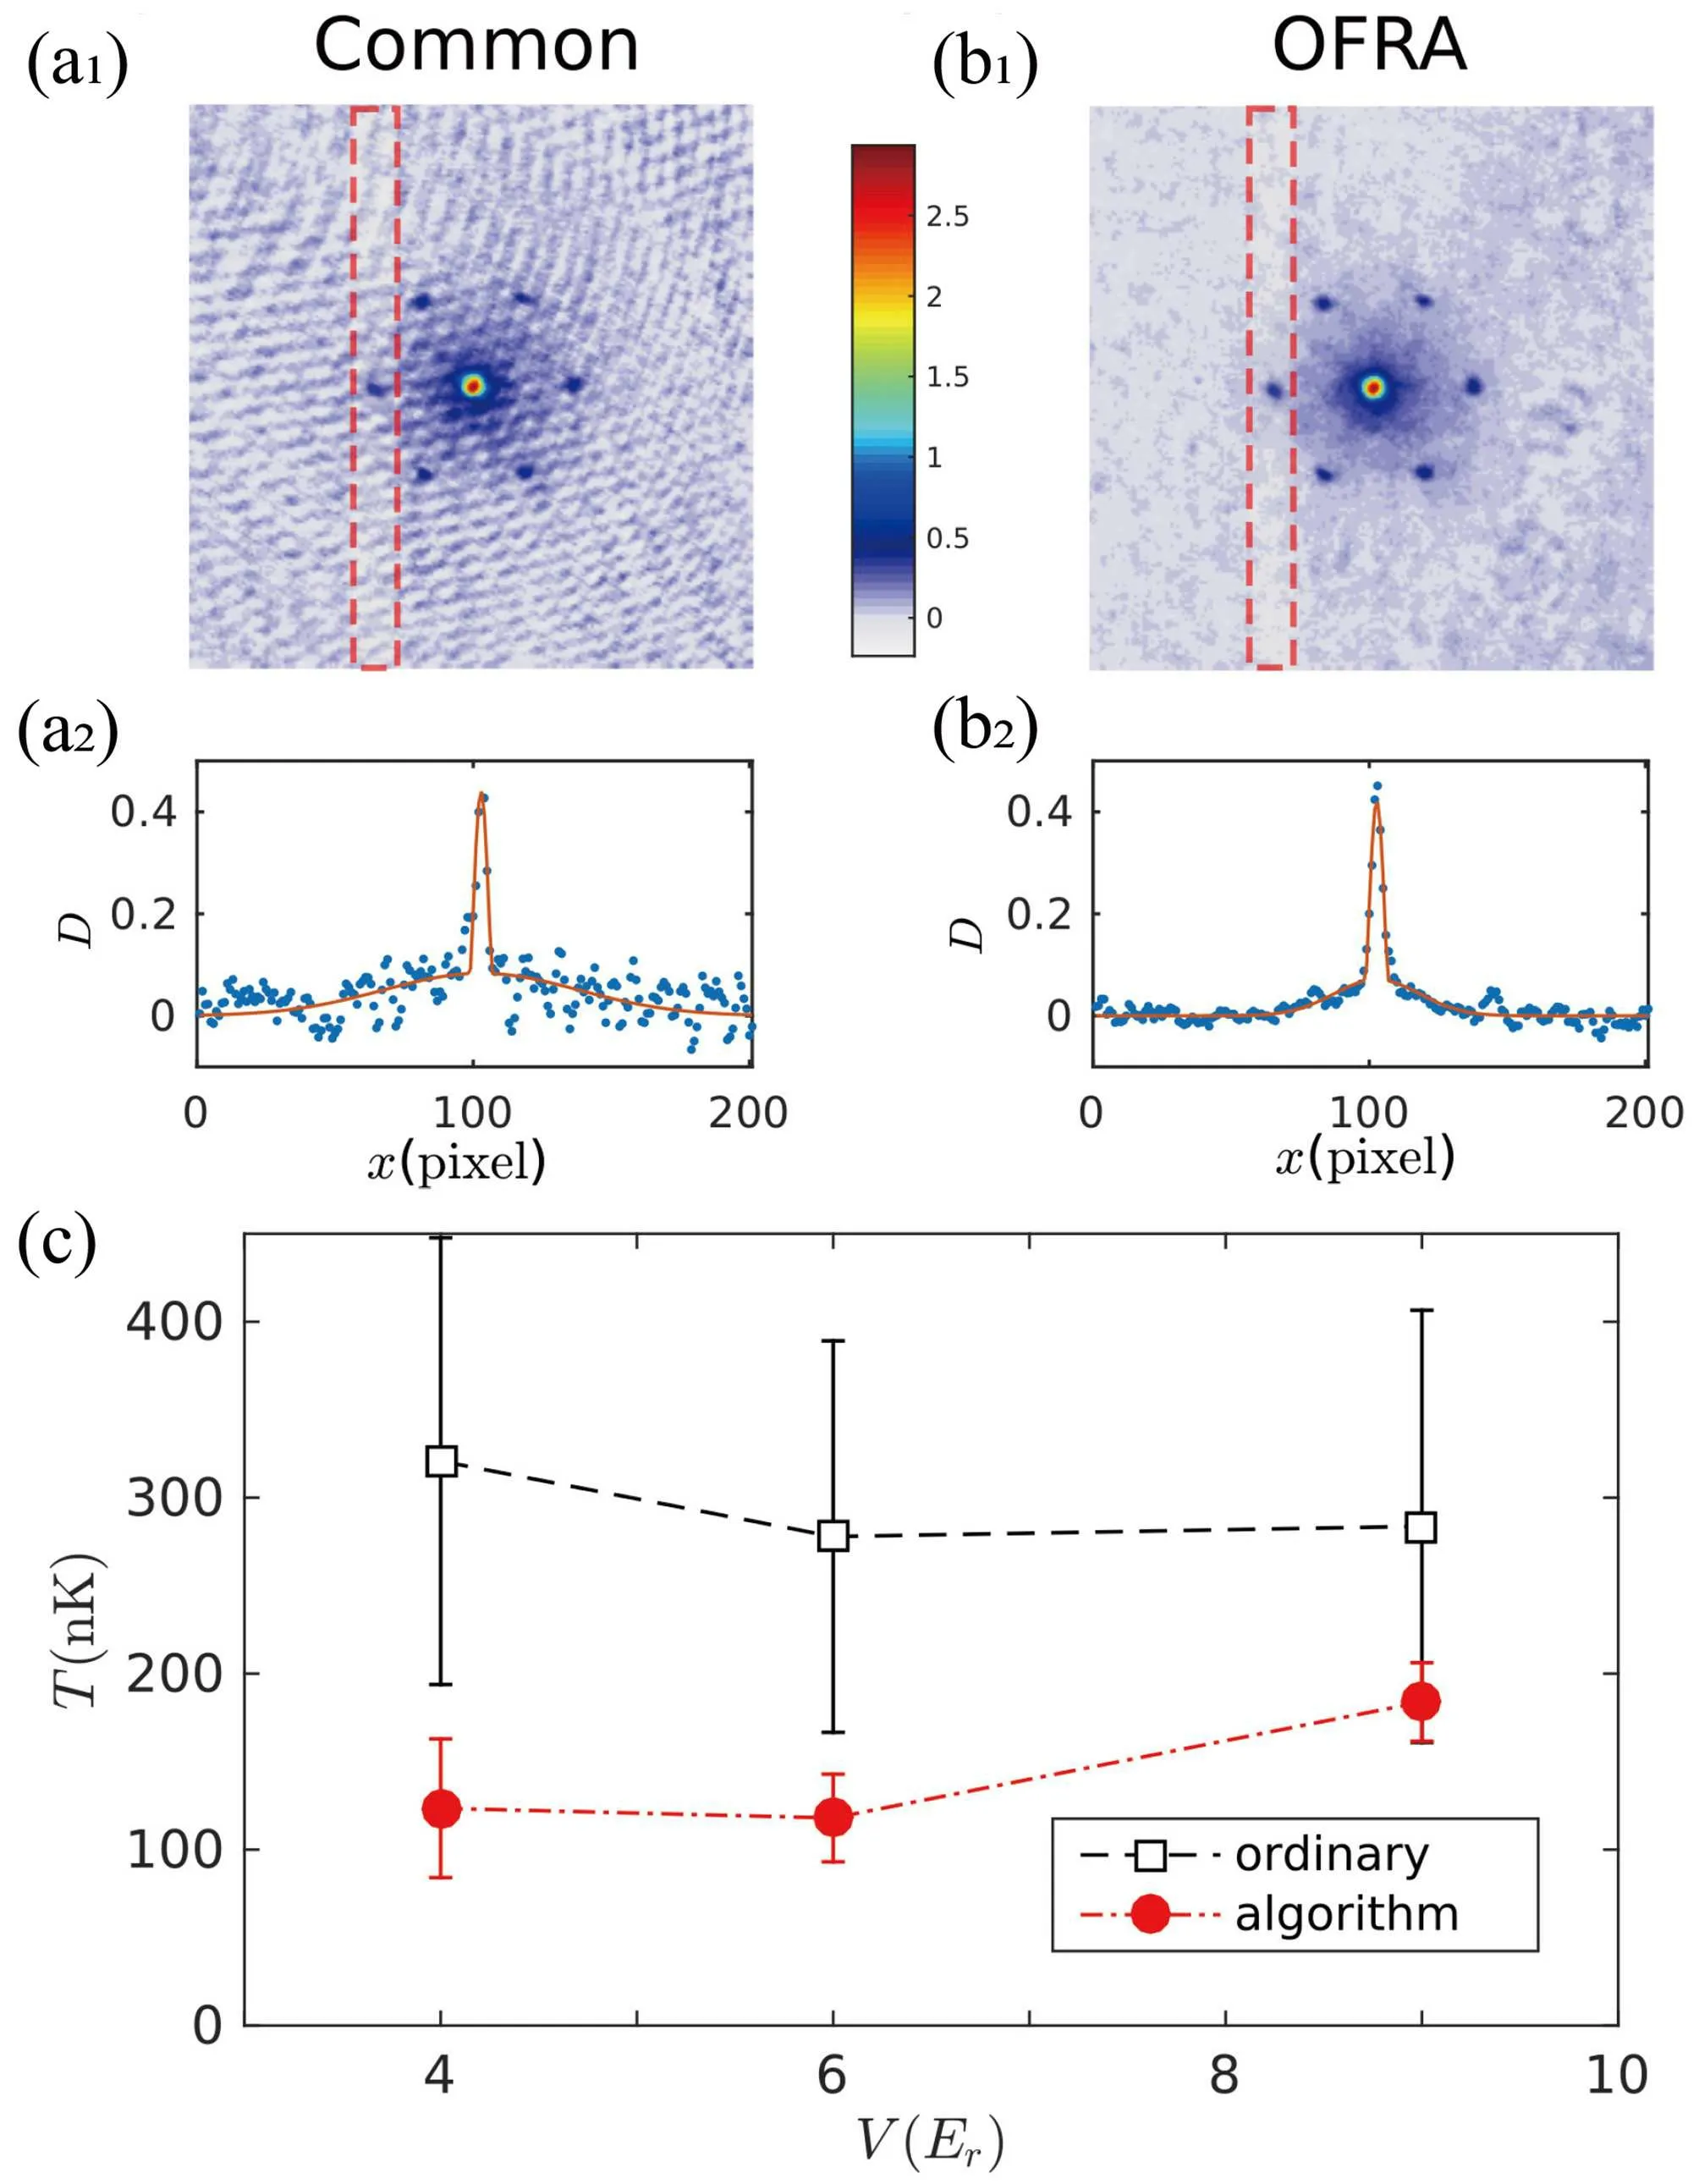
Fig.9. Comparison between ordinary method and OFRA method. The integral of the atomic distribution in the red box in(a1)and(b1)corresponds to(a2)and(b2). The atomic distribution(blue dots)is fitted by a bi-modal function to extract the temperature of atoms,which is shown in(c). Reproduced with permission from Ref.[79].
In conclusion, with this algorithm, we can measure parameters with higher contradiction to the conventional methods. The OFRA scheme is easy to implement in absorption imaging-based matter-wave experiments as well. There is no need to do any changes to the experimental system,only some algorithmic modifications matter.
4.2. Extraction and identification of noise patterns for ultracold atoms in an optical lattice
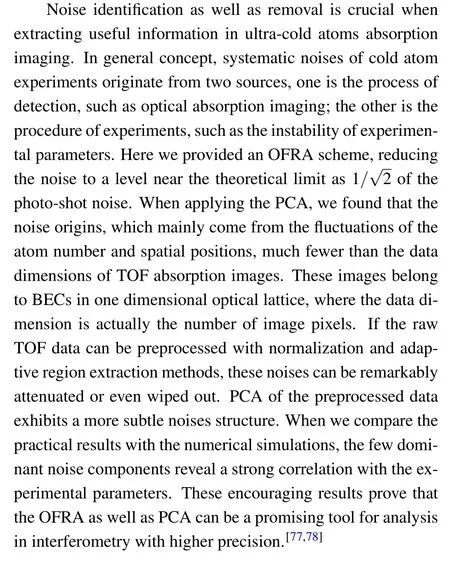
Furthermore, on the basis of the absorption images after preprocessing by OFRA, the PCA method is used to identify the external noise fluctuation of the system caused by the imperfection of the experimental system. The noise can be reduced or even eliminated by the corresponding data processing program. It makes the task more difficult that these external systematic noises are often coupled,covered by nonlinear effects and a large number of pixels. PCA provides a good method to solve this problem.[77,83–86]
PCA can decompose the fluctuations in the experimental data into eigenmodes and provide an opportunity to separate the noises from different sources. For BEC in a onedimensional OL, it was proved that PCA could be applied to the TOF images, where it successfully separated and recognized noises from different main contribution sources,and reduced or even eliminated noises by data processing programs.[87]
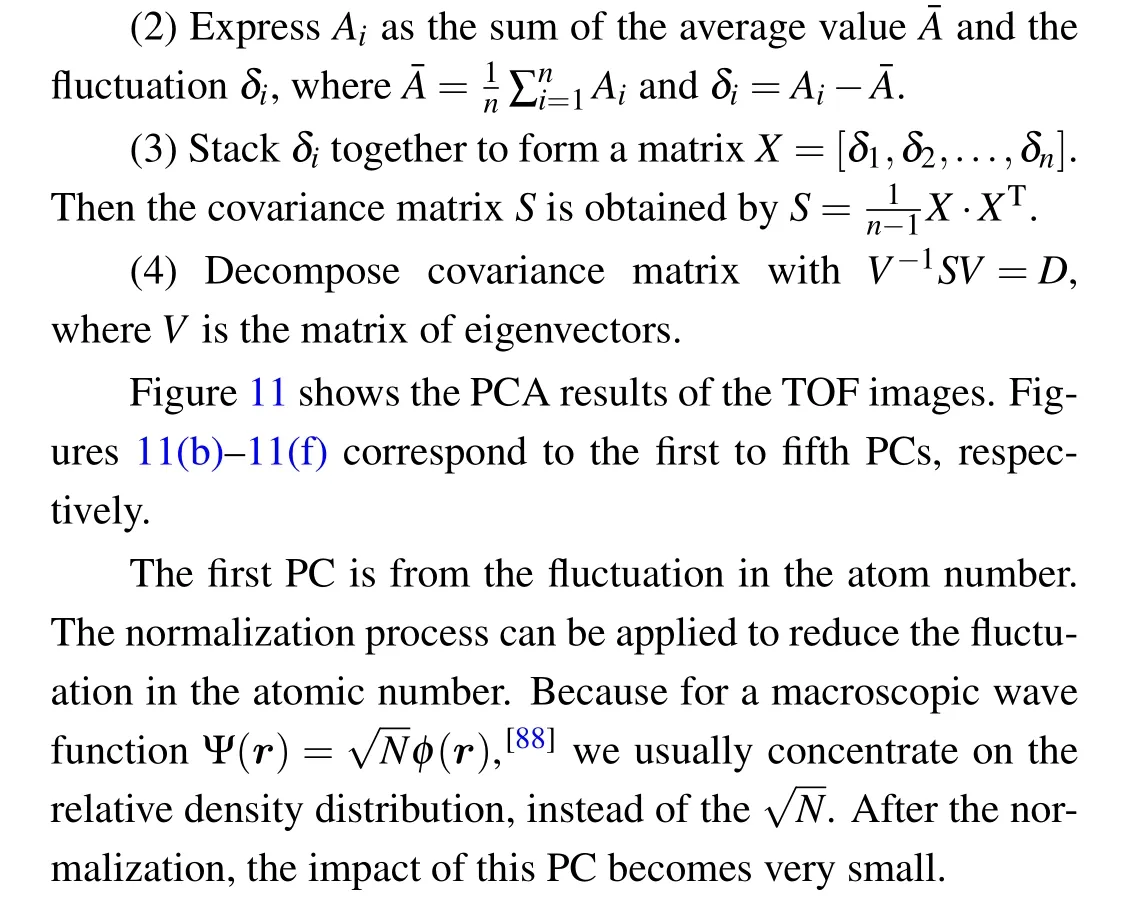
The purpose of PCA is to use the smallest set of orthogonal vectors, called principal components (PCs) to approximate the variations of data while preserving the information of datasets as much as possible. The PCs correspond to the fluctuations of the experimental system,which can help to distinguish the main features of fluctuations. In the experimental system of BECs,the data are usually TOF images. A specific TOF image Aican be represented by the sum of the average value of the images and its fluctuation

Here Pjis the different eigenmodes of fluctuation, and εijis the weight of the eigenmodes Pj.
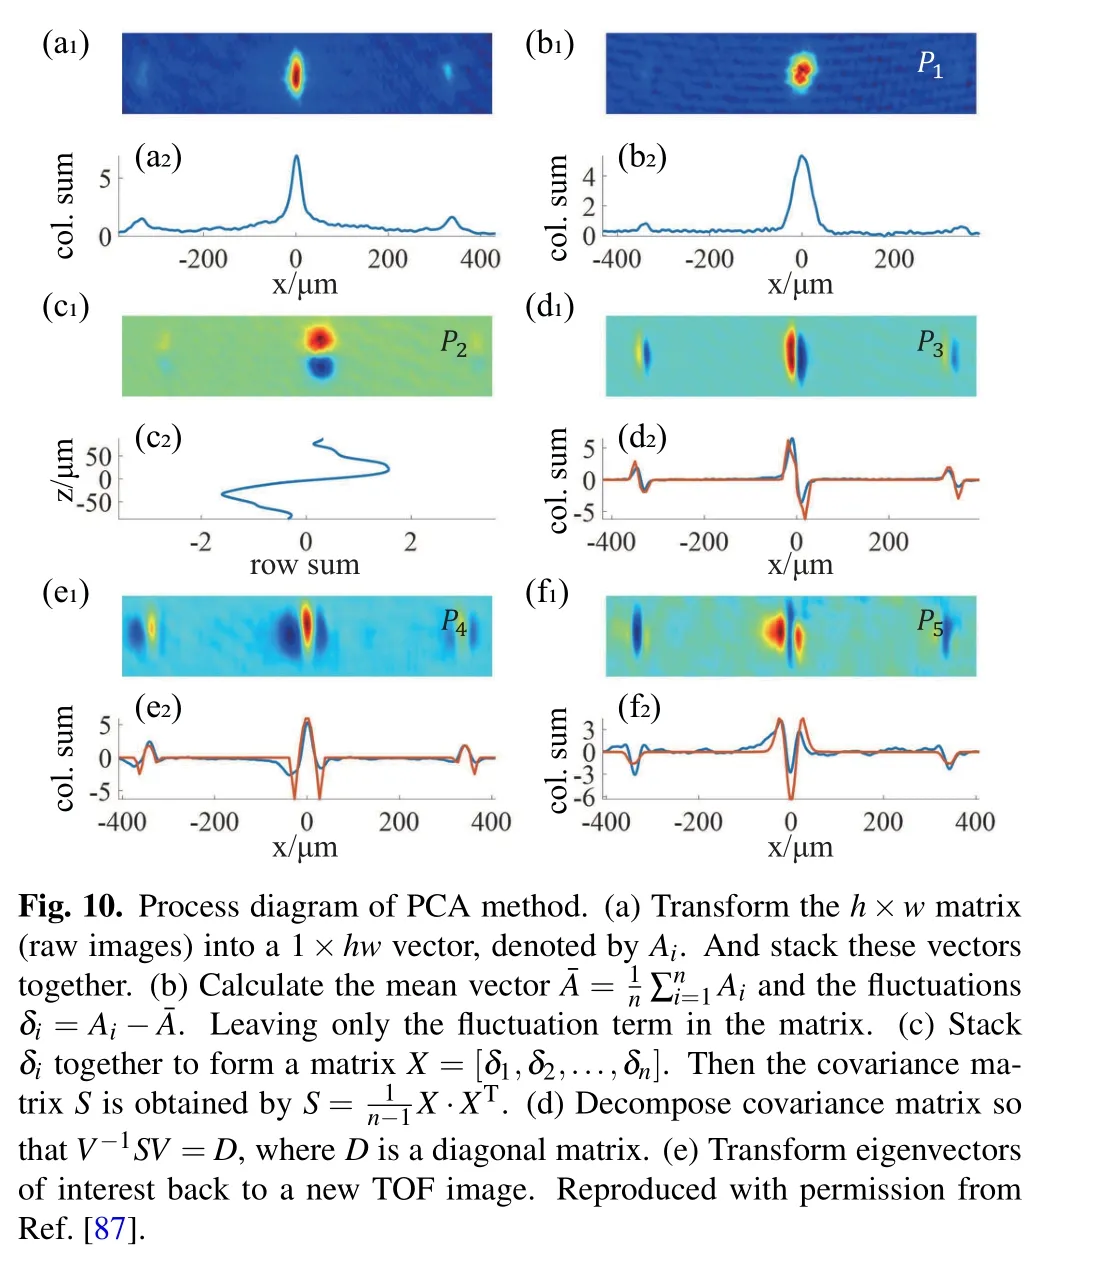
Taking the BEC experiment[27,39,43,87]in an OL as an example,we demonstrated the protocol of PCA for noise extraction. A TOF image for ultra-cold atoms in experiments can be represented as a h×w matrix. The PCA progress, shown in Fig.10,will be applied to the images:
(1)Transform the h×w matrix into a 1×hw vector, denoted by Ai.
The second and third PCs correspond to the position fluctuations along the z- and x-directions, respectively. The fluctuation in spatial position of the TOF images originates from the vibration of the system structure,such as the OL potential,trapping potential, and imaging system. We used a dynamic extraction method to eliminate the fluctuation in spatial position. We chose a region whose center is also the center of the density distribution. We first set a criterion to determine the center of the density distribution in the extraction area, and then used this center as the center of the new area to extract the new one. We repeated this process until the region to be extracted becomes stable.
The fourth PC is from the fluctuation in the width of the Bragg peaks in the TOF images. The final PC shown in Fig.11(f1)comes from the normal phase fraction fluctuation.

Fig.11. PCA results of the TOF images. (a)Example of a raw TOF image.Panels(b)–(f)correspond to the fluctuation in atom number(b),atom position(c)–(d),peak width(e),and normal phase fraction(f),respectively.(a2),(b2),(d2),(e2),and(f2)are the integrated results of atom distributions along x direction. (c2)is for the atom distribution along z direction. The blue lines are the experimental results,and the orange lines are the simulation results.Reproduced with permission from Ref.[87].
By studying the first five feature images, we have identified the physical origins of several PCs leading to the main contributions. We numerically simulated this understanding using the GPE with external fluctuation terms, and got very consistent results.[87]It is helpful to understand the physical origins of PCs in designing a pretreatment to reduce or even eliminate fluctuations in atom number, spatial position,and other sources. Even in the absence of any knowledge of the system, the PCA method is very effective to analyze the noise, so that it can be applied to interferometers with higher precision.[77,78]
5. Proposal on gravity measurements
Inertia measurements,[18–23,89]especially those for gravity acceleration g, have always drawn lots of attention. Until now, the performance of atom interferometry has reached a sensitivity of 8×10⁻⁹at 1 second,[90,91]pushing forward the determination of the Newtonian gravitational constant G[92,93]or the verification of equivalence principle.[94,95]Yet the bulky size of these quantum sensors strictly restricts their application for on-site measurements. Therefore, based on our previous study of ultra-cold atoms in precision measurements, we intend to precisely measure the local gravity acceleration with our87Rb Bose–Einstein condensates in a small displacement.Note that this conception bases on previous research of Perrier Clad´e.[96]
Figure 12 illustrates the protocol of this BEC gravimeter.Instead of the Mach–Zehnder method (π/2–π–π/2) widely used in free-falling or atomic fountain gravimeters, we utilize the Ramsey–Bord´e approach by two pairs of π/2 Raman pulses to get a small volume. Application of the Dopplersensitive Raman beam rather than the 6.8 GHz microwave field provides a far more efficient way to realize larger momentum splitting, which will significantly boost the interference resolution.Raman light pulse can also attain the effects of velocity distribution. Consequently,the first pair of π/2 pulses selects the initial velocity while the second pair can measure the final distribution. It should be noticed that right after the velocity selection step,a cleaning light pulse resonant with the D2line will shine on the condensate to clear away atoms remaining in F =2 state,leading to the two arms in interferometry.
The critical feature lies in the evolving stage between the two pairs of π/2 pulses. By periodically inverting the velocity, the two arms shall replicate parabolic trajectory in a confined volume, without any decreasing of the interrogation time. Choosing appropriate parameters,displacement of ultracold atoms can be limited in a few centimeters,at least 1 order less than that of a Mach–Zehnder gravimeter.This assumption is accomplished by a succession of Bloch oscillation(BO)in a pulsed accelerated optical lattice which transfers many photon recoils to the condensates.[97–100]Here the application of ultra-cold atoms instead of optical molasses[63]makes it more efficient when loading the atoms in the first Brillouin zone adiabatically, owing to their wave function consistency and narrow velocity distribution. This pulsed accelerated optical lattice should be manufactured along the direction of gravity with higher lattice depth, to minimize the effect of Landau–Zener tunneling loss.
To deduce the value of g,we may scan the evolving time between the two pairs of π/2 pulses,keeping the Raman frequency of each pair of π/2 pulses fixed. When the time interval equals 2PqvRecoil/g, where P is the number of pulses and q is the number of recoil velocities (vRecoil) obtained by a single pulse (shown in Fig. 12), the two arms are in phase and the value of g can be extrapolated. Here the absorption image is used to extract the interference information, due to the number of atoms being one order less than that obtained by the conventional method.
We also give a qualitative analysis of this compact BEC gravimeter. Besides its enormous potential in transportable instruments, prospective sensitivity maybe even better. This encouraging outlook can be attributed to a longer coherent time of ultra-cold atoms where the phase shift scales quadratically. The smaller range of movement possesses other superiorities. Systematic errors stemming from the gradients of residual magnetic fields and light fields become negligible,especially for Gouy phase and wave-front aberrations.[91,101,102]Furthermore,the value of the gravity acceleration is averaged over a smaller height compared with the Mach–Zender ones.Finally, this vertical Bloch oscillation technique offers a remarkable ability to coherently and efficiently transfer photon momenta,[100]though decoherence induced by the inhomogeneity of the optical lattice must be taken into consideration.
In conclusion,we believe that this compact BEC gravimeter will have a sensitivity of a few tens of μGal at least.The falling distance will be no more than 2 cm. Further improvement should be possible by performing atom chip-assisted BEC preparation as well as the interactionsuppressing mechanism.[103]Gravity measurements with subμGal accuracies in miniaturized, robust devices are sure to come in the future.
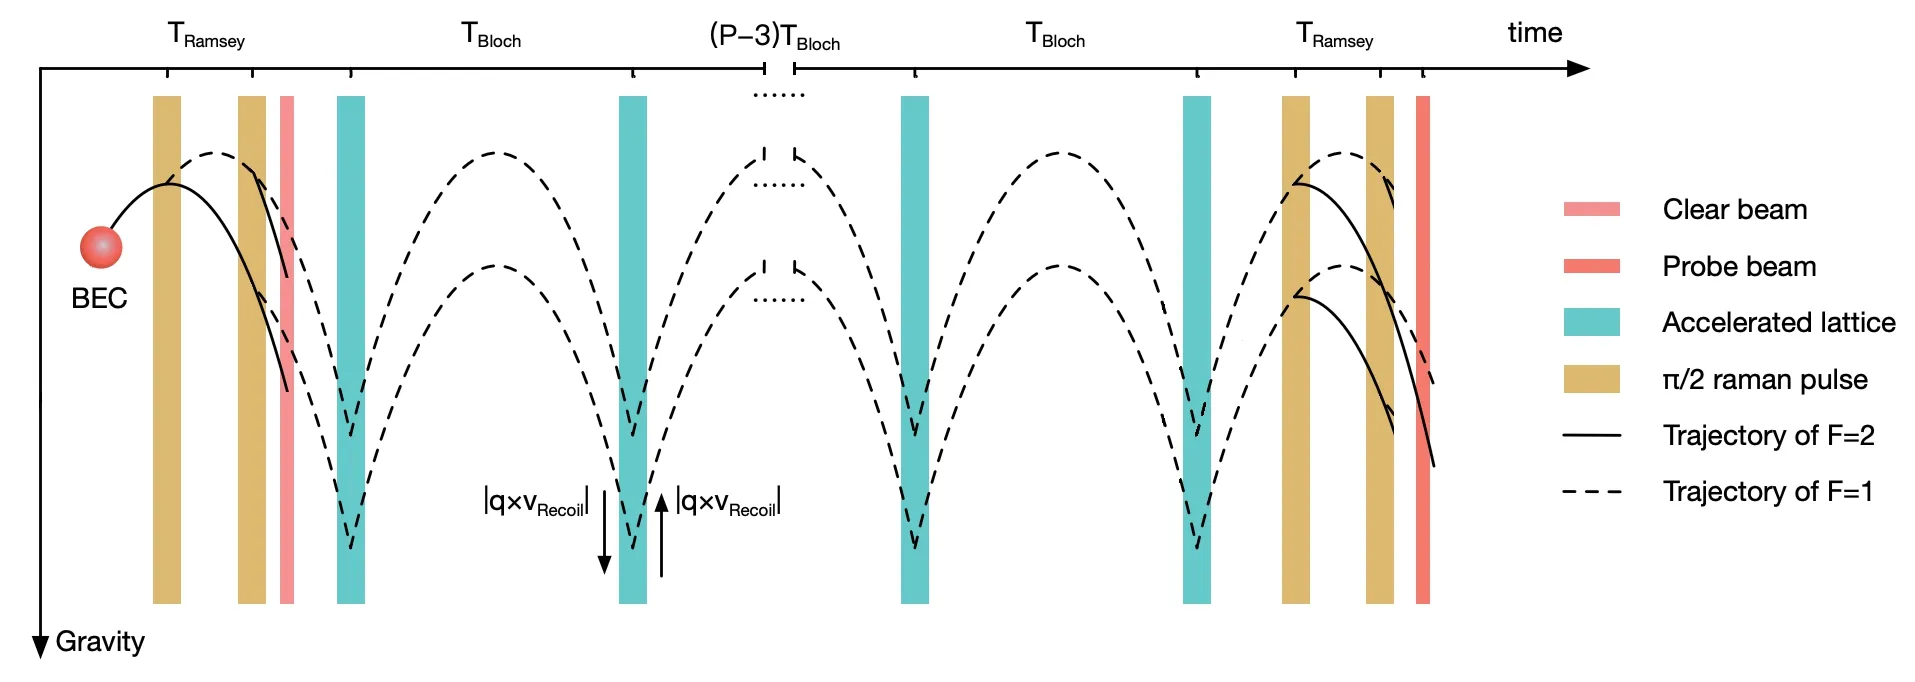
Fig.12. Schematic of the experimental protocol. 87Rb atoms are evaporation cooled as a BEC in the|F =2,mF =0〉initial state. However,they are transferred to|F =1,mF =0〉as the two arms of interferometry,followed by P sequence of accelerate optical lattice pulse to maintain the atoms against gravity: When the atoms fall to a velocity of q×vRecoil,they acquire a velocity of 2q×vRecoil upwards. The delay TBloch is chosen as TBloch =2qvRecoil/g to eliminate the fall caused by gravity. Right after the third pulse of the Ramsey Bord´e sequence, part of the atoms from the two arms mentioned above form a closed path and they interfere at the last pulse.The interference signal will be extracted using fluorescence absorbed by photodetectors(not shown here). Still, the probe beam should consist a laser light resonant with the F =1 ground state to upper levels,thus we can take absorption photos of F =1 population for analysis.
6. Conclusion
In summary, we review our recent experimental developments on the performance of interferometer with ultra-cold atoms. First, we demonstrate a method for effective preparation of a BEC in different bands of an optical lattice within a few tens of microseconds, reducing the loading time by up to three orders of magnitude as compared to adiabatic loading. Along with this shortcut method, a Ramsey interferometer with band echo technique is employed to atoms within an OL, enormously extends the coherence time by one order of magnitude. Efforts to boost the resolution with multimode scheme are made as well. Application of a noise-resilient multi-component interferometric scheme shows that increasing the number of paths could sharpen the peaks in the timedomain interference fringes,which leads to a resolution nearly twice compared with that of a conventional double-path twomode interferometer. We can somehow boost the momentum resolution meanwhile. The patterns in the momentum space have got an interval far less than the double recoil momentum,where the narrowest one is given as 0.6. However, these advancements are inseparable with our endeavor to optimize data analysis based on the PCA.Extrinsic systematic noise for absorption imaging can be reduced efficiently. A scheme for potential compact gravimeter with ultra-cold atoms has been proposed. We believe it will tremendously shrink the size of a practical on-site instrument,promoting another widely used quantum-based technique.
猜你喜欢
杂志排行

Chinese Physics B的其它文章
- Two-dimensional finite element mesh generation algorithm for electromagnetic field calculation*
- Stable water droplets on composite structures formed by embedded water into fully hydroxylated β-cristobalite silica*
- Surface active agents stabilize nanodroplets and enhance haze formation*
- Synchronization mechanism of clapping rhythms in mutual interacting individuals*
- Theoretical study of the hyperfine interaction constants,Land´e g-factors,and electric quadrupole moments for the low-lying states of the 61Niq+(q=11,12,14,and 15)ions*
- Ultrafast photoionization of ions and molecules by orthogonally polarized intense laser pulses: Effects of the time delay*