Comparative study of different hydro-dynamic flow in microbial fuel cell stacks
2021-06-26SuranshJainArvindKumarMungray
Suransh Jain,Arvind Kumar Mungray
Chemical Engineering Department,Sardar Vallabhbhai National Institute of Technology,Surat 395007,India
Keywords:Microbial fuel cells Waste water Hydro-dynamically independent COD consumption Fuel cell Bioenergy
ABSTRACT This work has investigated the scale-up potential of microbial fuel cells (MFCs) under stacking mode.Stacking was done in batch mode and continuous mode.Batch feeding mode stacks were operated in electrical series (S) and parallel (P) mode.Continuous feeding mode stacks were kept in electrically parallel mode with different hydro-dynamic patterns.The two continuous stacks were connected hydrodynamically in series (i.e.Parallel Dependent;PD)and parallel (i.e.Parallel Independent;PID) configurations.The performance of the continuous stacks was evaluated on the basis of COD consumption rate,power generation and coulombic efficiency.PID obtained highest power (0.47 mW) which was approximately 3.6 times that of PD configuration (0.13 mW).The rate of COD consumption was also highest in PID stack (3091.75 mg﹒L-1﹒d-1).Coulombic efficiency of the PID stack was 14.26% which was approximately 292.8% of the PD stack.The results confirmed that the parallel electrical connection hybridized with the independent hydro-dynamic flow gives the best possible results when working with stacking of MFCs.
1.Introduction
Microbial fuel cells (MFCs) are the bio-electrochemical system that facilitates the conversion of chemical energy stored in the bonds of the organic substrate into the electrical energy using exo-electrogenic bacteria.They are being extensively researched for an alternative source of energy in place of conventional fossil fuels [1–3].Therefore,in the last two to three decades,many researchers had been working extensively to make this technology feasible for domestic and industrial effluents [4–7].Though wastewater contains many forms of contaminants that may have a negative impact on public health and the environment,it has been seen as a potential source of recyclable water.A large amount of energy is stored in the wastewater in the form of chemical bonds which can be utilized to gain electrical energy with the simultaneous treatment of wastewater [8].
A typical MFC consists of three basic components:two chambers for anolyte and catholyte,a cation exchange membrane working as a separator and the electrodes.The organic substrate is oxidized in the anodic chamber,whereas,the cathodic chamber is where the oxygen gets reduced to water [9,10].Many factors that are responsible for the performance of MFCs are electrodes materials and types,membranes as a separator,inoculum (pure or mixed culture),substrate concentration,reactor design,etc.[11–14].
Although extensive research is done in the field of MFCs,still the energy output of a single MFC unit is very low and can’t be utilized for real-time applications [15–17].Therefore,there is a need for a scale-up of the MFC technology.The stacking of small volume microbial fuel cell seems to be the most fitting way to scale up.This is because the larger electrodes used in the large MFCs could increase the ohmic resistance in the system [18–22].
In recent years,many researchers have worked on the stacking of microbial fuel cells [23,24].Electrical connections were studied in series and parallel.The electrical series connection can be used to increase the voltage,while the current increases in parallel stacking[25,26].Still,many problems are associated with the process of scaling up.While working with the series connection,the researchers have faced the problem of voltage reversal,which harms the performance of the stacked MFCs [27,28].Researchers have also worked on the hybrid connection in microbial fuel cell establishing a series-parallel connection for the generation of simultaneous voltage and current to enhance power [28,29].The hydro-dynamic flow pattern of the wastewater into the MFCs may also have impact on the overall performance along with the electrical stacking.Literature are available for the case of hydrodynamic series connection or the cascade of MFCs [18,23,27,30]but for the case of hydro-dynamic parallel connection,very limited work is available.Many studies are available on the independent flow of feed into the MFCs.But all these studies used either a series electric connection or hybrid electric connection [17,19] but not the parallel electric connection.Also many authors have reported the use of earthen membranes in the stacking of MFCs [21,31]but no study is available which had reported the use of modified earthen membranes in MFC stacking.All the physical and chemical properties of the modified membrane had already been analyzed in our previous work [32].
Therefore,in this work,considering the above limitations,hydro-dynamic flow arrangement in parallel mode is studied.As there was no comparative assessment available for electrical and hydro-dynamic stacking together,this paper presents a thorough study for finding out the best stacking arrangement with real wastewater.Six air cathode MFCs with novel modified earthen membrane were tested in(i)batch mode with series(S)and parallel (P) electrical connections,(ii) parallel electrical connections for continuous mode varying the hydro-dynamic flow of wastewater in dependent (series) (PD) and independent (parallel) (PID) mode.Performance parameters were evaluated in terms of COD consumption rate,coulombic efficiency and overall power production.A viability study was also done to find out the effect of each individual MFC in both the hydro-dynamic configurations.
2.Materials and Methods
2.1.Experimental set-up for the stacks
Single chamber air cathode microbial fuel cells were fabricated using plexiglass through a local vendor with an effective volume of 0.2 L.The fabricated MFCs were 70 mm long and the internal diameter was 62 mm.The anodic chamber had openings for copper wire attached to the anode,for the feed inlet and outlet of the effluent.Carbon felt (Vinpro Technologies,Hyderabad,India) was used as both anode and cathode material with the surface area of 16 cm2and 31 cm2respectively.Anode chamber was provided with a lid with the opening for the cathode to fit.The copper wire was covered with a non-corrosive coating.The ends of the wire connected to the electrodes was coated with epoxy mixed with graphite powder to not affect the conductivity of the wire.The earthen membrane used in this study was made up of red soil and montmorillonite in the ratio of 1:5 and coated with a Nafion solution (Sigma Aldrich,USA).Various physical,chemical,and electrical properties of the used membrane were evaluated in our previous study[32].Four different stacks of MFCs were used in this study as given in Table 1.The schematic diagram of various connections is shown in Fig.1.
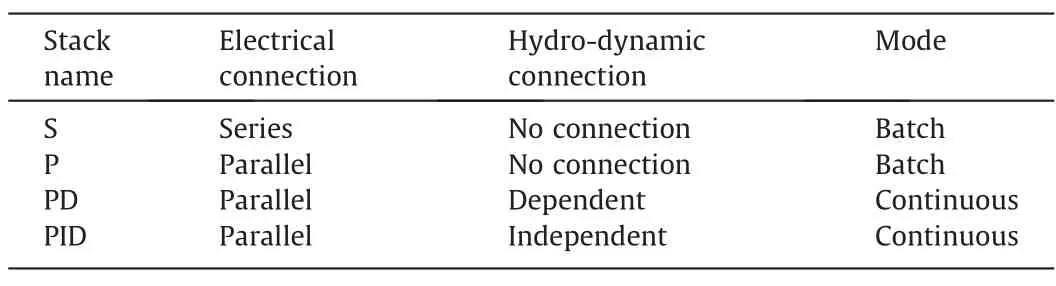
Table 1 Various stack configurations of the operated MFCs for experimentation
The electrode spacing was kept at a minimum distance of 1 cm to reduce the ohmic resistance as much as possible [30].In batch mode,the stacks were connected electrically in series (S)(Fig.1a) and parallel (P) (Fig.1b).While in continuous mode,the stacks were connected electrically in parallel and the hydrodynamic flow was altered in both the stacks keeping them hydro-dynamically dependent (PD) (Fig.1c) and hydrodynamically independent (PID) (Fig.1d).
2.2.Inoculum and substrate
Anaerobic sludge was collected from a sewage treatment plant of the city and was used as inoculum for the anodic chamber.Domestic wastewater was collected from a local pumping station.The setups in batch mode were fed after every cycle of 3 days.The continuous mode stacks were fed continuously with domestic wastewater using a peristaltic pump (Miclins PP-20-EX-2C,India).Hydraulic retention time(HRT)was kept same for both the continuous mode stacks(3 d).All batch mode stacks were operated at the same time,keeping all input parameters same.This would help to avoid any change in conditions and parameters that could possibly affect the electricity generation in the stacked-MFCs.Similarly,the continuous mode stacks were also operated at the same time keeping all input values same.
2.3.COD removal and rate of COD consumption
Duplicate samples were analyzed for COD using HACH DRB 200 digester and a HACH DR5000 spectrophotometer (HACH,USA) by using the standard protocol mentioned in APHA [33] and accordingly COD removal efficiency was evaluated.The rate of COD consumption was calculated using Eq.(1) for continuous system [34]and Eq.(2).for batch stacks:

where‘q’represents the daily flow rate,‘V’represents the total anodic volume and ‘rCOD’ is the rate of COD consumption,subscript ‘i’and ‘o’ refers to the inlet and outlet.
The continuous stacks PD and PID were fed continuously with domestic wastewater at the COD of(730±67)mg﹒L-1.The continuous mode of operation was maintained using a peristaltic pump.The domestic wastewater was fed into the PD stack from the first MFC unit and the effluent was gathered from the sixth MFC unit(Fig.1c).Whereas,in the PID stack,each individual MFC unit was fed with the same wastewater and the effluent was collected from the individual units as well (Fig.1d).
2.4.MFC performance study
Performance evaluation of the stacks was done in terms of voltage(V),current(I)and power(W).All the stacks were continuously monitored using a data logger (34972A,Keysight Technologies,USA).Open circuit voltage (OCV) was monitored until the stable voltage trend was visible.After the stacks reached a stable open circuit potential,the polarization studies were performed by varying the external resistance from 100 kΩ to 1 Ω.Dissolved oxygen and pH were calculated using Hanna EDGE DO meter and Hanna HI5521 pH meter (HANNA Instruments,Australia)
2.5.Coulombic efficiency
The coulombic efficiency(CE)of all the stacks was measured to ensure the transfer of electrons from anode to cathode.It was calculated in order to evaluate the efficiency of the stacks to transfer electrons towards cathode from the anode.The CE for the stacks can be calculated using the following equations for batch system(Eq.(3)) and continuous system (Eq.(4)):


Fig.1.Stack connection and configuration for(a)series connection(S)in batch mode;(b)parallel connection(P)in batch mode;(c)electrically parallel and dependent hydrodynamic (PD) flow and (d) electrically parallel with the independent hydro-dynamic flow (PID).

where‘F’is faraday’s constant,‘q’is daily flow rate and‘I’is current[35].
3.Results and Discussion
3.1.Performance of batch stacks
The COD removal efficiency of the stacks was measured in five cycles to ensure that the substrates were being degraded inside the system.The feed COD of the domestic wastewater was varied between the range of 650–800 mg﹒L-1.In the case of batch stacks,it can be clearly seen from Fig.2a that the parallel stack removes more organic when compared to the series stack.According to the law of addition of resistances,when same set of resistances are connected in series and parallel,the parallel circuit will have the lower output resistance than the series circuit.So,when working under series connection,the stack works under higher resistance compared to parallel circuit under the same conditions.Lesser will be the flow of electrical current into the series connection and therefore lesser electrons will be transferred from the anode[36].Higher current corresponds to the better COD removal efficiencies [37].The fact can be summed up from the values of COD removal efficiencies and current generated in both circuits.The current generated in series circuit is lower than the parallel stack because of the addition of the effect of all individual cells[30].Therefore the COD removal efficiency is higher in parallel stack than in the serially connected MFC stack.
Due to the lower resistances into the parallel connection,more current was produced when compared to the series connection.Moreover the voltage in all the individual MFC units remains the same and remains constant throughout the circuit.The current produced was the sum of current produced by all the individual MFC units [30].It is clearly visible from Fig.2(b),that the current generated in the parallel circuit (0.07 mA) was approximately 10 times the current produced in the series circuit (0.007 mA).The crest and trough pattern in the batch graphs shows the depletion of substrate at the end of each cycle.
The rate of COD consumption in parallel batch stacks(226.02 mg﹒L-1﹒d-1) was higher as compared to the series batch stack (197.42 mg﹒L-1﹒d-1).The batch stacks were operated at the same conditions,therefore,the rate of COD consumption depends directly on the consumption of substrate in the system.In the parallel stack,the substrate is consumed at a higher rate when compared to the series stack.Due to the lower overall resistance in the parallel connection,there will be more current produced when compared to the series connection which needs more electrons to be transferred to the anode.So in a given time period,the number of electrons transferred to the anode in the parallel stack will be higher when compared to the series stack.Therefore,the rate of COD consumption is higher in parallel stack.

Fig.2.Performance comparison of batch stacks:(a) COD removal efficiency;(b) Current generation.
A polarization study was done to evaluate the overall performance of the batch MFCs.A voltage drop can be seen in the MFCs in both the stacks with the increase in current density.It can be distinctly noticed from Fig.3a that the voltage in the series configuration falls more rapidly than the parallel connection.Also,the ohmic losses in the series connection exceed the parallel connection.Resistances obstructing the transport of electrons are the causes of Ohmic losses occurring in the system.Rapid voltage drop can be seen at higher ohmic losses[38].Ohmic losses were evident in all the stacks.The highest power density for the series circuit was 1.6 W﹒m-3which was lesser than the maximum power density generated in a parallel circuit(1.9 W﹒m-3)(Fig.3b).The external resistance at which the maximum power density is achieved,is considered to be the value of the internal resistance of the system.
Based on these observations and fact that parallel connection is better than series connection,further studies were conducted by keeping the electrical connection in parallel and altering the hydro-dynamic connection in dependent (series) (PD) and independent (parallel) (PID) pattern and in continuous mode.
3.2.COD removal and rate of COD consumption in continuous stacks

Fig.3.Polarization curve of the batch stacks:(a) current density vs.voltage and (b) current density vs.power density.
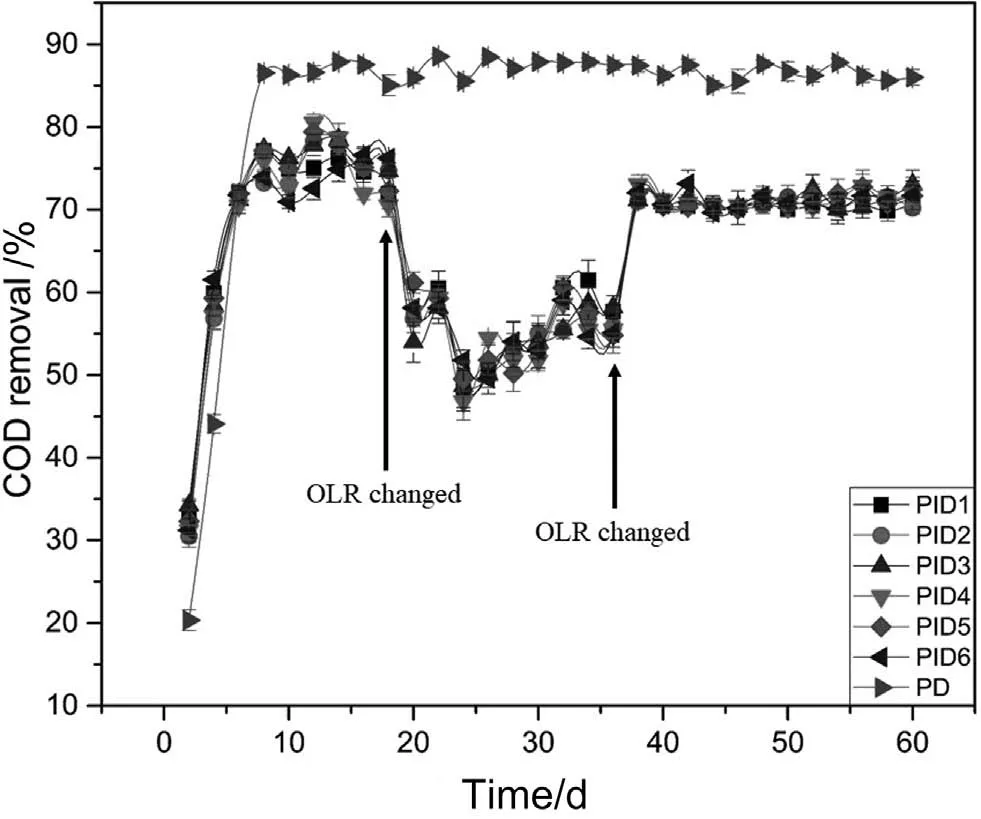
Fig.4.COD removal in continuous stacks.
It is significantly visible from Fig.4 that the COD removal in PD stacks is higher than the PID stacks.The reason behind the higher COD removal in PD stack is that the domestic wastewater remains in contact with the higher number of electrogenic bacteria as it passes through six MFC units before being eluted[34].Whereas,in PID stack,each MFC was fed with individual feed inlet and the domestic wastewater maintains contact with the microbes from that unit only.Since,the substrate entering the PD stack is entering the stack from the first cell and coming out of the sixth cell removing COD in each cell.Whereas,in the PID stacks,the feed is independently going into each individual cell of the stack and therefore the COD removal is taking place in each cell individually.Due to these facts,the COD removal is higher in the PD stack than the PID stack.
Both the continuous stacks PD and PID were fed with the same inlet domestic wastewater.But when we look at the individual MFC unit in both the stacks,they had different retention times.Since the PD was fed from the first cell,and the effluent was gathered from the sixth cell at the end of the third day,the wastewater remains in a single cell for a time duration of half a day.Therefore,the HRT in the single unit of the PD stack was 0.5 d.On the other hand,when we see the individual cell of the PID stacks,they all have the HRT of 3d as all the units have individual inlet and outlet and the wastewater took 3 days to elute from the unit.This difference in HRT of the individual cell of the stacks created a difference in OLR (organic loading rate) of the stacks.
The rate of COD consumption depends directly on the OLR of the MFC.As the individual MFC unit in the PID gets individual feed,therefore,the COD entering into the PID stack was six times the COD entering in the PD stack.Also,the OLR of the PID stack was one-sixth as of the PD stack.When it comes to the rate of COD consumption at that OLR,the PID stack has a better COD consumption rate (3091.75 mg﹒L-1﹒d-1) than the PD stack (2816.49 mg﹒L-1﹒d-1)despite showing lesser COD removal efficiency.The reason behind the higher COD consumption rate is that the system is receiving the higher inlet COD in comparison to the PD stack.
To match the OLR in both the continuous stacks,the OLR of the PID stack was increased on the 20th day to match the OLR of the PD stack by reducing the HRT of the system to 0.5d.As soon as the OLR was increased,a fall in COD removal was seen in the PID stack.This may be due to the lesser contact between the microbes in the anode biofilm and anolyte with the domestic wastewater being fed into the system at a higher loading rate [34].The condition of increased OLR was kept for 20 days and when there was no improvement observed in the COD removal,the OLR was changed again (Fig.4).This time,the OLR was maintained at the value which is the mean of the OLR of PD and PID by adjusting the HRT of the system to 36 hours.By doing so,a gradual increase in the current output was seen as well the COD removal efficiency was increased to~70%.
3.3.Electrical performance of the continuous stacks
Two different continuous hydro-dynamic patterns were operated:hydro-dynamically dependent (PD) and hydro-dynamically independent (PID).Because of the continuous feed,there will be no substrate depleting condition for the microorganism in the anodic chamber.Therefore,there will be a continuous generation of electrons.The stacks were initially kept at open circuit potential to acclimate the biofilm at the anode surface.The OCV recorded over time is shown in Fig.5a.It took around 10 days to get the OCV stabilized.The highest OCV achieved by PD and PID is 0.527 V and 0.789 V respectively (Fig.5a).The PID stack achieved stable OCV more rapidly than the PD stack.This may be due to the reason that the PID stack received more overall COD than the PD stack.This leads to the rapid electrogenesis onto the anode surface leading to higher OCV in shorter time.
After the OCV was stabilized,the polarization study was done for both the stacks.Polarization studies were performed for the evaluation of voltage and current in both the continuous stacks PD and PID with respect to change in external resistance.It is very useful for evaluating the dependence of MFC performance on resistance.The steep decrease in voltage was observed in Fig.5b which shows the activation losses.These losses are due to the requirement of activation energy for substrate oxidation by the microbial cell culture [39].The activation losses were almost similar in both the stacks.The next portion of the current density vs voltage graph represents the ohmic losses.When the ohmic losses are higher,higher will be the drop in voltage with an increase in current density.It is significantly visible from Fig.5b that the ohmic losses were higher in PD than in PID stack.
The current density vs.power density curve is shown in Fig.5c.The maximum power density achieved by PID and PD stacks was 6.99 W﹒m-3and 4.37 W﹒m-3respectively at 100 Ω resistance.The curves did not show any capacitive behavior as generally flat polarization curve reflects the capacitive behavior of the system[39].
After the polarization study,the electrodes in both the stacks were connected through an external resistance(Rext)of 100 Ω during the experiment based on polarization study.This Rextwas kept for the system to operate in a proper range of voltages and intensities,preventing activation losses [8].In the dependent connection,the effluent from the first cell will go as the influent for the second cell and in independent connection,all the cells receive feed from the reservoir.This means that all the individual cells in the PID stack will receive same COD.The highest current was obtained in PID with a value of~2.4 mA whereas,the PD stack attained the highest current of~1.2 mA (Fig.5d).The PID stack was fed with separate feed into each reactor,thereby giving each reactor higher COD in comparison to the PD stack.Higher the inlet COD,higher will be the consumption of COD into the system and higher will be the number of electrons generated and transferred to the cathode giving rise to more current.
3.4.Effect of rate of COD consumption on power
The batch stacks were run for 5 cycles and the continuous stacks were run for 60 days.The COD consumption rate and the highest power that was attained during the run time are plotted in Fig.6.Since power generation relies directly upon the organic matter utilization,it can be distinctly observed from Fig.6 that the power generation increases with the increase in COD consumption rate.The batch(S and P)stacks received the organic load once in 3 days while the continuous stacks(PD and PID)received a continuous supply of organic load.The overall COD entering into the batch stacks is lower than the continuous stacks.Therefore,the utilization of organic matter into the batch stack was much lower than the continuous stacks which lead to lower rate of COD consumption.Even among both the continuous stacks,the PID stack had a better rate of COD consumption as discussed earlier.This leads to highest power generation in PID stack.Higher power corresponding to the higher COD consumption rate suggests that both the factors depend directly onto the generation and transfer of electrons to the anode.
3.5.Coulombic efficiency

Fig.5.Performance of the continuous stacks:(a) OCV;(b) current density vs.voltage;(c) current density vs.power density and (d) current.

Fig.6.Effect of rate of COD consumption on power.
The series (S) stack showed the minimum coulombic efficiency(0.16%).Parallel (P) stack showed higher CE compared to that of the series stack (1.38%).Higher resistances in the series stack can be the reason behind the lower CE obtained.The parallel batch stack has lower overall resistance as compared to the series (S)stack [30],which was the reason for higher CE in the parallel (P)stack.The batch stacks face the substrate depleting condition at the end of each cycle producing fewer electrons.The CE was increased when the system was run in continuous mode.The reason behind the improved CE in continuous mode is that the stacks PD and PID receive continuous supply of organic load.The microorganisms present on the anode biofilm and anode chamber get the continuous supply of substrate which helps in generating more electrons through consumption of organic matter,thereby increasing the CE in continuous mode.The CE of the PID was the highest(14.26%) which was approximately 3 times that of the PD stack(4.87%).The highest CE in the PID stack can be due to the highest rate of COD consumption which facilitates transfer of the highest number of electrons from anode.
3.6.Viability of individual cell in the continuous stacks
The purpose of this study was to find out whether all the units of the stacks were performing efficiently or not at the end of the 60th day of performance evaluation.If the individual unit in the stack goes faulty,it would affect the current production in the stack ultimately lowering the overall performance of the stack.While working with the parallel circuit,addition of two individual MFCs would increase the current produced by single MFC and so on with subsequent addition of other units.As we can see the trend in Fig.7 that on addition of individual units into the stack,the overall current of the stack increases subsequently.This can be deduced from the ladder pattern of Fig.7.After addition of each individual unit into the stack,the stack was kept for 12 hours and the values of the current were recorded hourly.After the addition of all units into the stacks,the current generated was corresponding to the highest current produced during the performance evaluation of the PD and PID stacks.

Fig.7.Performance evaluation of individual MFC unit into the stack.
4.Conclusions
It can be concluded from the study that the rate of COD consumption depends directly on the OLR and also the power generation corresponds directly to the rate of COD consumption.The hydro-dynamically independent stack performs better than the other stacks in terms of power generation despite having lower COD removal efficiency.The maximum current produced by the PID stack was 2.4 mA in continuous mode operation.The hydrodynamically independent pattern can be used in the stacking of the MFCs for higher current production.Though it has lesser COD removal efficiency,but when the purpose of the study is to generate higher power,PID stacks can be a useful way to stack the MFCs.
Declaration of Competing Interest
The authors declare that they have no known competing financial interests or personal relationships that could have appeared to influence the work reported in this paper.
Acknowledgements
Grants received from the DST-SERB,Government of India (File No.EEQ/2016/000802) to carry out this work is duly acknowledged.
杂志排行

Chinese Journal of Chemical Engineering的其它文章
- A comprehensive review of the effect of different kinetic promoters on methane hydrate formation
- An experimental study on the choked flow characteristics of CO2 pipelines in various phases
- Hydrothermal and entropy generation specifications of a hybrid ferronanofluid in microchannel heat sink embedded in CPUs
- Experimental and Numerical Study of Gas-Liquid Flow in a Sectionalized External-Loop Airlift Reactor
- Numerical simulation of heavy fuel oil atomization using a pulsed pressure-swirl injector
- Experimental research on steady-state operation characteristics of gas–solid flow in a 15.5 m dual circulating fluidized bed system