High surface area and mesoporous activated carbon from KOH-activated dragon fruit peels for methylene blue dye adsorption:Optimization and mechanism study
2021-06-26AliJawadAhmedSaudAbdulhameedLeeWilsonSyedShatirSyedHassanZeidALOthmanMohammadRizwanKhan
Ali H.Jawad ,Ahmed Saud Abdulhameed ,Lee D.Wilson ,Syed Shatir A.Syed-Hassan ,Zeid A.ALOthman ,Mohammad Rizwan Khan
1 Faculty of Applied Sciences,Universiti Teknologi MARA,40450 Shah Alam,Selangor,Malaysia
2 Department of Medical Instrumentation Engineering,Al-Mansour University College,Baghdad,Iraq
3 Department of Chemistry,University of Saskatchewan,Saskatoon,Saskatchewan S7N 5C9 Canada
4 Faculty of Chemical Engineering,Universiti Teknologi MARA,40450 Shah Alam,Selangor,Malaysia
5 Chemistry Department,College of Science,King Saud University,Riyadh 11451,Saudi Arabia
Keywords:Statistical modeling Activated carbon Dragon fruit peels Box–Behnken design Methylene blue dye Adsorption
ABSTRACT In this study,an alternative precursor for production of activated carbon was introduced using dragon fruit(Hylocereus costaricensis)peel(DFP).Moreover,KOH was used as a chemical activator in the thermal carbonization process to convert DFP into activated carbon(DFPAC).In order to accomplish this research,several approaches were employed to examine the elemental composition,surface properties,amorphous and crystalline nature,essential active group,and surface morphology of the DFPAC.The Brunauer-Emmett-Teller test demonstrated a mesoporous structure of the DFPAC has a high surface area of 756.3 m2﹒g-1.The cationic dye Methylene Blue (MB) was used as a probe to assess the efficiency of DFPAC towards the removal of MB dye from aqueous solution.The effects of adsorption input factors(e.g.DFPAC dose (A:0.04–0.12 g﹒L-1),pH (B:3–10),and temperature (C:30–50 °C)) were investigated and optimized using statistical analysis (i.e.Box–Behnken design (BBD)).The adsorption kinetic model can be best categorized as the pseudo-first order (PFO).Whereas,the adsorption isotherm model can be best described by Langmuir model,with maximum adsorption capacity of DFPAC for MB dye was 195.2 mg﹒g-1 at 50°C.The adsorption mechanism of MB by DFPAC surface was attributed to the electrostatic interaction,π-π interaction,and H-bonding.Finally,the results support the ability of DFP to be a promising precursor for production of highly porous activated carbon suitable for removal of cationic dyes (e.g.MB).
1.Introduction
Various industrial processes that manufacture cosmetics,pharmaceuticals,leather,plastics,and textile use cationic dyes,especially methylene blue (MB),as a colorant agent [1].The release of such dyes at variable levels into the aqueous environment may cause damage to the aquatic systems [2].Therefore,the removal of dyes before discharging the industrial effluent into water bodies is an urgent issue.Several methods for treatment of dyes in contaminated water include advanced oxidation processes [3],photodegradation [4],ion exchange [5],adsorption [6],and electrochemical degradation [7].Adsorption is considered one of the most sustainable approaches for the removal of dyes due to the simplicity of design,economic viability,high efficiency,and its environmentally benign nature [8,9].
Activated carbon (AC) offers multifunction performance in the field of wastewater treatment because of its unique properties such as high surface area and porosity,preferable adsorption capacity,good mechanical strength,copious functional groups,and thermal stability [10,11].However,AC is often prepared from non-renewable raw materials,for example,petroleum coke,lignite,and coal,which are unsustainable and costly precursors [12].Hence,the main challenge of AC production involves the accessibility to renewable and low-cost precursors.Consequently,research endeavors have turned to prepare the AC from sustainable,renewable,and low-cost precursors.From these precursors,lignocellulosic biomasses,which are considered a promisingalternative precursor in synthesis of AC due to its features like renewability,availability,ecological suitability,and costeffectiveness [13].In this regard,fruit and vegetable waste such as apple peel [14],orange peel [15],garlic peel [16],banana peel[17],pomelo peel [18,19] snake fruit peel [19],and potato peel[20] have been utilized as precursor to develop high quality and porous AC by various activation processes.
Many physical and/or chemical activation processes have been successfully applied for conversion of lignocellulosic biomass waste into AC [21].In some cases,the chemical activation process exhibits some desirable properties over physical activation such as larger surface area,relatively shorter treatment time of preparation and greater product yield [22].In order to achieve successful chemical activation process,the raw biomass material needs to be impregnated with desirable chemical activator such as NaOH,KOH,H3PO4,and ZnCl2before being subjected to the thermal treatment (carbonization) [23].Among various chemical activators,KOH is often a preferred activator for the preparation of AC due to its eco-friendly synthesis,high surface area of AC product,and abundant surface with oxygenated functional groups [24–30].The superior properties of AC that developed from biomass-KOH activation include a variety of functional groups and high surface area that has received great attention in various wastewater treatment applications [31].During the past decades,extensive efforts have been paid on the preparation of porous and superior carbon materials via KOH activation and their environmental applications for the removal waterborne contaminants such as pharmaceutical compound(Tetracycline)[32],phenol[33],pesticides[34],and fluoride [35].
Therefore,this research work aimed to convert dragon fruit peel(DFP)to highly porous AC by KOH-activation process.Furthermore,the applicability of the produced dragon fruit peel activated carbon(DFPAC) was directed towards removal of MB dye from aqueous solutions.To achieve maximum removal of MB dye,a statistical optimization was performed using Box-Behnken design (BBD).The BBD statistical method enables process optimization by reducing the operational cost,shorting the treatment time,and less chemical consumption and manpower [36–40].
2.Experimental
2.1.Materials
The dragon fruit (Hylocereus costaricensis) peels (DFP) were received from fresh juice shop.Methylene Blue (MB;MW:319.86 g﹒mol-1,assay:~ 99%),hydrochloric acid (HCl),and potassium hydroxide (KOH) were supplied from R&M Chemicals.
2.2.Synthesis of DFPAC
The dragon fruit (Hylocereus costaricensis) peel (DFP) was collected from fresh juice shop in local market,in Shah Alam city,Selangor state,Malaysia.The DFP was chopped into small pieces,and washed many times with ultrapure water before being dried by an oven at 80°C for 24 h.After drying,the DFP was ground into powder form with certain particle size of 250–500 μm.The chemical activation process of DFP with KOH was carried out by mixing 1 g of precursor (DFP) with 2 g of chemical activator (KOH) (this mixing ratio was predetermined to be the best).Then the mixture of precursor and chemical activator was heated to 110 °C for 24 h before being introduced to a tubular high-temperature furnace for pyrolysis.The process was carried out at 700 °C for 60 min under purified N2gas (99.99%) at 0.1 MPa.Consequently,the obtained dragon fruit peel activated carbon(DFPAC)was repeatedly washed with ultrapure water until reached to neutral pH.Then,the resultant DFPAC was subjected to drying process at 110 °C for 24 h inside an oven.The dried product of DFPAC was sieved to obtain a constant particle size of ≤250 to be utilized as adsorbent in the adsorption experiments.

Fig.1.XRD pattern of DFPAC.
2.3.Characterization
The surface property of DFPAC was investigated using surface area analyzer (Micromeritics ASAP 2060).The morphological aspect of DFPAC was investigated using SEM-EDX,Zeiss Supra 40 VP.The crystalline structure of DFPAC was determined using XRD,X’Pert PRO,PAnalytical.The pH at the point of zero charge(pHpzc) of the DFPAC was calculated based on method describedelsewhere[40].The fundamental functional groups of DFPAC were identified using Fourier transform infrared (FTIR) spectroscopy.The elemental composition of DFPAC was detected through CHNS-O Analyzer (Thermo-scientific).

Fig.2.FTIR spectra of DFPAC,and DFPAC after adsorption of MB dye.
2.4.Experimental design
The design of the MB adsorption tests were done by Design Expert 12.0 software (Stat-Ease,Minneapolis,USA).A quadratic polynomial regression model was used for predicting the response as follows (1):

Y represents the response factor;Xiand Xjare the coded the factors;β0is the constant;βi,βiiand βijare coefficients of studied factors.17 experiments were provided by BBD for optimizing the factors affecting on the MB dye removal (%) including A:adsorbent dose(0.04–0.12 g),B:pH (3–10),C:temperature (30–50 °C) as shown in Table 1.The data of MB dye removal (%) derived from BBD are listed in Table 2.The experiments were performed by adding a certain amount of DFPAC in an Erlenmeyer flask (250 mL) containing MB dye (100 mL) before being agitated inside temperaturecontrolled water bath shaker.The MB dye concentration was determined by UV–Vis spectroscopy (HACH DR 2800) at λmax=661 nm.The MB dye removal (DR) was calculated by Eq.(2) as follows:

Table 1 Codes and ranges of independent variables at their respective levels

Table 2 The 3-varibles BBD matrix and experimental data for MB dye removal by DFPAC.

Table 3 The elemental analysis of DFPAC,textural properties of DFP and DFPAC

Fig.3.SEM images and EDX spectra of (a) DFPAC,and (b) DFPAC after adsorption of MB dye.

where Co(mg﹒L-1) and Ce(mg﹒L-1) are concentrations of the MB at initial and equilibrium,respectively.
2.5.Adsorption study of MB on DFPAC
The adsorption study of MB dye by DFPAC was accomplished in batch mode.The optimal adsorption conditions were recorded in run 12 of Table 2.These optimal adsorption conditions of MB dye removal were DFPAC adsorbent dose (0.08 g),solution pH 10,and working temperature(50°C)at various initial MB dye concentration.The adsorption capacity,qe(mg﹒g-1) of DFPAC was estimated by Eq.(3).

Table 4 ANOVA for MB dye removal

V(L)is the volume of dye solution;whereas,W(g)is mass of DFPAC.
3.Results and Discussion
3.1.Characterization of DFPAC
The elemental composition of DFPAC was determined by CHNS analysis and results were as follows:C(52.26%),H(2.90%),N(1.23%),and O(43.61%determined by difference).The textural properties of DFP and DFPAC are listed in Table 3.The surafce area results show that the DFPAC has a specific surface area (SSA) of 756.3(m2﹒g-1),with a mean pore diameter of 11.3 nm.Moreover,the results also indicate a mesoporous structure of DFPAC according to IUPAC classification[41].Remarkably,the surface area of DFPAC(SSA=756.3 m2﹒g-1) increase of ca.1575 fold as compared with unmodified DFP(SSA=0.48 m2﹒g-1).This noticeable improvement in surface area of DFPAC relates to the synergistic effects of thermal activation process with KOH as the chemical activator.
The XRD pattern of the DFPAC in Fig.1 reveals characteristic diffraction peaks (2θ=23° and 44°) that correspond to the (0 0 2) and (1 0 0) signatures,respectively.These XRD lines indicate that the DFPAC is composed of graphite crystallites [42].
The FTIR spectra of DFPAC are shown in Fig.2.The IR spectrum of DFPAC shows major peaks at 3500–3770 cm-1,2370 cm-1,1500 cm-1,and 1050 cm-1.These peaks can be assigned to the vibrations of—OH groups,C—H,C=C bond,and C—O bonds of phenols,esters,ethers,and alcohols [43,44].The FTIR of DFPAC after MB uptake reveals a spectral profile close to DFPAC with shifting in some IR bands,providing support that various functional groups of DFPAC participate in MB uptake.
SEM-EDX test was adopted to examine the morphological structure and elemental composition of DFPAC.The surface morphology of DFPAC appears as irregular highly porous surface with a spongelike structure(Fig.3a).This surface property is very much desirable for capturing aromatic dye compounds such as MB.The EDX analysis detects the occurrence of C,O,Ca,and Zr elements in the structure of DFPAC.After MB dye adsorption,the surface of DFPAC(Fig.3b) is more compact with attenuated porosity due to loading of MB dye molecules on its surface.Another confirmation was made by EDX analysis which detects the presence of S (from molecular structure of MB dye) on the surface of DFPAC.

Fig.4.(a) Normal probability plot of residuals for MB removal efficiency,(b) plot of the relationship between the predicted and actual values of MB removal (%).

Fig.5.(a)3D response surface plot,(b)contour plot of MB removal efficiency showing interaction between adsorbent dose and temperature,and(c)3D response surface plot,(d) contour plot of MB removal efficiency showing interaction between pH and temperature and (e) pHPZC of DFPAC.
3.2.BBD model analysis
Analysis of variance (ANOVA) was adopted for the statistical analysis of the experimental data as illustrated in Table 4.The F-value of model was 14.35 (p-value=0.0010),revealing that the BBD was statistically considerable [45].The high correlation between actual and expected values of MB dye removal can be concluded from the coefficient of determination (R2=0.95).Statistically,the BBD model factors are significant when the pvalue <0.05.Therefore,the model terms of A,C,B2,C2,AC and BC are statistically significant.The terms with p-value>0.05 were excluded for the model to obtain the best-fit according to Eq.(4).

Table 5 PFO and PSO kinetic parameters for MB adsorption on DFPAC
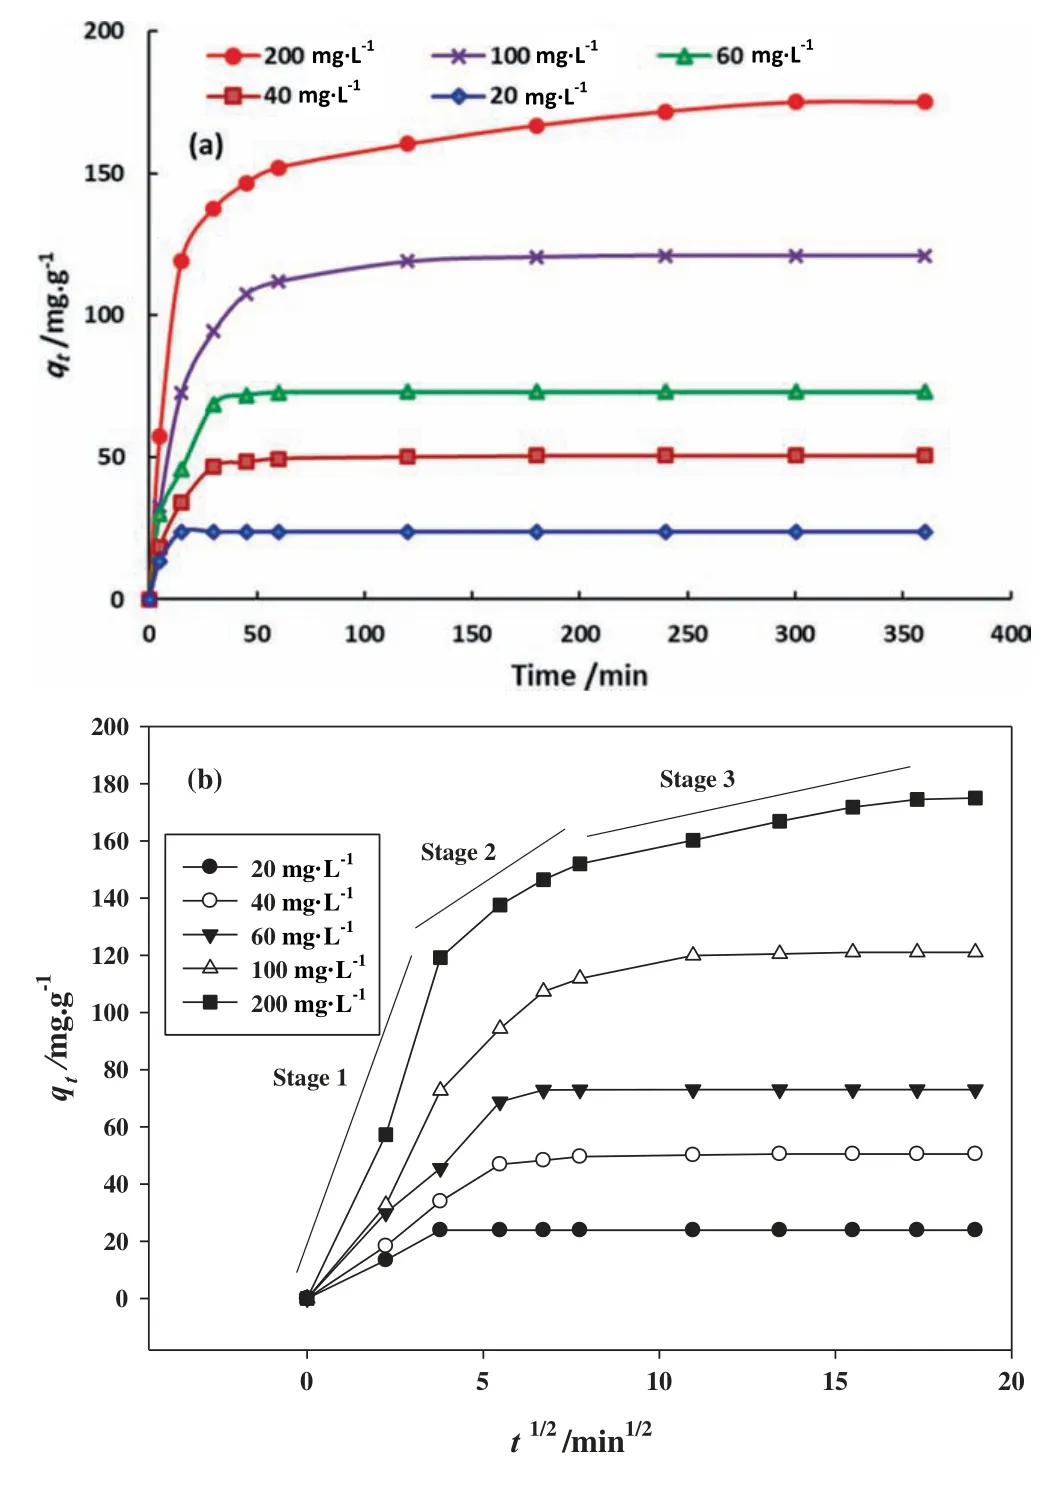
Fig.6.(a) Effect of the contact time on MB adsorption at different initial concentrations and (b) Intra-particle diffusion plots for the adsorption of MB onto DFPAC at different initial concentration(adsorbent dose=0.08 g,pH of solution=10,temperature=50 °C,agitation speed=100 strokes/min and volume of solution=100 mL).

Graphical analysis is one of methods applied for the validation of the model through evaluating the nature of residuals distribution and actual and predicted values for the response.Fig.4a and b depicts the normal probability of the residuals,and predicted vs.actual plot,respectively.According to Fig.4a,the normal distribution of residuals was seen,and all points are in the range;whereas,Fig.4b demonstrates the experimental values appear as a straight line,indicating to the predicted values are in agreement with the actual values.These observations reflect the statistical validation of the BBD [46].
3.3.BBD significant interactions
The interaction between A:adsorbent dose and C:temperature was statistically significant(p-value=0.0032).The 3D and 2D plots of the interaction between adsorbent dose and temperature are illustrated in Fig.5a and b,respectively.It is clearly shown from Fig.5a and b that the MB dye removal (%) increased from 30.1 %to 92.3 %.The effect relates to an increasing diffusion rate of MB dye within the internal structure of the DFPAC.Furthermore,the results demonstrate that MB dye adsorption by DFPAC is an endothermic process.In Fig.5a and b,the dye removal (%)increases with increasing amount of DFPAC (0.04 g to 0.12 g).The aforementioned finding may attribute to the increasing in surface area of DFPAC and/or higher number of active adsorption sites.
The interaction between the terms B:pH and C:temperature was also statistically significant (p-value <0.0001).The 3D and 2D plots of the interaction between pH and temperature are shown in Fig.5c and d,where the MB dye removal (%) increased with pH from 3 to 10.The pHpzcof the DFPAC was 9.2 as shown in Fig.5e,revealing the ability of DFPAC surface on possession the positive charge at pH The MB adsorption by DFPAC adsorbent as a function of contact time at different MB concentrations (20,40,60,100,and 200 mg﹒L-1)was carried out as shown in Fig.6a.Additional parameters such as adsorbent dosage (0.08 g/100 mL),solution pH 10,and temperature (50 °C) were constant.Fig.6a shows continuous increment in the adsorption capacity (qt) of DFPAC from 23.9 to 175.0 mg﹒g-1by increasing initial MB dye concentration from 20 to 200 mg﹒L-1.This observation can be explained as follows;the higher concentrations of MB dye in the bulk solution will create higher driving force for accelerating the movement of MB dye molecules to the active adsorption (binding) sites on the surface of DFPAC [47]. The kinetic models(i.e pseudo-first-order,PFO;pseudo-secondorder,PSO;Weber-Morris intra-particle diffusion)were applied to determine the kinetic parameters and mechanism of MB dye adsorption onto the DFPAC surface.The non-linear forms of PFO[48] and PSO [49] kinetic models are defined by Eqs.(6) and (7),respectively. k1(min-1) and k2(g﹒mg-1﹒min-1) are the PFO and PSO rate constants,respectively.The intraparticle diffusion model is described by Eq.(8) [50]. ki(m﹒g-1﹒min-1/2) and C (mg﹒g-1) represent rate constant of intraparticle diffusion and constant,respectively. The data of PSO and PFO models are recorded in Table 5.The results show the adsorption process of MB dye obeys the PFO model,based on the greater R2values,as compared with the PSO model.In addition to the calculated qevalues of PFO are close to experimental qecompared to PSO values.The findings reveal that MB dye uptake by DFPAC was governed by a physisorption process [51].The plots and studied parameters of intra-particle diffusion are given in Fig.6b and Table 6,respectively.From Fig.6b,three sections of linearity can be seen,signifying that the intra-particle diffusion of the adsorption process of MB dyeby DFPAC was not the only rate controlling step in the adsorption process [34]. Table 6 Parameters of intra-particle diffusion model at various initial MB concentrations Table 7 Parameters of the Langmuir,Freundlich and Temkin isotherm models for MB dye adsorption by DFPAC at 50 °C Table 8 Comparison of adsorption capacities for MB dye by different activated carbon materials prepared by KOH activation Adsorption isotherm is a fundamental analysis for understanding the interaction between DFPAC and MB dye.In order to assessthe ability of DFPAC to adsorb of MB dye,a non-linear form of Langmuir[52],Freundlich[53],and Temkin[54]models were used for fitting the experimental data.Langmuir,Freundlich,and Temkin non-linear equations are expressed by Eqs.(9)–(11),respectively. Fig.7.Adsorption isotherms of MB by DFPAC (adsorbent dose=0.08 g,pH of solution=10,temperature=50 °C,agitation speed=100 strokes per min and volume of solution=100 ml). Fig.8.Illustration of the possible interaction between DFPAC surface and MB dye including electrostatic attraction,hydrogen bonding interactions,and π -π interactions. qmax(mg﹒g-1) is maximum adsorption capacity.Ka(L﹒mg-1) is the Langmuir isotherm constant;n is adsorption intensity;Kf(mg﹒g-1)-﹒(L﹒mg-1)1/nis the Freundlich constant;bT(J﹒mol-1) is heat of adsorption;T (K) is temperature in Kelvin;KT(L﹒mg-1) is Temkin constant;R (8.314 J﹒mol-1﹒K-1) is the universal gas constant [55].The plot and function of the isotherms are shown in Fig.7,and Table 7,respectively.From Table 7,it was proven that the Langmuir isotherm was the best model to describe a homogeneous surface and monolayer adsorption of MB dye onto DFPAC surface with highest R2of 0.99.The maximum adsorption capacity(qm)of DFPAC for MB dye was 195.2 mg﹒g-1at 50°C.The qmof DFPAC was compared with others adsorption capacities of ACs prepared from biomass materials by various activation agents as illustrated in Table 8.It can be deduced from Table 8 that DFPAC was an effective porous adsorbent for efficient removal of the cationic dyes from aqueous media. The mechanism of MB dye adsorption on the surface of DFPAC was deduced based on the FTIR spectra,which is supported by the presence of hydroxyl (OH) groups and C—O bonds of esters,alcohols,phenols,and ethers.Based on that,there are several interactions that can contribute to the MB dye adsorption process illustrated in Fig.8.The adsorption process is driven by electrostatic attractions between oxygenated functional groups(acidic or negatively charged groups)on the surface of DFPAC and the cationic MB dye species.Similar trends were reported for the adsorption of an organic pharmaceutical compound(paracetamol)on the surface of activated carbon prepared from biomass waste via KOH activation[29].Hydrogen bonding interaction between H atoms of the DFPAC surface and N atom in the MB dye was another possible factor as shown in Fig.9.In fact,the hydrogen bonds are very much preferable between oxygen-functional groups such as hydroxyl (—OH),epoxy (—O—) and carbonyl (—C=O) groups with organic compounds,as observed with graphene oxide [65].Besides that,π–π electron donor–acceptor interactions (cf.Fig.9) can be occurred between hexagonal skeleton of DFPAC and aromatic rings of MB dye.This type of interaction was frequently observed with adsorption of MB dye by various activated carbon-based materials such as bamboo chip [62],and low-rank coal [58,66]. Dragon fruit peel activated carbon (DFPAC) was successfully prepared by thermal treatment of dragon fruit peel (DFP) with KOH-activation at 700 °C for 60 min with a fixed impregnation ratio(1 g DFP:2 g KOH).DFPAC was applied as an effective adsorbent for the removal of MB dye with a maximum adsorption capacity (qm) of 195.2 mg﹒g-1.The results reported herein reveal the feasibility of DFP as a low-cost precursor for the synthesis of high surface area and porous AC with high adsorption affinity toward cationic dyes.Further development can be considered in future studies by applying DFPAC in fixed bed column to solve the problem of the post treatment adsorbent recovery.Furthermore,the applicability of the DFPAC can be tested for the treatment of real wastewater and also for reduction of the chemical oxygen demand. Declaration of Competing Interest The authors declare that they have no known competing financial interests or personal relationships that could have appeared to influence the work reported in this paper. Acknowledgements The authors would like to thank the Universiti Teknologi MARA,Institute of Research Management and Innovation(Institut Pengurusan Penyelidikan &Inovasi) for funding this project underLESTARI grant (600-IRMI 5/3/LESTARI (037/2019)).The authors Zeid A.ALOthman and Mohammad Rizwan Khan are thankful to the Researchers Supporting Project(RSP-2020/138),King Saud University,Riyadh,Saudi Arabia.
3.4.Adsorption study
3.5.Kinetic study


3.6.Isotherm study


3.7.Adsorption mechanism
4.Conclusions
杂志排行

Chinese Journal of Chemical Engineering的其它文章
- A comprehensive review of the effect of different kinetic promoters on methane hydrate formation
- An experimental study on the choked flow characteristics of CO2 pipelines in various phases
- Hydrothermal and entropy generation specifications of a hybrid ferronanofluid in microchannel heat sink embedded in CPUs
- Experimental and Numerical Study of Gas-Liquid Flow in a Sectionalized External-Loop Airlift Reactor
- Numerical simulation of heavy fuel oil atomization using a pulsed pressure-swirl injector
- Experimental research on steady-state operation characteristics of gas–solid flow in a 15.5 m dual circulating fluidized bed system