Postmortem Metabolite Profile Changes of Mud Crab (Scylla paramamosain)Under Different Storage Conditions
2021-06-25ZHANGLiminGUOLipingMUChangkaoYEYangfangandWANGChunlin
ZHANG Limin, GUO Liping, MU Changkao, YE Yangfang, and WANG Chunlin
Postmortem Metabolite Profile Changes of Mud Crab ()Under Different Storage Conditions
ZHANG Limin, GUO Liping, MU Changkao, YE Yangfang*, and WANG Chunlin*
,,315211,
Mud crab () is oneof the most consumed crabs in China. Generally, it is believed that dead mud crabs are not edible. Herein, we investigated the postmortem metabolite profile changes of the muscle and hepatopancreas of mud crab associated with storage method using nuclear magnetic resonance-based metabolomics coupled with multivariate data analysis. Our results showed that postmortem changes of trimethylamine, organic acids (lactate, formate, and succinate), as well as ATP and its breakdown products are closely affected by the storage method. These metabolites can be used as indicators for monitoring loss of crab freshness. Furthermore, dead mud crabs preserved an edible quality at least for 4h at room temperature, 12h on ice, and 16d at −20℃, strongly suggesting that dead crab consumption quality should be determined by freshness. They shouldn’t be discarded without considering the effects of different storage conditions on their freshness.
mud crab; freshness; metabolite profiling; nuclear magnetic resonance
1 Introduction
Metabolite composition is an important parameter for assessing food quality and safety (Wishart, 2008). In this regard, analysis of food molecular nutritional composition (metabolome) and its variations associated with quality becomes a very useful foodomics approach for food quality assessment at a molecular level. This is because metabolomics analysis can provide more chemical details than traditional food component analysis (Gallo and Ferranti, 2016). Nuclear magnetic resonance (NMR)-based meta- bolomics technique is among the core foodomics techno- logies that holistically capture the metabolite composition of food (Wishart, 2008). It has been proven to be a valuable tool for assessing authenticity (Li., 2016; Pe- trakis., 2016), safety (Cappello., 2018), and qua- lity (Harnly., 2018) of food. Such applications have been especially conducted to understand the quality change of aquatic food such as Atlantic salmon fillets (Shumilina., 2015), vinasse pike eel (Chen., 2017), and mud crab (Li., 2019).
Mud crab () is among the most consumed crabs in China due to its delicious flavor, taste, and nutritional composition (Ye., 2011). It is generally believed that dead mud crab is not edible, resulting in abandonment of dead mud crabs and huge economy loss. Actually, a rapid accumulation of harmful metabolites such as biogenic amines and sulfur compounds have been foundin dead Chinese mitten crab () (Yang., 2016; Zhu., 2017; Wang., 2018). Precisely, trime- thylamine (TMA) is toxical to the human (Anthoni., 1991) and has been widely used as an important indicator of freshness of aquatic products (Zhao., 2002; Shu- milina., 2015). Our previous study revealed a signi- ficantly increased TMA level with fermentation of crab paste, which may pose a health risk to humans (Chen., 2016). Furthermore, TMA and total volatile base-nitrogen (TVB-N) both increase with storage time in whole blue crabs () due to metabolism by spoilage bacteria (Parlapani., 2019). In addition, histamine is frequently implicated in fish poisoning (Mercogliano and Santonicola, 2019). Thoughthe quality of mud crab changes after death, whether dead mud crab is still safe for con- sumption is yet to be determined. The postmortem meta- bolite changes can be an important indicator for assessing the quality and safety of mud crab; however, little informa- tion is available for such changes.
In this study, NMR-based metabolomics analysis and multivariate data analysis were applied to systematically analyze the postmortem changes in metabolite composition of edible tissues, including muscle and hepatopancreas, of mud crab at room temperature, on ice, or at −20℃. The pre- sent study aimed to: i) investigate the postmortem meta- bolite profile changes of mud crab with different storage methods; and ii) assess the safety and quality of dead mud crab.
2 Materials and Methods
2.1 Chemicals and Reagents
The following chemicals and reagents (all of analytical grade) were purchased from commercial suppliers: metha- nol, dipotassium hydrogen phosphate trihydrate and sodium dihydrogen phosphate dihydrate (Sinopharm Chemical Co., Ltd., Shanghai, China); sodium 3-trimethylsilyl [2, 2, 3, 3-2D4] propionate (TSP) and deuterated water (D2O, 99.9% in D) (Cambridge Isotope Laboratories, FL,Miami, USA). Phosphate buffer (K2HPO4/NaH2PO4, 0.1molL−1,pH 7.48) was prepared in water (H2O) containing 80% D2O (to provide an NMR field lock) and 0.001%TSP (w/v) (to serve as an internal standard) (Xiao., 2008).
2.2 Sample Treatment
A total of 160 live male mud crabs (about 150g) were purchased from a local Crab Breeding Company (Ningbo, China) and transported to the laboratory within approxi- mately one hour. Eight live crabs were randomly collect- ed as live control group (LCK group). Four experimental treatments were set up: dead crabs kept at room tempera- ture (RT group); dead crabs kept on ice (OI group); dead crabs kept at −20℃ (DMT group); live crabs kept at −20℃ (LMTgroup). For LMT group, 40 live crabs were random- ly chosen and anesthetized.Then theywere frozen at −20℃ and kept in −20℃ for 1, 2, 4, 8, and 16d. For RT group, the dead crabs were obtained immediately after natural death of crabs at room temperature. Eight recently dead crabs were immediately chosen as dead control group (DCK group). The remaining 32 dead crabs were collected after they were kept at room temperature for 2, 4, 8, and 12h. For OI group, additional 32 recently dead crabs were kept on ice and collected after they were kept on ice for 2, 4, 8, and 12h. For DMT group, additional 40 recently dead crabs were kept at −20℃ and collected at five time intervals: 1, 2, 4, 8, and 16d. After the samples were collected at cer- tain time, muscle and hepatopancreas tissues were collect- ed from each sampled crab immediately and snap frozen in liquid nitrogen, followed by storage at −80℃ until me- tabolomics analysis. Eight replicates (one crab per replicate) were used for each sampling time point for each group.
2.3 Metabolite Extraction of Muscle and Hepatopancreas
Each tissue sample (300mg) was homogenized with 1 mL ice-cold aqueous methanol (methanol/water=2:1) us- ing a tissuelyzer (QIAGEN, Hilden, Germany) at 20Hz for 90s. After 10min of centrifugation at 12000rmin−1and 4℃, the resulting supernatant of the homogenate mix- ture was collected. The same extraction procedure was re- peated once more for the remaining solid residues. The supernatant was combined and condensedforremoval of methanol. After lyophilization, each extract was dissolved in 600mL phosphate buffer. Following a 10min centrifugation at 12000rmin−1and 4℃, 550mL of superna- tant from each extract was pipetted into 5mm NMR tube for NMR analysis.
2.4 NMR Analysis
NMR analysis of the tissue extracts was conducted on a Bruker Avance III 600MHz spectrometer (Bruker Biospin, Germany) operating at 600.13 and 150.90MHz for1H and13C, respectively. One-dimensional1H NMR spectra were acquired at 298K using a NOESYGPPR1D pulse se- quence with an inverse cryogenic probe. The water signal was suppressed by a weak continuous wave irradiation du- ring a 2s relaxation delay and a 100 milliseconds mixing time. Meanwhile, a 90˚pulse length was adjusted to ap- proximately 10 microseconds. Sixty-four transients were collected into 32768 data points for each1H NMR spectrum, with a spectral width of 20ppm. For metabolite sig- nal assignment purposes, five two-dimensional (2D) NMR spectra were acquired for selected samples and processed with similar parameters described previously (Aue.,1976a, 1976b; Braunschweiler and Ernst, 1983). These 2D spectra included1H-resolved spectroscopy,1H-1H correlation spectroscopy,1H-1H total correlation spectroscopy,1H-13C heteronuclear single quantum coherence, and1H-13C heteronuclear multiple bond correlation spectra.
2.5 NMR Data Processing and Multivariate Data Analysis
All1H NMR free induction decays were multiplied by an exponential line broadening function of 0.5Hz before Fourier transformation by TOPSPIN (V2.0, Bruker Biospin,Germany). Furthermore, these spectra were phase- and baseline-corrected manually and calibrated to the proton signal from TSP at δ 0.00. For multivariate data analysis, the region δ 0.8–9.2 of each1H NMR spectrum was uniformly bucketed into bins with a 2.4Hz width. Regions δ 4.7–5.1 and δ 3.34–3.37 were removed to eliminate solvent signals. The integrated areas of all bins were norma- lized to the total spectral intensity for each spectrum to compensate for overall concentration differences between the samples.
The spectral datasets were imported into SIMCA-P+soft- ware (V12.0, Umetrics, Umeå, Sweden) for multivariate data analysis. An unsupervised principal component ana- lysis (PCA) was initially performed using the mean-cen- tered NMR data to generate an overview of group cluster- ing and search for possible outliers. A supervised ortho- gonal projection to latent structure discriminant analysis (OPLS-DA) was sequentially carried out using unit variance-scaled NMR data (Trygg and Wold, 2002; Berg., 2006). A seven-fold cross validation was used with NMR data (-matrix) and group information (-matrix) (Trygg., 2007). The quality of all OPLS-DA models was eva- luated with2,2, and2values, which respectively indicate the explained variations and model predictability, and further validated for their robustness with a cross va- lidation-analysis of variance (CV-ANOVA), with<0.05 set as the significance level (Eriksson., 2008). Inorder to facilitate the interpretation of results, a back-scaled transformation of the loadings of each variable con- tributing to the model (Cloarec., 2005) was conduct- ed and plotted with a color-coded coefficient that indicates the weights of discriminatory variables in MATLAB (V7.1, Mathworks Inc., Natick, MA, USA) using an in- house developed script. A hot color (red) indicates that the metabolite is significantly different between groups, while a cool color (blue) indicates no significant differences. A cutoff value of 0.666 was utilized in this study and the metabolites with an absolute value of>0.666 were considered statistically significant (<0.05).
3 Results
3.1 NMR Spectra for Muscle and Hepatopancreas
Resonance peaks were assigned to specific metabolites based on data obtained from other researches (Fan and Lane, 2008; Chen., 2016) and were further confirm- ed according to the homonuclear or heteronuclear corre- lations provided by a series of 2D NMR spectra (Fig.1).The detailed metabolite NMR data are listed in Table 1. A total of 32 metabolites were identified. The dominatingmetabolites identified from the muscle and hepatopancreas NMR spectra included amino acids (leucine, isoleucine, valine, threonine, alanine, methionine, glutamate, gluta- mine, lysine, glycine, arginine, tyrosine, phenylalanine, and tryptophan), a derivative of glycine (sarcosine), orga- nic acids (lactate, acetate, succinate, formate, sarcosine, fu- marate, and taurine), organic amines (trigonelline, histamine, and TMA), ATP and its breakdown products (adeno- sine diphosphate (ADP), adenosine monophosphate (AMP), and inosine), betaine, trimethylamine-N-oxide (TMAO), glucose, and 2-pyridinemethanol. Most of the low-mole- cular-weight metabolites found in the muscle and hepato- pancreas spectra were similar. However, the different tis- sues contained their own dominant metabolites. For ins- tance, acetate, fumarate, AMP, ADP, ATP, and trigonelline dominated in the muscle, whereas sarcosine and try- ptophan dominated in the hepatopancreas. The differences in composition might be related to the structure and func- tion of the tissue. In the same tissue, the composition of metabolites was similar between different groups; however, there were differences in peak intensity in the1H NMR spectra between live and dead crabs (Fig.1). For instance, the dead crabs had an increased inosine level and decreased ATP level in the muscle, and an increased lactate level in the hepatopancreas compared with the live crabs.

Fig.1 Typical 1H nuclear magnetic resonance spectra of tissue extracts from live control mud crabs (LCK) and live mud crabs kept at −20℃ for 16d (LMT16). The dotted regions were vertically expanded 16 times in the muscle and eight times in the hepatopancreas compared to the chemical shift (δ) range of 0.8–4.8. Resonance assignments are shown in Table 1. Keys: 1, isoleucine; 2, leucine; 3, valine; 4, lactate; 5, threonine; 6, alanine; 7, acetate; 8, methionine; 9, glutamate; 10, succinate; 11, glutamine; 12, sarcosine; 13, lysine; 14, glycine; 15, arginine; 16, betaine; 17, taurine; 18, trimethylamine-N- oxide; 19, β-glucose; 20, a-glucose; 21, trimethylamine; 22, histamine; 23, 2-pyridinemethanol; 24, adenosine monopho- sphate; 25, fumarate; 26, tyrosine; 27, phenylalanine; 28, tryptophan; 29, formate; 30, trigonelline; 31, inosine; 32, ATP; 33, adenosine diphosphate.

Table 1 1H and 13C NMR data of metabolites in the muscle and hepatopancreas of mud crab
Notes:aMultiplicity: s, singlet; d, doublet; t, triplet; q, quartet; m, multiplet; dd, doublet of doublets; dt, doublet of triplets; td, triplet of doublets.bTissues: M, muscle; H, hepatopancreas.
3.2 Metabolite Changes Associated with Storage Method
To obtain more details of time-dependent changes of me- tabolites in the muscle and hepatopancreas of dead crabs due to the influence of different storage methods, multivariate data analysis was further performed on the NMR data. PCA analysis was first performed on the normalized1H NMR data of all crab muscle extracts. The mean va- lues of PC1 and PC2 from each muscle group were cal- culated for the PCA model. The trajectory plot of PC1 ver- sus PC2 illustrating the global metabolic changes during the whole storage time as well as the influence of storage method is shown in Fig.2. Here, each coordinate represents an average of scores for eight muscle hepatopancreas ex- tracts in a storage group at a particular storage time. For muscle, the trajectory illustrated that the greatest change of metabolic profiles among the four groups was found in RT crab muscle. The metabolic profiles obtained from OI crab muscle presented a relative stable change. Although the storage time was prolonged to 16d, the metabolic profiles obtained from DMT and LMT crab muscles still present- ed a smaller change than those of RT crab muscle. More- over, OI, DMT, and LMT crab muscles presented a dif- ferent metabolic change. Among them, LMT crab muscle had the closest metabolic profile to fresh LCK crab mus- cle. For hepatopancreas, the metabolic trajectory also de- monstrated the greatest change of metabolic profile in RT crabs. Storage OI obviously reduced the change of meta- bolic profile relative to storage at RT. Similarly, 16 days stor- age at −20℃ presented a smaller change in the metabolite profiles than 12h storage at RT. These observations sug- gest that storage method had an obvious influence on me- tabolite composition of edible tissues in mud crab and the storage temperature plays an important role in it.

Fig.2 Mean score trajectories of PCA of 1H NMR spectra data for the muscle and hepatopancreas extracts of mud crabs. LCK is the start point of each trajectory. Each symbol on the PCA plot symbolizes the mean of eight tissue samples in each group. The symbols became larger over the time of storage. LCK, live control crabs; DCK, dead control crabs; RT12, dead crabs kept at room temperate for 12h; OI12, dead crabs kept on ice for 12h; DMT16, dead crabs kept at −20℃ for 16d; LMT16, live crabs kept at −20℃ for 16d.
To obtain detailed information on the altered metabo- lites of dead crabs associated with different storage me- thods, OPLS-DA model was created on the NMR data of each crab group against the live crab group. Eight con- structed OPLS-DA models had good qualities based on the high2values and lowvalues obtained from CV- ANOVA evaluation (Fig.3 left and Fig.4 left). These va- lid OPLS-DA models were constructed from the muscle NMR data of RT8, RT12, LMT8, and LMT16, as well as the hepatopancreas NMR data of RT2, RT12, DMT8, and DMT16. Corresponding coefficient plots of OPLS-DA (Fig.3 right) display a significant intergroup difference of metabolites between live control crabs and dead crabs un- der different storage conditions. The corresponding corre- lation coefficients of these metabolites are listed in Table 2. Our results showed that 8h storage at RT induced a significant elevation of muscle lactate, succinate, and ino- sine, accompanied with a decline of muscle taurine, TMAO, and ATP (Fig.3A). Moreover, 12h storage at RT caused a significant elevation of muscle TMA, lactate, and formate, and a significant decline of muscle TMAO and ATP (Fig.3B).When the live crabs were stored at −20℃, the muscle for- mate and AMP were significantly accumulated, whereas the muscle ADP and ATP were significantly depleted at 8d postmortem (Fig.3C); the muscle lactate and AMP were significantly accumulated, whereas the muscle tyrosine and ADP were significantly depleted at 16d postmortem (Fig.3D).
For the hepatopancreas, 2h storage at RT resulted in a significant decrease of leucine, isoleucine, valine, tyrosine, phenylalanine, and TMAO (Fig.4A), whereas 12h storage at RT resulted in a significant increase of lactate, alanine, succinate, and formate (Fig.4B). After storing the dead crabs at −20℃, a significant elevation in the levels of isoleucine,leucine, valine, glycine, and inosine was observed at 8d postmortem (Fig.4C). A significant elevation in the level of inosine and a significant depletion in the level of sar- cosine were further observed at 16d postmortem (Fig.4D).
The dynamic changes of some metabolites with differ- ent storage time were calculated by comparing the con- centration ratios of dead crab groups with those of the live control group and are shown in Fig.5. Overall, a persis- tent rise of the muscle TMA as well as of the muscle and hepatopancreas lactate, formate, and succinate occurred throughout 12h storage at room temperature.The muscle lactate, formate, and TMA had the most substantial rise up to 3.7, 9.8, and 5.6-fold, respectively, relative to live control level at 12h postmortem, whereas the hepatopan- creas succinate had a 1.6-fold elevation relative to live control level. We also found a lasting decline in ATP level, a first increase and then decrease in the level of ADP and AMP, as well as a lasting elevation in the level of inosine in the muscle at room temperature. These changes were highlighted in a 91.0% depletion of ATP and 618.1% ac- cumulation of inosine at 12h postmortem. Such a rapid hydrolysis of ATP is in agreement with previous report, where ATP is degraded within the first 24h postmortem (Ocaño-Higuera., 2011). However, storage on ice ob- viously reduced the changes of the above metabolites, ex- cept for ADP and AMP. Notably, only slight changes oc- curred in the levels of lactate, formate, succinate, and TMA in the muscle and/or hepatopancreas during 12h of stor- age on ice. These observations suggest that storage on ice is an efficient method for reducing the metabolite profile changes in mud crabs.

Fig.3 OPLS-DA scores plots (left) and corresponding color-coded correlation coefficient loadings plots (right) derived from NMR data for the crab muscle extracts associated with different storage methods. (A) LCK (black square) vs. RT8 (light orange triangle); (B) LCK (black square) vs. RT12 (orange triangle); (C) LCK (black square) vs. LMT8 (green diamond); (D) LCK (black square) vs. LMT16 (blue diamond). See Table 1 for metabolite identification key.

Table 2 Correlation coefficients of significantly altered metabolites in the tissues after mud crab death
()
()

MetabolitesCorrelation coefficients (r*) MuscleHepatopancreas RT8/LCKRT12/LCKLMT8/LCKLMT16/LCKRT2/LCKRT12/LCKDMT8/LCKDMT16/LCK Valine----−0.78-0.84- Alanine-----0.71-- Glycine------0.81- Tyrosine---−0.73−0.72--- Phenylalanine----−0.70--- Taurine−0.76------- Sarcosine-------−0.69
Notes:*positive and negativevalues indicate positive and negative correlation of the concentrations, respectively.=0.666 was used as cutoff value of correlation coefficient for statistical significance based on the discrimination significance. ‘-’ means the correlation coeffi- cient || is less than the cutoff value. ‘/’ means metabolite is not detected in the tissue. LCK, live control crabs; RT2, RT8, RT12, dead crabs kept at RT for 2, 8, and 12h, respectively; LMT8 and LMT16, live crabs kept at −20℃ for 8 and 16d, respectively; DMT8 and DMT16, dead crabs kept at −20℃ for 8 and 16d, respectively; AMP, adenosine monophosphate; ADP, adenosine diphosphate; TMAO, trimethylamine-N-oxide.

Fig.4 OPLS-DA scores plots (left) and corresponding color-coded correlation coefficient loadings plots (right) derived from NMR data for the crab hepatopancreas extracts associated with different storage methods. (A) LCK (black square) vs. RT2 (blue triangle); (B) LCK (black square) vs. RT12 (orange triangle); (C) LCK (black square) vs. LMT8 (orange star); (D) LCK (black square) vs. LMT16 (blue star). Table 1 shows metabolite identification key.
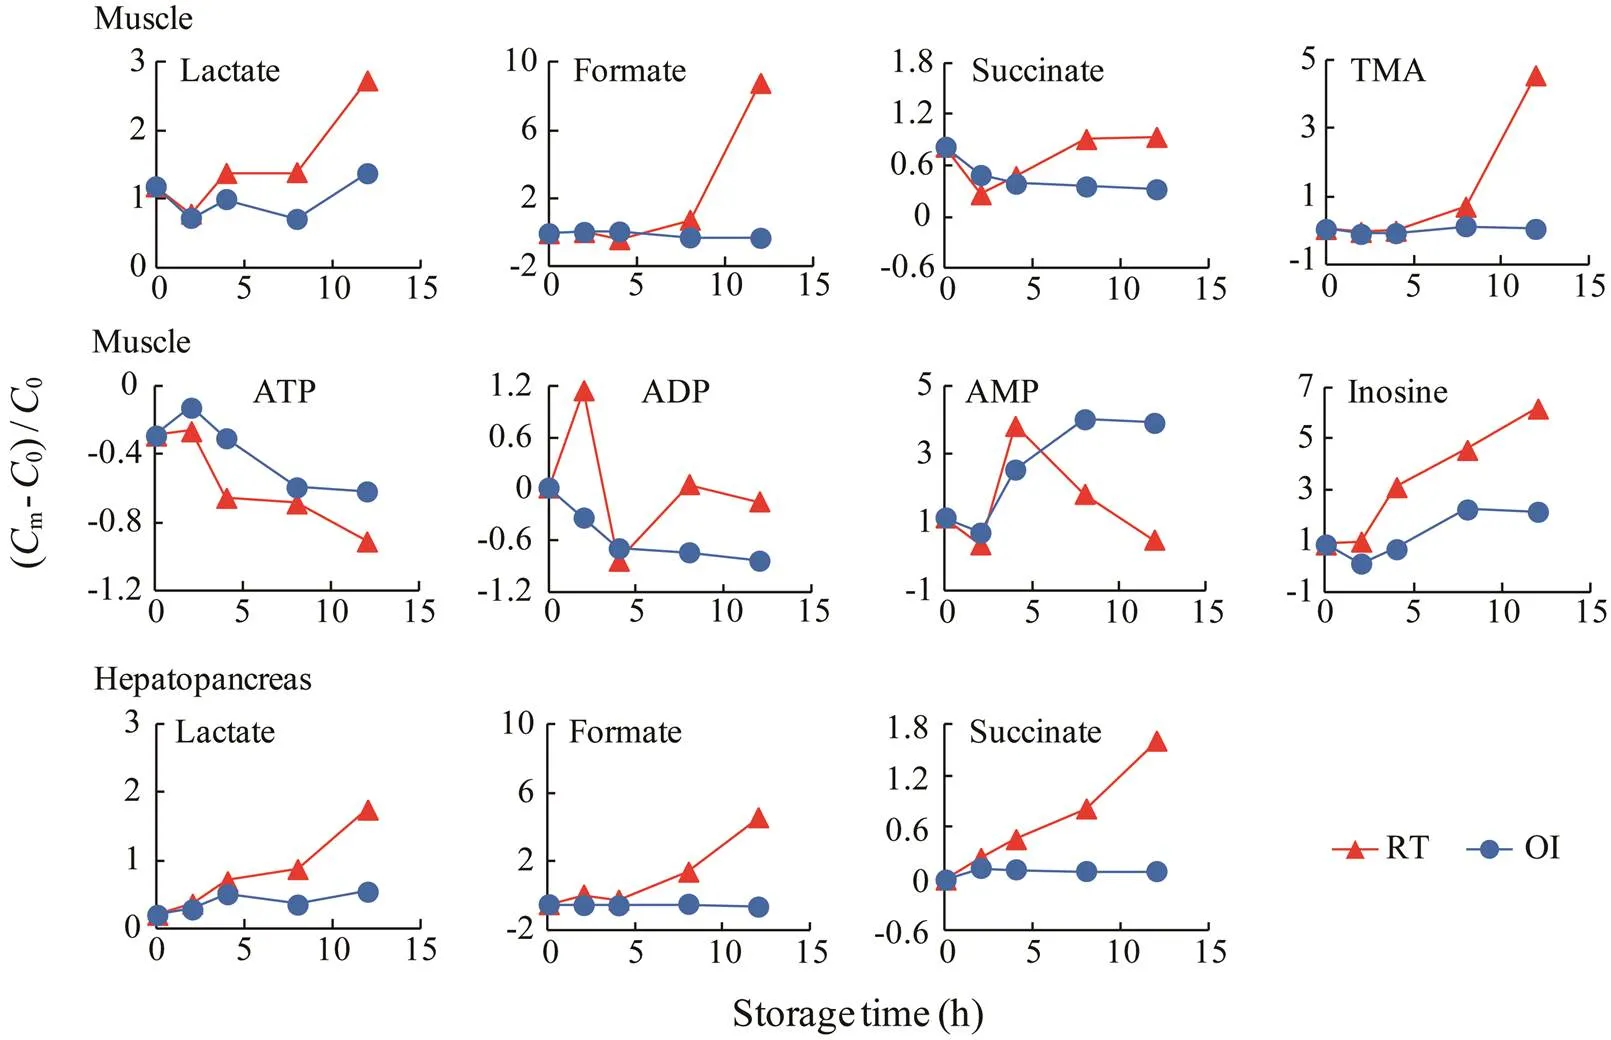
Fig.5 Ratios of changes for the metabolites in the tissues of dead crabs compared with live control crabs. Cm, concentra- tion of metabolite from dead crabs; C0, concentration of metabolite from live control crabs. RT, dead crabs kept at room temperature; OI, dead crabs kept on ice.
Furthermore, instead of storage on ice, storage of dead crabs at −20℃ also mitigated the changes in metabolites (Fig.6). For instance, the levels of muscle succinate, formate, and lactate were increased by 0.8, 2, or 3 folds relative to live control levels.Less change in the level of these two organic acids was observed in the hepatopancreas du- ring 16d of storage. Moreover, it is important to note that the increase in the muscle TMA level was below 30% du- ring 16d of storage at −20℃, with an exemption of a 76.1% increase at the last day of storage. In addition, a similar change in the level of ATP, ADP, AMP, and inosine was observed in the muscle of dead crabs at −20℃ compared with those stored on ice. When we kept the anesthetized live crabs at −20℃, the highest increase in the levels of lactate and formate in the two tissues was about two folds or less relative to live control levels during 16d of storage (Fig.6). Moreover, the increase in the TMA level was be- low 70%; an overall decline in the levels of ATP and ADP as well as an overall elevation in the levels of AMP and inosine were observed in the muscle of live crabs during 16d of storage at −20℃. In addition, we also observed that other metabolites including certain amino acids, taurine, fumarate, histamine, betaine, and sarcosine in the muscle and/or hepatopancreas presented changes below 30% rela- tive to those of live control crabs under four storage con- ditions (data not shown).

Fig.6 Ratios of changes of the metabolites in the tissues of dead crabs compared with live control crabs. Cm, concentration of metabolite from dead crabs; C0, concentration of metabolite from live control crabs. DMT, dead crabs kept at −20℃; LMT, live crabs kept−20℃.
4 Discussion
Freshness is the key determinant to decide whether mud crab is edible or not. A body of evidence reveals that TMA is an important indicator of spoilage of aquatic products such as fish (Zhao., 2002; Kyrana and Lougovois, 2010; Heising., 2014), shrimp (Boziaris., 2011), and crab (Chen., 2016). This volatile base is largely responsible for a pungent odor and unpalatable taste (van Waarde, 1988). Importantly, TMA can lead to acute poi- soning after consumption of the flesh of Greenland shark () (Anthoni., 1991) and causes a teratogenic toxicity in mice (Guest and Varma, 1991). Imperatively, the rapid elevated TMA in the dead crab muscle from 8 hour postmortem at roomtemperature strongly indicates a big loss of freshness of mud crab. Although no legislation limit regarding TMA has been set for crustaceans, the rejection limit in fish is usually 5–10mg per 100g muscle (Marrakchi., 1990). According to the known concentration of a reference compound (TSP in this study), the semi-quantitative concentration of TMA in the muscle of RT12 crabs was (15.7±3.6)mg per 100g muscle. Although this value is lower than those of whole blue crab (Parlapani., 2019) and processed crab meat () (Anacleto., 2011), it exceeds the re- jection limit, suggesting that crab stored at room tem- perature exhibits an unacceptable quality at 12h postmor- tem. TMA concentrations in the other crab groups were below the rejection limit, suggesting an edible quality. Ge- nerally, TMA is produced from TMAO by bacteria or en- zymes in dead marine animals (Gram and Dalgaard, 2002). Our observation of the concomitantly decreased level of TMAO supports the activity of this metabolic pathway in the dead crab muscle at RT. Furthermore, TMA produc- tion has been used as an indicator of bacterial activity in crustaceans (Anacleto., 2011; Boziaris., 2011). Spoilage bacteria, such asandwhich are capable of producing TMA and other TVB-N, have been found in blue crab (Parlapani., 2019). Gi- ven this information, bacteria may play an important role in TMA production in this study. Another evidence to sup- port the role of bacteria growth in this study is the accu- mulated lactate, formate, and succinate in the crab tissues. This is because these organic acids are usually produced by bacterial mix acid fermentation. Moreover, some spe- cies from Leptotrichiaceae and, which can produce a range of organic acids, have been found in the midgut of mud crab (Zhang., 2020). Taken together, we speculate that bacteria grew rapidly in the crab tissues from 8h postmortem at room temperature. As organic acids have been regarded as products of fish spoilage (Xu and Yang, 2010), the increased level of TMA and organic acids both indicate the serious spoilage of dead crabfrom 8 hours postmortem, which is unaccept- able for human consumption.
K value is another broadly adopted freshness indicator of aquatic product which can be calculated as ratio of non- phosphorylated ATP breakdown products (inosine and hy- poxanthine) to total concentration of ATP and its breakdown products (Ocaño-Higuera., 2011). In this study, only muscle ATP, ADP, AMP, and inosine can be detect- ed by NMR method. The possible reason thatinosine 5’- monophosphate and hypoxanthine were not detected is that the levels of these two metabolites were below the detection limit of NMR analytical method. Although the precise K value cannot be obtained based on the NMR results, a 90% decrease of ATP, 14.9% decrease of ADP, 50.7% increase of AMP, and 618.1% increase of inosine at 12h postmortem strongly indicate an increased K value of dead mud crab at room temperature. On the other hand, inosine and hypoxanthine have been used as freshness indicators in the cold storage fish (Ocaño-Higuera., 2011). This is because inosine and hypoxanthine have a bitter taste (Schilichtherle-Cerny and Grosch, 1998). In con-trast, AMP has a bouillon-like taste. Therefore, the decreased AMP level from 4h postmortem and increased inosine level indicate a deteriorated flavor of mud crab at room temperature. In addition, inosine production is also related to both autolytic deterioration and bacterial spoilage (Oca- ño-Higuera., 2011), which further supports the bacterial growth in dead mud crab at room temperature. Based on the above metabolite indices, we speculate that dead mud crab preserved an edible quality at RT for at least 4h.
Previous study reported that TMA production is a tem- perature-dependent process (Shumilina., 2015). In this study, the decreased storage temperature on ice reduced the TMA production during 12h of storage. However, sto- rage at −20℃ can effectively inhibit its production until 16d in both dead and live mud crabs. In this case, tem- perature seems to play a crucial role in TMA production. A low storage temperature (4℃) is also a key factor that determines the substantial elevation in TMA until day se- ven of the fermentation of crab paste (Chen., 2016). The low TMA production may be due to the inhibition of microbial growth. This is because the level of organic acids including lactate, formate, and succinate in the mud crab stored on ice were lower than those stored at room tem- perature. Storage at −20℃ resulted in a similar inhibitory effect on the production of organic acids as storage on ice during 16d. On the other hand, storage OI also resulted in an inhibitory effect on ATP degradation. Furthermore, AMPdegradation and inosine formation were simultaneously re-tarded. A similar effect on ATP degradation occurred in the muscle of live and dead crab at −20℃. However, the rate of ATP degradation was slower in live crab than those in dead crab, causing a more bouillon-like taste and less bitter taste in live crab than in dead crab during 16d of storage. Based on these metabolite indices, we speculate that dead mud crab preserved an edible quality for at least 12h on ice and at least 16d at −20℃.
In addition, we also noted some changes in levels of other metabolites (such as amino acids, betaine, and taurine) in the edible tissues of mud crab associated with different storage methods. These metabolites are important nutri- ents for humans and probably present an attractive flavor. For instance, free amino acids usually contribute an uma- mi, sweet, or sour taste (Park., 2002), whereas be- taine contributes a sweet taste. However, only less than 30% change occurred in most of these metabolites, indicating a weak contribution to quality. Furthermore, histamine is frequently involved in fish poisoning (Kanki., 2004; Mercogliano and Santonicola, 2019). However, less than 32% increase of histamine occurred in the muscle and he- patopancreas of dead mud crab kept at room temperature, indicating a minor contribution to inedibility.
5 Conclusions
The postmortem metabolite changes in the muscle and hepatopancreas of mud crab indicate that freshness can be controlled by appropriate storage methods. NMR-based me- tabolomics approach coupled with multivariate data ana- lysis is a powerful tool for assessing the quality of mud crab. Since TMA, organic acids, ATP, and its breakdown products are closely related to storage time, these metabo- lites can be jointly used as good indicators for freshness of crab edible tissues under different storage conditions. Our results show that dead mud crab preserves an edible quality at least for 4h at room temperature, 12h on ice, and 16 days at −20℃. Thus, the dead crabs should not always be discarded without considering the freshness, which are still edible if be stored in a correct manner.
Acknowledgements
Financial support from the 2025 Technological Innova- tion for Ningbo (No. 2019B10010), China Agriculture Re-search System-CARS48 and K. C. Wong Magna Fund in Ningbo University, and the Special research funding from the Marine Biotechnology and Marine Engineering Dis- cipline Group in Ningbo University (No. 422004582) are greatly acknowledged.
Anacleto, P., Teixeira, B., Marques, P., Pedro, S., Nunes, M. L., and Marques, A., 2011. Shelf-life of cooked edible crab () stored under refrigerated conditions., 44: 1376-1382.
Anthoni, U., Christophersen, C., Gram, L., Nielsen, N. H., and Nielsen, P., 1991. Poisonings from flesh of the Greenland shark Somniosus microcephalus may be due to trimethylamine., 29 (10): 1205-1212.
Aue, W. P., Bartholdi, E., and Ernst, R. R., 1976a. Two-dimen- sional spectroscopy. Application to nuclear magnetic-reso- nance., 64: 2229-2246.
Aue, W. P., Karhan, J., and Ernst, R. R., 1976b. Homonuclearbroad-band decoupling and two-dimensional-resolved NMR-spectroscopy., 64: 4226- 4227.
Berg, R. A. V. D., Hoefsloot, H. C., Westerhuis, J. A., Smilde, A, K., andWerf, M. J. A. D., 2006. Centering, scaling, and trans- formations: Improving the biological information content of metabolomics data., 7: 142-156.
Boziaris, I. S., Kordila, A., and Neofitou, C., 2011. Microbial spoi- lage analysis and its effect on chemical changes and shelf-life of Norway lobster () stored in air at va- rious temperatures., 46 (4): 887-895.
Braunschweiler, L., and Ernst, R. R., 1983. Coherence transfer by isotropic mixing, application to proton correlation spectroscopy., 53: 521-528.
Cappello, T., Giannetto, A., Parrino, V., Marco, G. D., Mauceri, A., and Maisano, M., 2018. Food safety using NMR-based me- tabolomics: Assessment of the Atlantic blue fin tuna,, from the Mediterranean Sea., 115: 391-397.
Chen, D., Ye, Y., Chen, J., and Yan, X., 2016. Evolution of metabolomics profiles of crab paste during fermentation., 192: 886-892.
Chen, D., Ye, Y., Chen, J., Zhan, P., and Lou, Y., 2017. Molecular nutritional characteristics of vinasse pike eel () during pickling., 224: 359-364.
Cloarec, O., Dumas, M. E., Trygg, J., Craig, A., Barton, R. H., Lindon, J. C.,Nicholson, J. K., and Holmes, E., 2005. Eva- luation of the orthogonal projection on latent structure model limitations caused by chemical shift variability and improved visualization of biomarker changes in1H NMR spectroscopic metabonomic studies., 77: 517-526.
Eriksson, L., Trygg, J., and Wold, S., 2008. CV-ANOVA for sig- nificance testing of PLS and OPLS (R) models., 22: 594-600.
Fan, W. M., and Lane, A. N., 2008. Structure-based profiling of metabolites and isotopomers by NMR., 52 (2-3): 69-117.
Gallo, M., and Ferranti, P., 2016. The evolution of analytical che- mistry methods in foodomics., 1428: 3-15.
Gram, L., and Dalgaard, P., 2002. Fish spoilage bacteria pro- blems and solutions., 13 (3): 262-266.
Guest, I., and Varma, D. R., 1991. Developmental toxicity of me- thylamines in mice.Journal of Toxicology and Environmental, 32: 319-330.
Harnly, J. M., Bergana, M. M., Adams, K. M., and Moore, J. C., 2018. Variance of commercial powdered milks analyzed by1H-NMR and impact on detection of adulterants., 66: 8478-8488.
Heising, J. K., Boekel, M. A. J. S., and Dekker, M., 2014. Ma- thematical models for the trimethylamine (TMA) formation on packed cod fish fillets at different temperature., 56: 272-278.
Kanki, M., Yoda, T., Ishibashi, M., and Tsukamoto, T., 2004. Pho- tobacterium phosphoreum caused a histamine fish poisoning incident., 92 (1): 79-87.
Kyrana, V. R., and Lougovois, V. P., 2010. Sensory, chemical and microbiological assessment of farm-raised European sea bass () stored in melting ice., 37 (3): 319-328.
Li, Q., Yu, Z., Zhu, D., Meng, X., Pang, X., Liu, Y., Frew, R., Chen, H., and Chen, G., 2016. The application of NMR-based milk metabolite analysis in milk authenticity identification., 97 (9): 2875-2882.
Li, Y., Li, R., Ye, Y., Mu, C., and Wang, C., 2019.1H NMR me- tabolic profiling revealed characteristic metabolites in mud crabfor different geographical origins., 47 (1): 314-321.
Marrakchi, A. E., Bennour, M., Bouchriti, N., Hamama, A., and Tagafait, H., 1990. Sensory, chemical, and microbiological as- sessments of moroccan sardines () stored in ice., 53 (7): 600-605.
Mercogliano, R., and Santonicola, S., 2019.Scombroid fish poi- soning: Factors influencing the production of histamine in tuna supply chain. A review.-, 114: 108374.
Ocaño-Higuera, V. M., Maeda-Martínez, A. N., Marquez-Ríos, E.,Canizales-Rodríguez, D. F., Castillo-Yáñez, F. J., Ruíz- Bustos, E., Graciano-Verdugo, A. Z., and Plascencia-Jatomea, M., 2011. Freshness assessment of ray fish stored in ice by biochemical, chemical and physical methods., 125 (1): 49-54.
Park, J. N., Watanabe, T., Endoh, K. I., Watanabe, K., and Abe, H., 2002. Taste-active components in a Vietnamese fish sauce., 68 (4): 913-920.
Parlapani, F. F., Michailidou, S., Anagnostopoulos, D. A., Koro- milas, S., Kios, K., Pasentsis, K., Psomopoulos, F., Argiriou, A., Haroutounian, S. A., and Boziaris, I. S., 2019. Bacterial communities and potential spoilage markers of whole blue crab () stored under commercial simulated con- ditions., 82: 325-333.
Petrakis, E. A., Cagliani, L. R., Tarantilis, P. A., Polissioua, M. G.,and Consonnib, R., 2016. Sudan dyes in adulterated saffron (): Identification and quantification by1H NMR., 217: 418-424.
Schilichtherle-Cerny, H., and Grosch, W., 1998. Evaluation of taste compounds of stewed beef juice.-, 207 (5): 369-376.
Shumilina, E., Ciampa, A., Capozzi, F., Rustad, T., and Dikiy, A., 2015. NMR approach for monitoring post-mortem changes in Atlantic salmon fillets stored at 0 and 4℃.,184: 12-22.
Trygg, J., and Wold, S., 2002. Orthogonal projections to latent structures (O-PLS)., 16: 119-128.
Trygg, J., Holmes, E., and Lundstedt, T., 2007. Chemometrics in metabonomics., 6 (2): 469-479.
van Waarde, A., 1988. Biochemistry of non-protein nitrogenous compounds in fish including the use of amino acids for anaerobic energy production., 91 (2): 207-228.
Wang, Y., Shi, Z., Wang, X.,Zhao, L., and Li, F., 2018. The qua- lity evaluation of alive and dead Chinese mitten crab ()., 18 (03): 244-254.
Wishart, D. S., 2008. Metabolomics: Applications to food science and nutrition research., 19 (9): 482-493.
Xiao, C., Dai, H., Liu, H., Wang, Y., and Tang, H., 2008. Reveal- ing the metabonomic variation of rosemary extracts using1H NMR spectroscopy and multivariate data analysis., 56: 10142-10153.
Xu, Z., and Yang, X., 2010. Research advances of spoilage abi- lity of fish spoilage organisms., 19: 130-133.
Yang, X., Zhang, J., and Cheng, Y., 2016. The evaluation of the three edible tissues of dead adult Chinese mitten crabs () freshness in harvest season, based on the ana- lysis of TVBN and biogenic amine., 5 (1): 1906.
Ye, H., Tao, Y., Wang, G., Lin, Q., Chen, X., and Li, S., 2011. Ex- perimental nursery culture of the mud crab(Estampador) in China., 19 (2): 313-321.
Zhang, X., Zhang, M., Zheng, H., Ye, H., Zhang, X., and Li, S., 2020. Source of hemolymph microbiota and their roles in the immune system of mud crab., 102: 103470.
Zhao, C., Pan, Y., Ma, L., Tang, Z., Zhao, G., and Wang, L., 2002. Assay of fish freshness using trimethylamine vapor probe based on a sensitive membrane on piezoelectric quartz crystal., 81 (2-3): 218-222.
Zhu, P., Du, J., Xu, B., and Lu, M., 2017. Modified unsupervised discriminant projection with an electronic nose for the rapid determination of Chinese mitten crab freshness., 9 (11): 1806-1815.
April 11, 2020;
June 15, 2020;
November 2, 2020
© Ocean University of China, Science Press and Springer-Verlag GmbH Germany 2021
E-mail: yeyangfang@nbu.edu.cn E-mail: wangchunlin@nbu.edu.cn
(Edited by Qiu Yantao)
杂志排行

Journal of Ocean University of China的其它文章
- Case Study of a Short-Term Wave Energy Forecasting Scheme:North Indian Ocean
- Temporal and Spatial Characteristics of Wave Energy Resources in Sri Lankan Waters over the Past 30 Years
- Vibration Deformation Monitoring of Offshore Wind Turbines Based on GBIR
- Dependence of Estimating Whitecap Coverage on Currents and Swells
- The Variation of Microbial (Methanotroph) Communities in Marine Sediments Due to Aerobic Oxidation of Hydrocarbons
- 3-Aminopropyltriethoxysilane Complexation with Iron Ion Modified Anode in Marine Sediment Microbial Fuel Cells with Enhanced Electrochemical Performance