Vibration Deformation Monitoring of Offshore Wind Turbines Based on GBIR
2021-06-25MADemingLIYongshengLIUYanxiongCAIJianweiandZHAORui
MA Deming, LI Yongsheng, LIU Yanxiong, CAI Jianwei, and ZHAO Rui
Vibration Deformation Monitoring of Offshore Wind Turbines Based on GBIR
MA Deming1), 2), *, LI Yongsheng3), LIU Yanxiong1), CAI Jianwei4), and ZHAO Rui5)
1) The First Institute of Oceanography, Ministry of Natural Resources, Qingdao 266061, China 2) College of Environmental Science and Engineering, Ocean University of China, Qingdao 266100, China ) The Predecessor of the Institute of Crustal Dynamics, China Earthquake Administration, Beijing 100085, China 4) China Center for Resource Satellite Data and Applications, Beijing 100094, China 5) State Nuclear Electric Power Planning Design and Research Institute Company Limited, Beijing 100094, China
In view of the disadvantages of vibration safety monitoring technology for offshore wind turbines, a new method is proposed to obtain deformation information of towering and dynamic targets in real-time by the ground-based interferometric radar (GBIR). First, the working principle and unique advantages of the GBIR system are introduced. Second, the offshore wind turbines in Rongcheng, Shandong Province are selected as the monitoring objects for vibration safety monitoring, and the GPRI-II portable radar interferometer is used for the health diagnosis of these wind turbines. Finally, the interpretation method and key processing flow of data acquisition are described in detail. This experiment shows that the GBIR system can accurately identify the millimeter-scale vibration deformation of offshore wind turbines and can quickly obtain overall time series deformation images of the target bodies, which demonstrate the high-precision deformation monitoring ability of the GBIR technology. The accuracy meets the requirements of wind turbine vibration monitoring, and the method is an effective spatial deformation monitoring means for high-rise and dynamic targets. This study is beneficial for the further enrichment and improvement of the technical system of wind turbine vibration safety monitoring in China. It also provides data and technical support for offshore power engineering management and control, health diagnosis, and disaster prevention and mitigation.
wind turbine vibration;deformation monitoring; GBIR; key technology; technology support
1 Introduction
According to statistical data on global offshore wind power, wind power generation is second only to hydropower generation, accounting for 16% of the global renewable energy generation (Peng, 2019), and has become one of the most important new energy sources indispensable in today’s era (Wang, 2009; Mário, 2018). Compared with onshore wind farms, offshore wind power has developed rapidly worldwide because of the advantages of stable wind resources, environmental protection, land savings, large scale, and high power offshore wind power has also received increasing attention in developed countries (Wu, 2019), thereby becoming a major development direction in many countries (Chen and Wang, 2014). Although China’s offshore wind power industry started relatively late, it has developed rapidly. By the end of 2017, the installed capacity of China ranked third in the world. With the support of China’s ‘national marine development strategy’ and ‘the Belt and Road Initiative’,international cooperation in offshore wind power construction can also usher a new stage of vigorous development. However, due to the influence of the complex marine environment, accidents such as wind turbine tilting and fracturing occur occasionally, which seriously affect and threaten the safety and durability of offshore wind power installations. Therefore, increasing attention has been givento the safe and stable operation of wind turbines. The moni-toring and quantitative evaluation of the wind turbine vibration deformation status and the realization of early fault warnings are key and difficult aspects of offshore wind power safety detection.
Structural displacement or vibration response monitoring is one of the most important objectives of structural safety monitoring. It is especially important in the case of offshore wind infrastructures, where displacement-inducing factors must be evaluated, including self-load, wind load, storm tides, and tsunami events (Xu and Xia, 2011). Various deformation monitoring methods exist at present. Monitoring methods can be classified into two groups: 1) contact sensor methods (Wong, 2004; Ko and Ni, 2005; Qin, 2017; Zhang, 2018), such as tiltmeters, accelerometers, fiber optic sensors, and global navigation satellite system (GNSS) receivers and 2) non-contact meas- urement methods (Jáuregui, 2003; Pieraccini, 2006; Psimoulis and Stiros, 2007; Zogg and Ingensand, 2008; Werner, 2012; Sousa and Bastos, 2013; La- zecky, 2016; Zhang, 2016) (, close range terrestrialphotogrammetry,terrestriallaserscanning,space- borne interferometric synthetic aperture radar [InSAR], and ground-based interferometric radar [GBIR]).
The sensor-based network approach is the most commonly applied method in onshore wind turbine structure displacement monitoring. However, these methods have a certain drawback, that is, they all gather only a limited number of data points due to cost and operational issues. Over the past two decades, InSAR has been widely applied in monitoring ground surface motions under nearly all weather conditions, often with a high spatial resolution and measurement accuracy (at the millimeter level) (Ferretti, 2000; Hooper, 2007; Zhang, 2011). The technique has also drawn attention with regard to the long-term instability monitoring of urban structures. InSAR is suitable for the identification of hidden danger points and the investigation of dangerous situations across a wide range of geological disasters. However, it is limited by fixed revisit period, long temporal baseline, and the timeliness of wind turbine vibration and deformation monitoring.
GBIR is an innovative radar-based remote sensing technique to monitor millimeter-scale or even submillimeter-scale surface changes (Zhang, 2018), with an outstanding real-time, dynamic, all weather, sampling frequency, high measurement accuracy, and excellent spatial resolution (Monserrat, 2014; Ma, 2018). Since a pioneering test was first conducted on concrete girders by Tarchi(1997), GBIR has been successfully applied to monitor the deformation of various objects, including landslides, glaciers, snowpacks, volcanoes, sinkholes, open-pit mines, and human-made structures (Antonello, 2004; Casagli, 2009; Pieraccini, 2013; Severin, 2014; Caduff, 2015; Intrieri, 2015; Voytenko, 2015). In these applications, the usefulness and tremendous potential of this promising deformation monitoring technique have been clearly revealed. Therefore, it can effectively solve the above problems and open a new way for the real-time dynamic monitoring process of fan vibration and deformation.
2 Materials and Methods
2.1 Principle and Characteristics of GBIR
GBIR is a new non-contact measurement technology based on the active imaging of microwave detection. The working principle of this method is to use microwaves to scan the target area and record the backscattering signal coherently. After receiving the echo information through a series of processes, such as focusing and filtering, the radar image is obtained. From the imaginary and real parts of each complex number, the phase and amplitude information of the corresponding matrix element can be calculated. Subsequently, using the radar interferometry tech- nology, a displacement map is generated on the basis of the phase information, that is, microwave signals are trans- mitted at two different times. According to the phase shift between the echoes of the two signals, the movement of the backscattered target is deduced to accurately obtain the microscale shape variable of the monitoring object (Ma, 2018).
Compared with traditional monitoring methods, the GBIR technique has the following advantages (Leva, 2003; Tarchi, 2005; Takahashi, 2013):
1)The whole monitoring process is highly automated, without the installation of sensors or reflectors in the target monitoring area, which can realize the detection of dangerous areas.
2)The process is not limited by climate conditions and can achieve real-time deformation monitoring under daily weather conditions.
3)The accuracy of the radar line of sight direction can reach 0.1mm, and the measurement distance can reach several thousand meters. With this approach, the area of several thousand square kilometers covered by the beam can be monitored.
4)The monitoring range of the deformation rate is large, ranging from a few millimeters a year to one meter per hour.
5) The data acquisition time is short, thus providing a continuous deformation monitoring map of the whole measured area in time and space, which can improve the generated continuous motion image of the scanned area. Moreover, the monitoring range can reach hundreds of thousands of square meters at a time.
6)Through the application of wireless control and continuous remote processing, monitoring and deformation monitoring can be realized.
2.2 Study Area
In April 1986, China’s first wind farm was built in Malan Bay, Rongcheng, Shandong Province, and grid-connected wind power technology was tested and demonstrated. In recent years, Rongcheng, Shandong Province has increased its energy conservation and emission reduction efforts, vigorously promoted the wind power industry known as green energy, and built a number of large wind farms in the coastal wind rich belt. The offshore wind turbines selected in this study are located at the east of Wangjia Village in Rongcheng, Weihai City, with Hutoujiao in the south, the Yellow Sea in the east, the Naxiang- hai International Tourist Resort and Jiming Island in the north. The area has a temperate monsoon climate, with four distinct seasons, and has an abundant rainfall, moderate annual temperature, strong winds, and high humidity. The tide is a typical semidiurnal tide with an average tidal range of 2.11m and a maximum tidal range of 6.87m (Ma, 2010).
2.3 Data Acquisition
Aiming at the potential safety risks caused by the vibration of the Rongcheng offshore wind turbine, a portable GBIR system (GPRI-II) produced by the Swiss Gam- ma Company was adopted to conduct real-time monitoring of wind turbine vibration on September 10, 2018.Through multiple transmitting and receiving Ku band electromagnetic waves, the phase change in each reflected signal is analyzed to monitor the target change at a millimeter level accuracy. The GPRI-II FMCW radar interferometer with a rotating scanner is composed of one transmitting antenna and two receiving antennas. It can realize 360-degree observation, small-angle scanning, and static scanning without rotation. The measurement distance can reach 10km.
To simplify the installation as much as possible, considering the site conditions and operation requirements, the location should afford a wide field of vision to facilitate the data acquisition of the equipment. The equipment is installed on a tripod, and the site layout of the equipment is shown in Fig.1. Four offshore wind turbines (FT1, FT2, FT3, and FT4) are selected for the monitoring experiment, and the monitoring distance ranges from 0.05–1.50km. The distances from the monitoring equipment are 60, 460, 890, and 1350m (as illustrated in Fig.2). Three fans operate normally, whereas the other fan is static. The safety and health diagnosis of fan vibration under different distances and working conditions is performed. With the GBIR high-precision deformation monitoring capability, the range resolution is 0.75m, and the azimuth resolution is 6.8m per km. Table 1 presents detailed parameter settings.
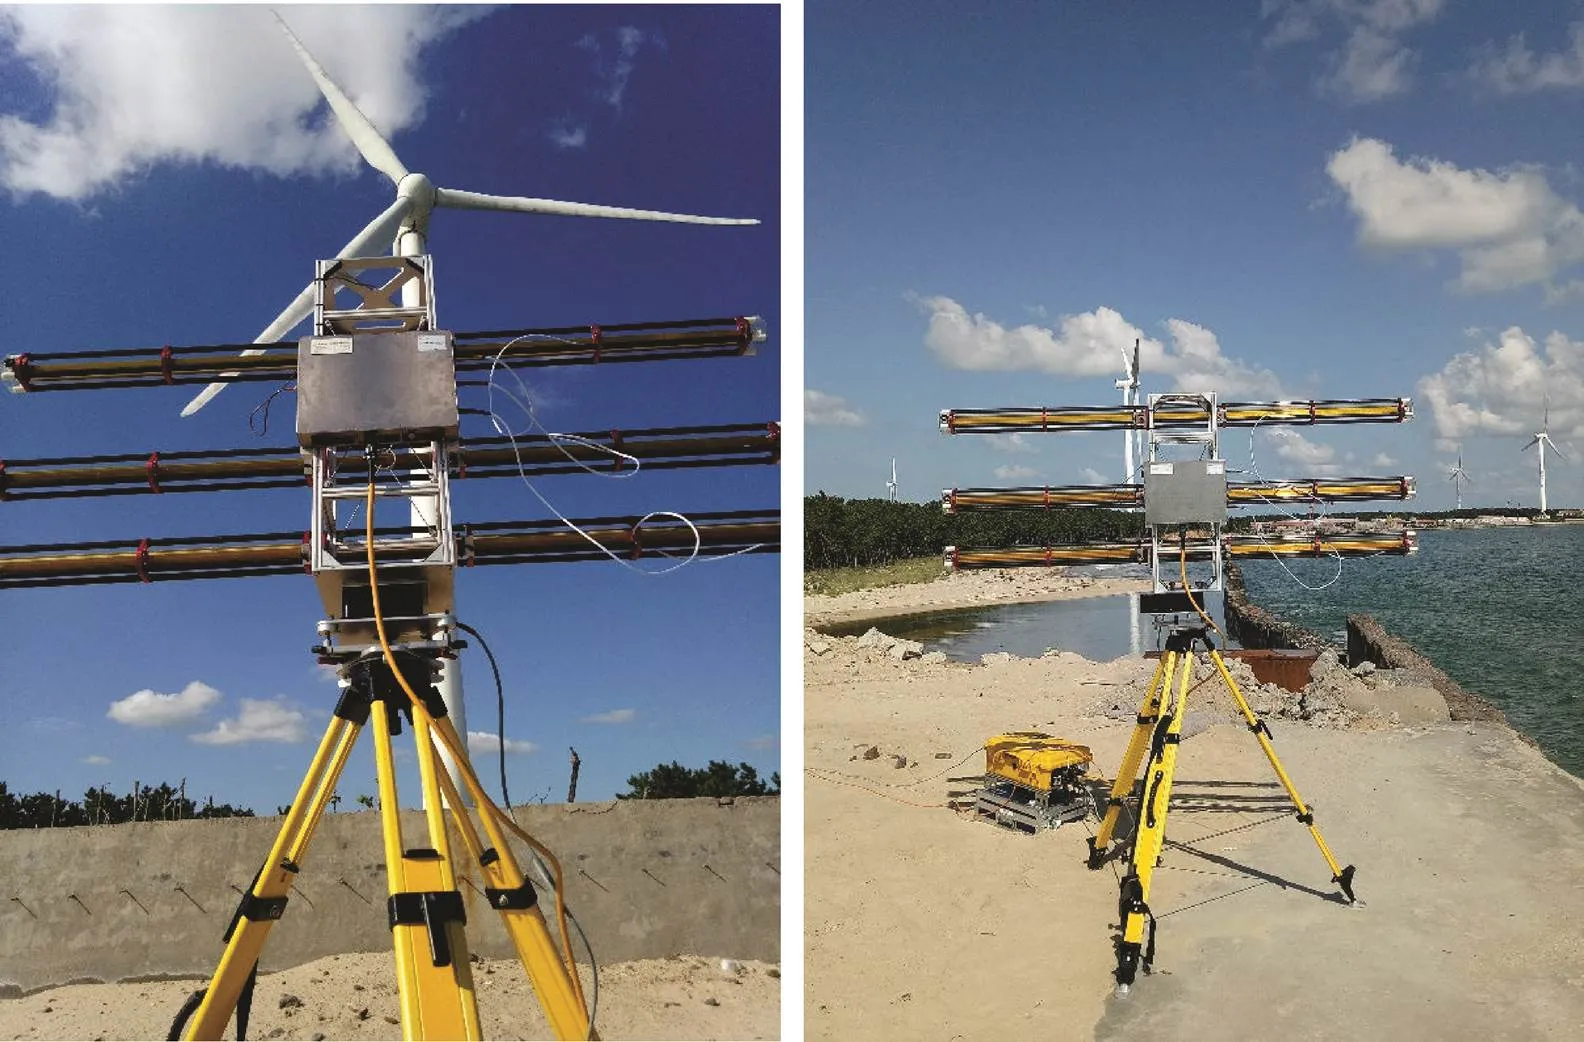
Fig.1 Equipment installation and data acquisition.
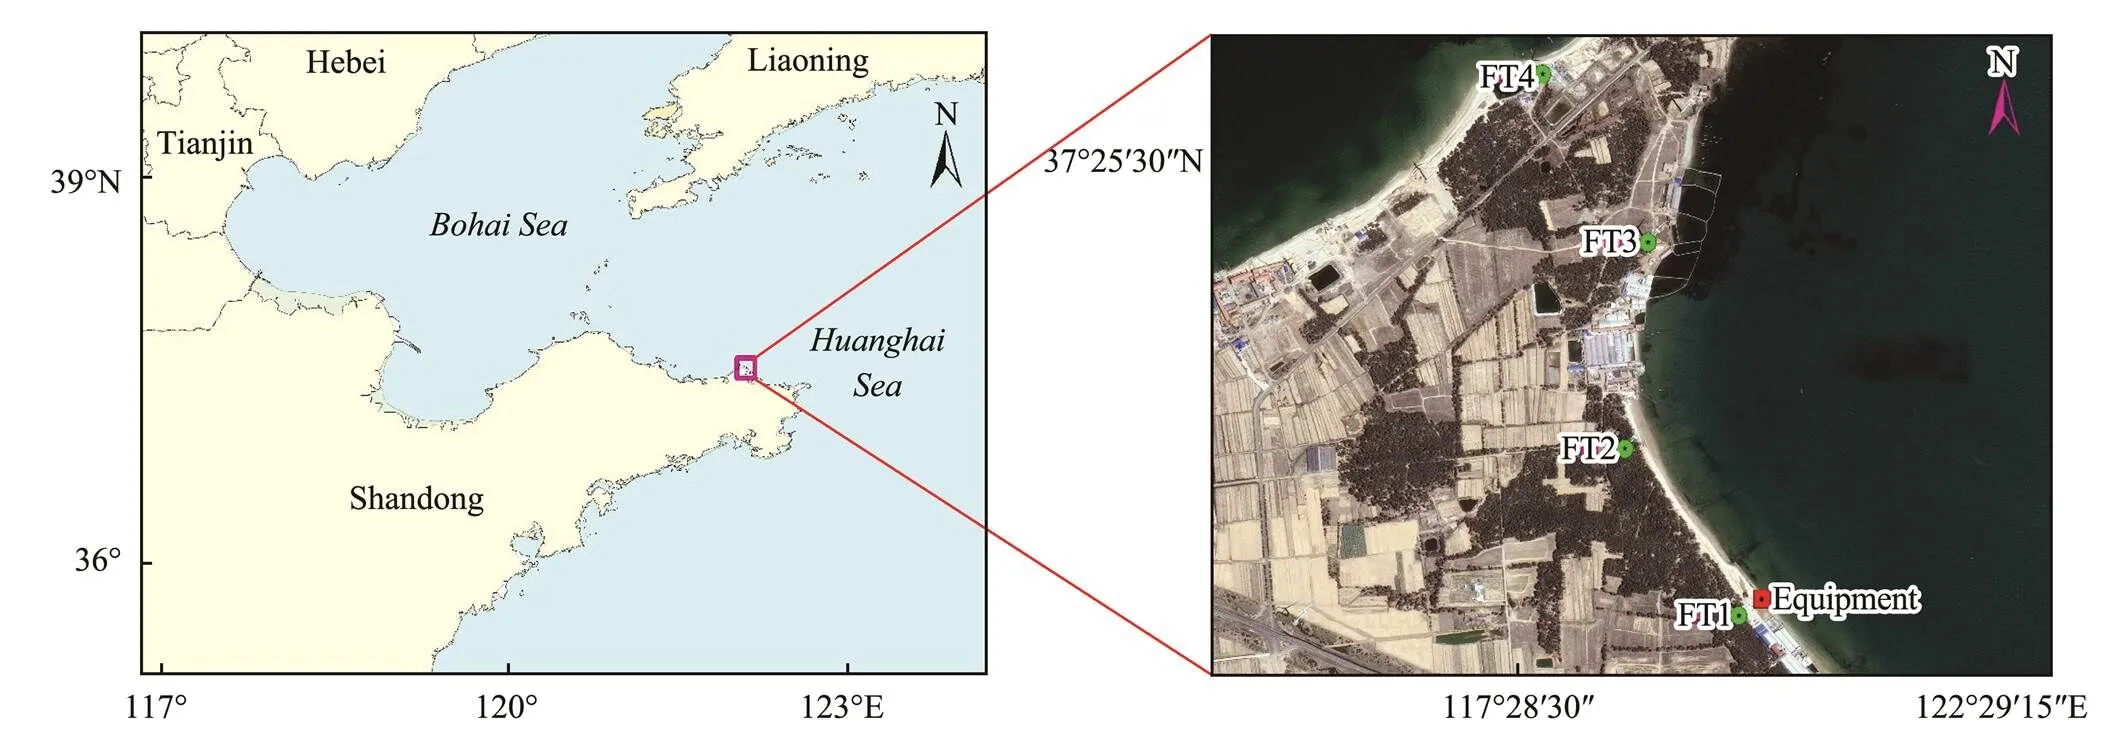
Fig.2 Wind turbines and GPRI-II equipment locations.
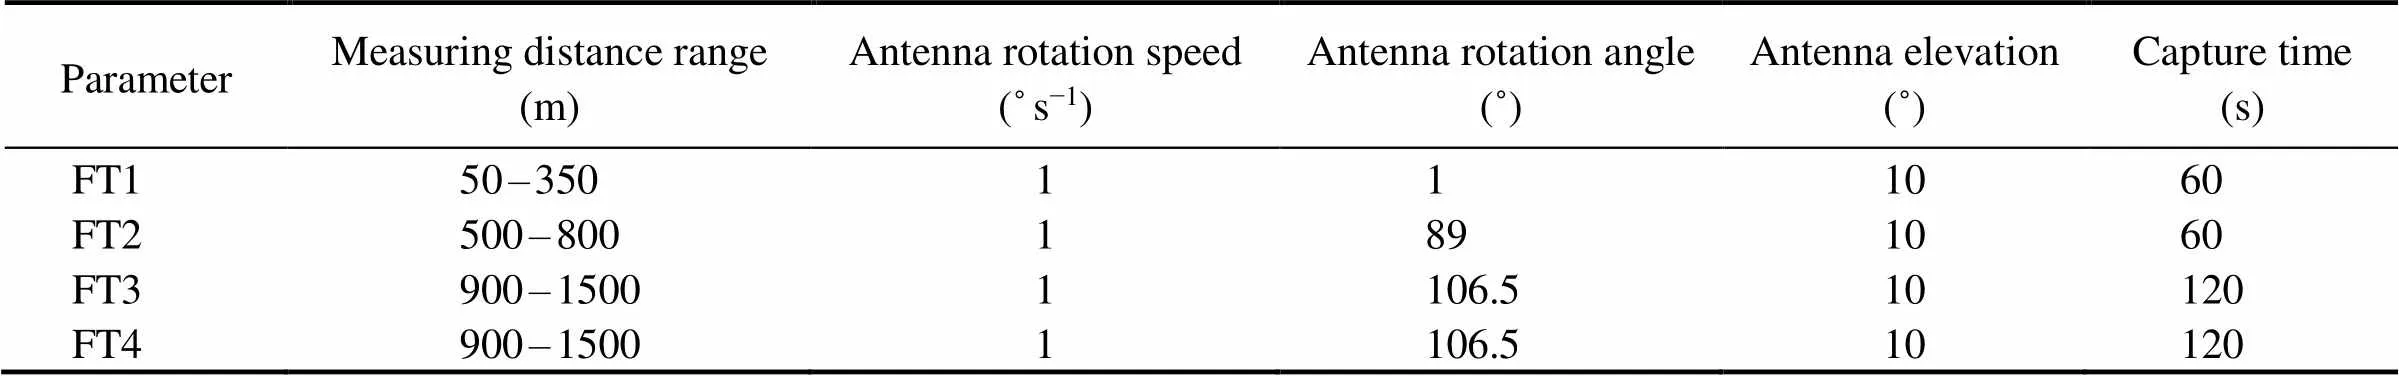
Table 1 Data acquisition parameters
2.4 Data Analysis and Interpretation
The interference phase of ground-based radar can be divided into four parts, namely, the atmospheric phase caused by the tropospheric delay, the baseline phase caused by equipment center deviation, the deformation phase, and the noise phase:

whereint,grdis the interference phase,def,grdis the deformation phase,bl,grdis the baseline phase,atm,grdis the atmospheric phase,ns,grdis the noise phase, andis the phase ambiguity (, an integer number of the full phase cycles).
The atmospheric ground-based radar interference phaseatm,grdcontains the tropospheric delay phase (mainly due to the influence of the water vapor partial pressure). In the continuous observation mode, the baseline phasebl,grdis not considered, and the influence of this error on the deformation results is neglected, whereas the noise phasens,grdis weakened by filtering. Therefore, after removing the atmospheric, baseline, and noise phases, the residual interference phase is the final deformation phase (Ma, 2020). The GBIR data processing flow is shown in Fig.3, which can be divided into the following five steps:
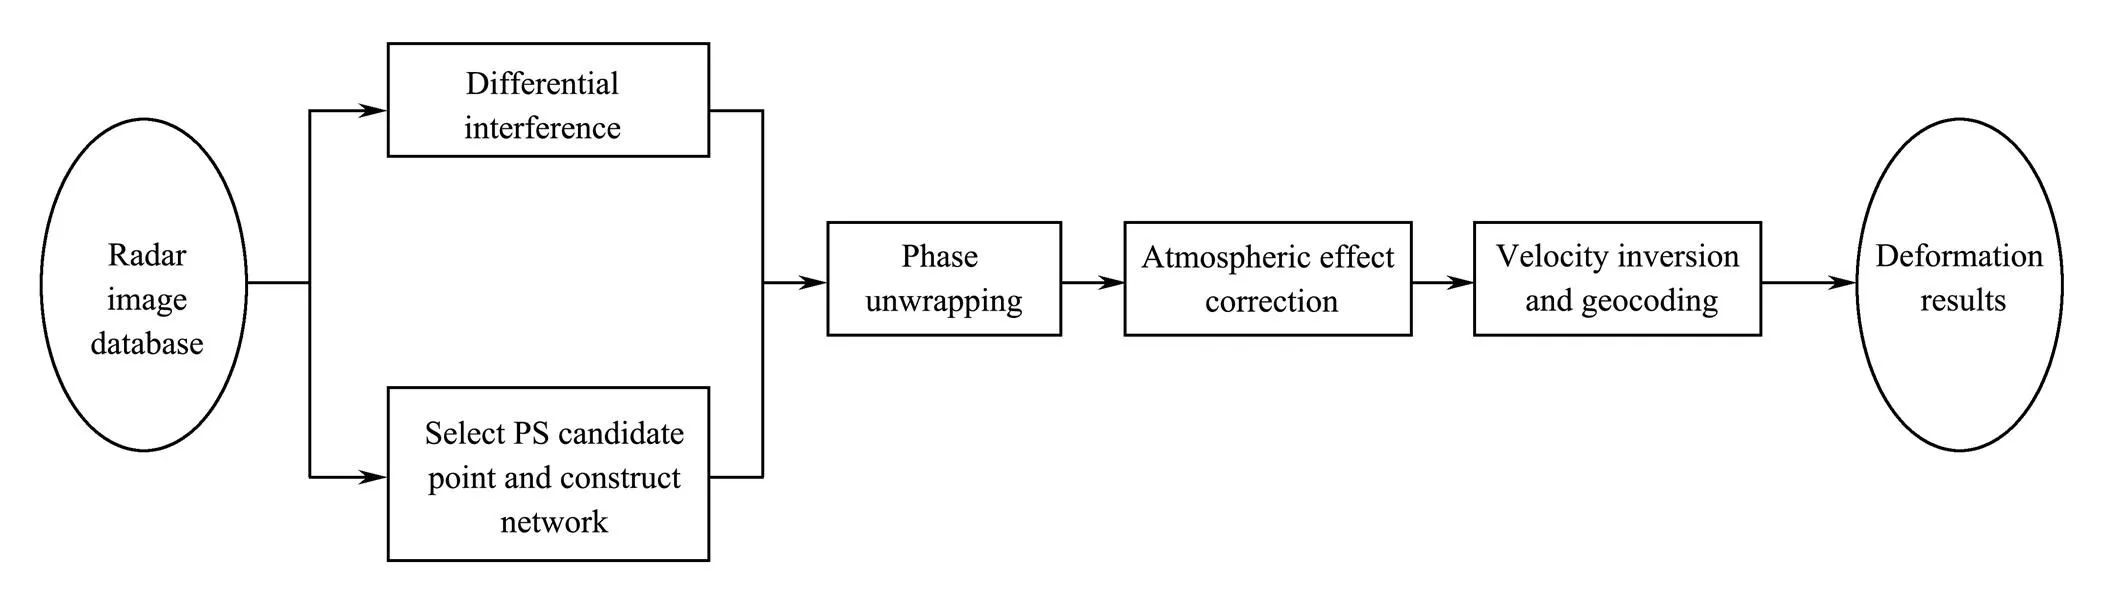
Fig.3 Data processing flow of GBIR.
1) PS point selection and network construction
Due to the high sampling frequency, large amount of data, and high signal-to-noise ratio of GBIR, the amplitude dispersion index method based on statistical characteristics is applied to select points. This method is expressed as follows:
whereβis the standard deviation of the amplitude series, andγis the average value of the amplitude sequence. When the signal-to-noise ratio of the radar signal is higher than 4, the radar amplitude tends to obey a normal distribution, and the time sequence phase standard and amplitude deviations are similar. In this case, the amplitude deviation index can be used to select the point where the vibration and phase tend to be stable at the same time (Ma, 2020).
Generally, the atmospheric components of the interference phase are considered to exhibit a spatial correlation, and the correlation is proportional to the distance. Therefore, the interference phase of adjacent PS points differs, which further suppresses the atmospheric phase. In this study, according to the Delaunay triangulation principle, the selected PS points are emplaced, and the arc segment of the various PS points is established. The arc segment stores the phase difference among the PS points at both ends, which is expressed as:
The distribution ofanddenotes the serial number of the adjacent PS points, andatm,,andnsare the differential atmospheric and noise phases of the PS points, respectively.
2) Differential interference
In the process of ground-based radar data processing, an interferogram is primarily constructed by the conjugate multiplication of two complex images as follows:
where1and2are the backward reflection signals of the same target on the master-slave image; δandμ(=1, 2) are the signal strength and phase, respectively. Superscript & denotes the complex conjugate multiplication operator, andrepresents the imaginary part of the complex number.
According to the principle of a short space-time baseline, the method of combining the interference pairs of multiple main images is usually applied to generate differential interferograms. A time sampling step of the interference pairs is added to accurately obtain deformation information further.
3) Phase unwrapping
For each pixel in the interferogram, all the phase values in the principal value range of (−π, π] must be restored to the true phase after processing. Its accuracy directly affects that of the deformation value obtained by GBIR monitoring. Phase unwrapping is a key step in GBIR deformation measurement. In this study, the coherence-based minimum cost flow unwrapping algorithm (Costantini, 1998; Li, 2016) is adopted in irregular networks. The basic idea is as follows:
①When a threshold is selected, the density of the deformation area to be monitored and the algorithm efficiency should be considered.
②The three vertices of each triangle in the triangulation correspond to the above three interference phase values, and the triangle correspondence to the residual point is calculated. The dual network of the triangulation corresponds to these residual points.
③In the dual network, positive and negative residual points occur. The radian between these positive and negative residual points corresponds to the flow, and the minimum cost flow is determined. The size and direction of the flow represent the phase step. The real phase value is obtained by integrating the flow set.
For network=(,,,,), the streamrepresents a function from arc settoof, that is, each arc (,)Îis assigned a real numberx, wherexis the flow rate of arc (,),drepresents the supply and demand of node(the residual value),cis the cost of the arc (the coherence coefficient),() is the total cost of flow,is the set of nodes, andis the traffic upper bound. Flowsatisfies the flow conservation condition expressed in Eq. (5).

The capacity conditions are as follows:
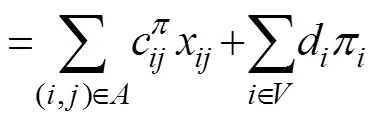
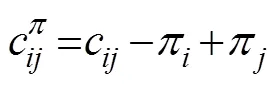
Flowis called the feasible flow. The minimum cost flow involves the determination of the feasible flow that satisfies the minimum total cost of the network, which is described as:
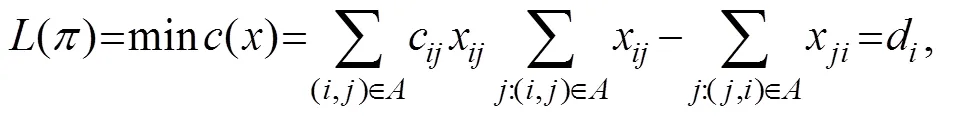
In Eq. (8), multiplierπis called the potential on node,
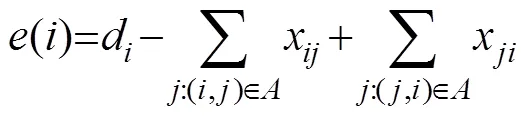
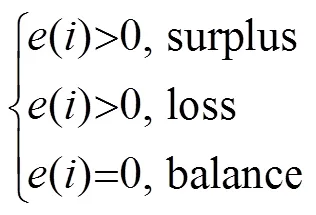
For pseudo flows that do not satisfy the above flow conservation and capacity conditions, the residual (unbalanced number) of nodeis defined as follows:
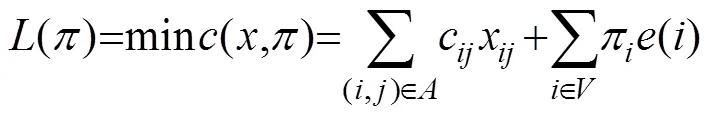
Hence,() can be equivalently written as:
4) Atmospheric effect correction
In the process of microwave propagation through atmospheric media, inhomogeneous media can disturb the propagation path, thereby changing the direction and path of signal propagation and producing an atmospheric phase screen, which is propagated in the process of interference processing and is called the atmospheric effect. The atmospheric disturbance effect is an important source of the GBIR measurement error, and its influence cannot be ignored. Within a monitoring distance range of 1km, when the humidity changes 1%, the deformation error caused by the atmospheric effect is as high as 2mm (Rödelsperger, 2010; Zeng, 2019). Therefore, atmospheric effect correction is a necessary step in GBIR data processing. In this study, we apply the small baseline set (SBAS) InSAR method. First, GBIR images are divided into several sets according to the spatiotemporal baseline information. Second, differential interference pairs are formed. The set allocation criteria are as follows: the baseline distance of the GBIR data in the same set is small, whereas that of the GBIR data between different sets is large. Therefore, specific coherent target points are selected as research objects through certain criteria, and the surface shape variable sequence of each small set is calculated in combination with the least square method. Finally, several SBAS are solved through singular value decomposition to obtain the whole surface deformation time series (Usai, 2001; Berardino, 2002), which effectively overcomes the influence of the spatiotemporal incoherence and atmospheric effects.
5) Velocity inversion and geocoding
Through the above steps, the shape variable rate can be calculated, but the calculated shape variable value is the range apparent deformation component, that is, the projection component of the real shape variable of the target area along the radar line of sight direction. To compare and fuse the deformation information obtained by GBIR monitoring and other technical means clearly, geocoding is required. The result of the radar coordinate system is projected onto the geographical coordinate system. That is, the 3D position vector of each pixel of the main image is obtained, which makes the result intuitive, clear, and easy to understand. According to the actual situation, the above is convenient to analyze and determine.
3 Results and Discussion
The GPRI-II instrument is employed to monitor the deformation process of the four wind turbine towers at various distances. The results are provided below.
3.1 Monitoring Results
1) FT1 monitoring results
The FT1 deformation monitoring results are shown in Figs.4–7. The left sides of Figs.4 and 6 illustrate the actual wind turbine tower, the red box indicates the monitoring position, the right side shows the monitoring interferogram, the white box indicates the position of the red box corresponding to the left side, the horizontal box refers to the position of the tower body with the height, and the vertical box indicates the change characteristics in the time dimension. Considering that the monitoring time is long, only a part of the results is selected. Figs.5 and 7 display the deformation characteristics at the selected windmill position over time, and the monitoring period is 60s.
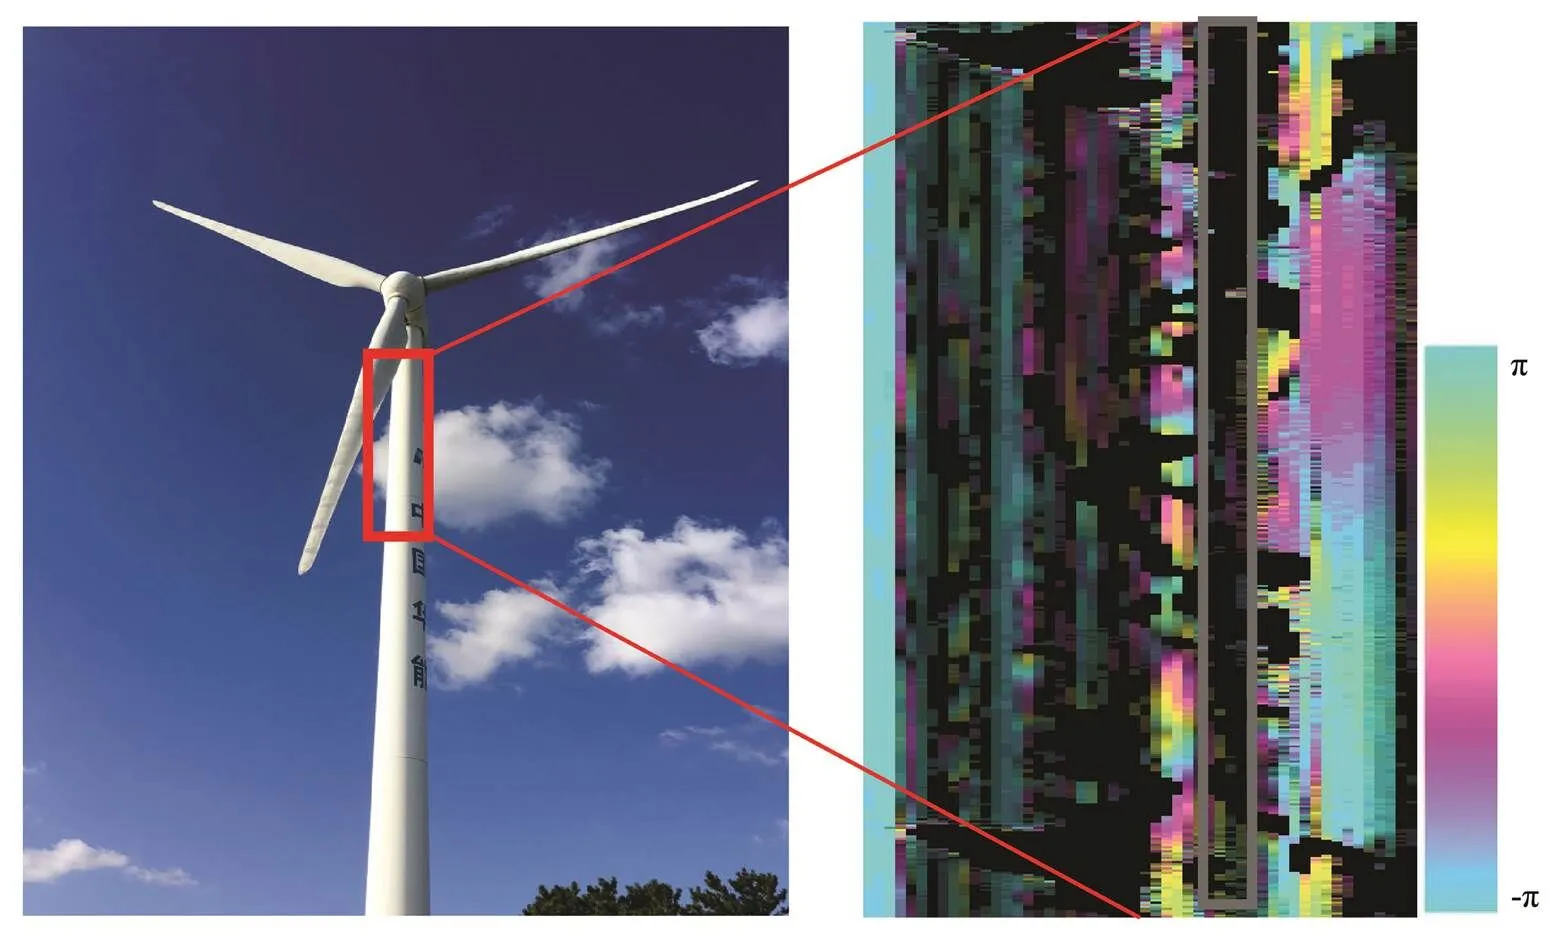
Fig.4 Phase unwrapping of the FT1 interferogram.
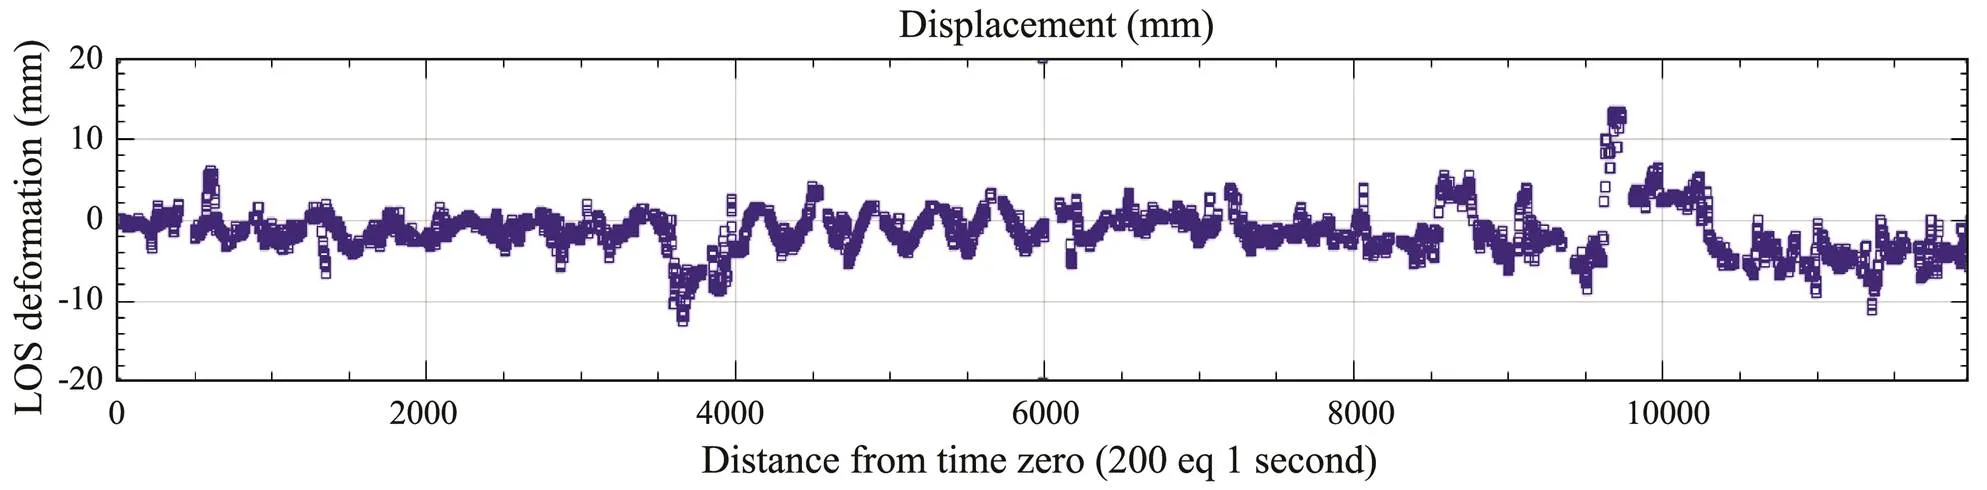
Fig.5 Deformation of the FT1 during the monitoring period.
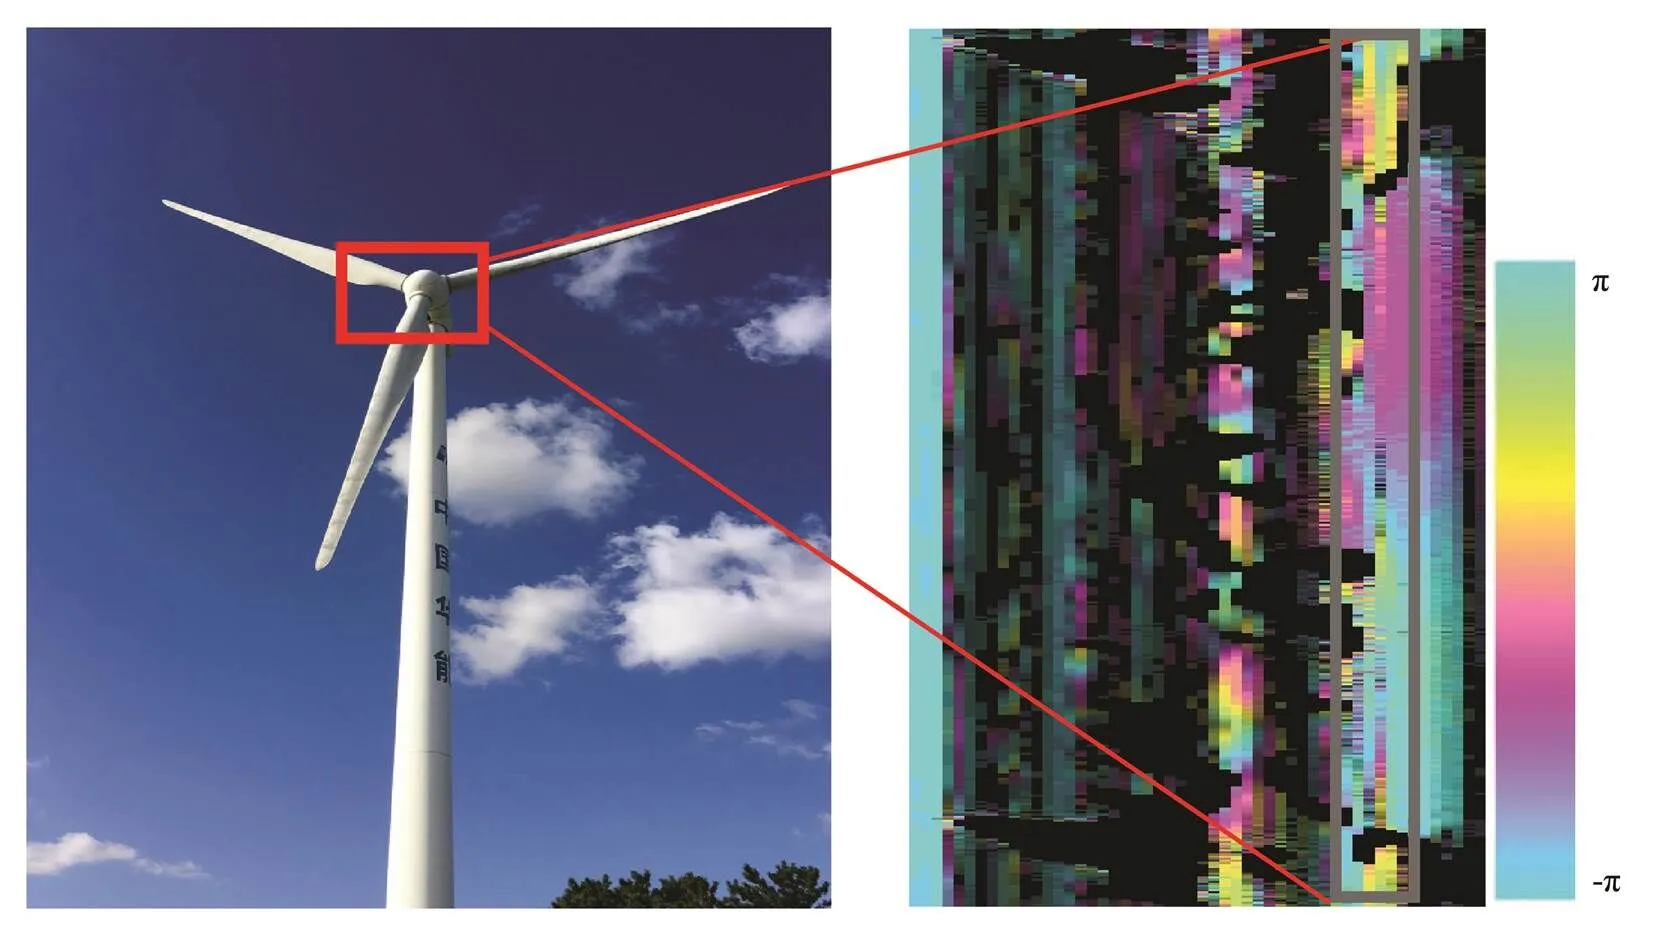
Fig.6 Phase unwrapping of the FT1 interferogram.
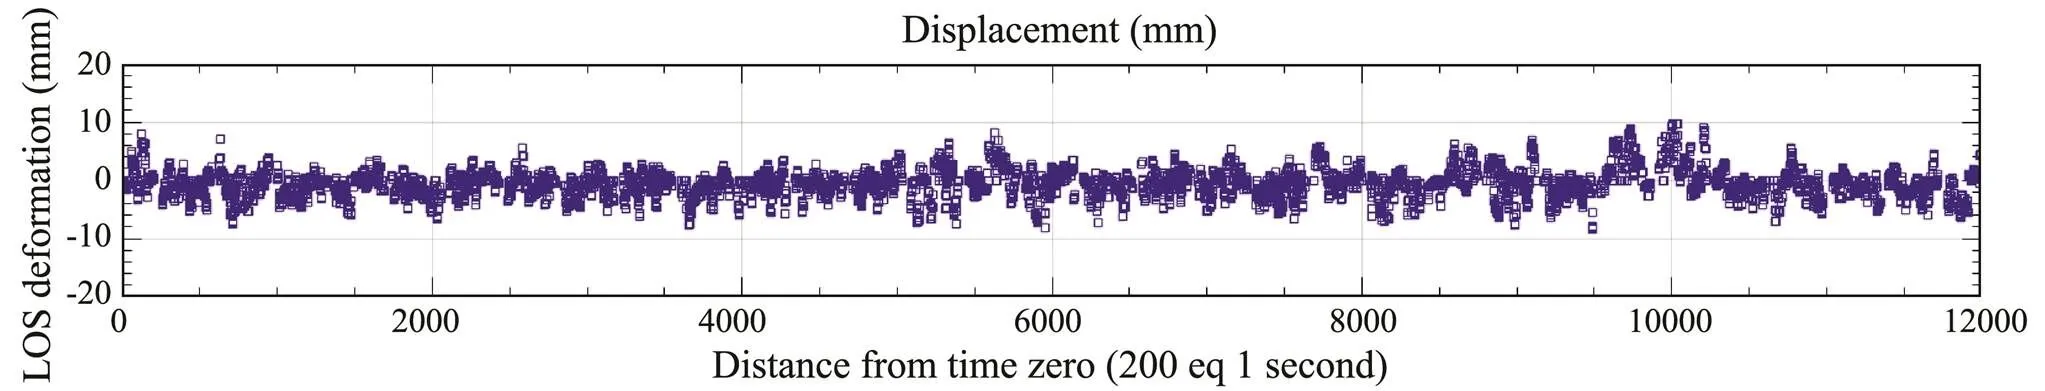
Fig.7 Deformation of the FT1 during the monitoring period.
During the monitoring process, the generator is in operation, and the wind turbine blade is constantly rotating. Due to the continuous rotation of the wind blade, obvious incoherence regions are observed in the interferogram, such as the distinct black areas at the upper and lower ends in the middle panels of Figs.4 and 6, which are the results of the incoherence caused by the passing of two wind blades. The time series deformation evolution diagrams in Figs.5 and 7 reveal that the tower body is in the swing state throughout the monitoring process, and the tower body vibration signal due to the influence of the wind force can be monitored. The overall vibration amplitude ranges from approximately −6–6mm, which is consistent with the wind conditions at that time. Given that the monitoring range occurs in front of the tower body, the left and right swing signals caused by wind blade swinging cannot be monitored, that is, the GBIR can obtain the deformation along the line of sight only. If the deformation results along the other directions are to be obtained, then the equipment should be reerected at other suitable positions.
2) FT2 monitoring results
The deformation monitoring results of the wind turbine tower are shown in Figs.8 and 9 (the meaning of each image is the same as above). Due to the relatively long distance, only a few tower pixels occur in the interferogram. During the monitoring process, the generator is in the static state, which is confirmed from the time series deformation diagram, as illustrated in Fig.9. Generally, the deformation amplitude of the tower body is relatively small, only from −1–1 mm, which also suggests that the tower body deformation is small under breezy conditions.
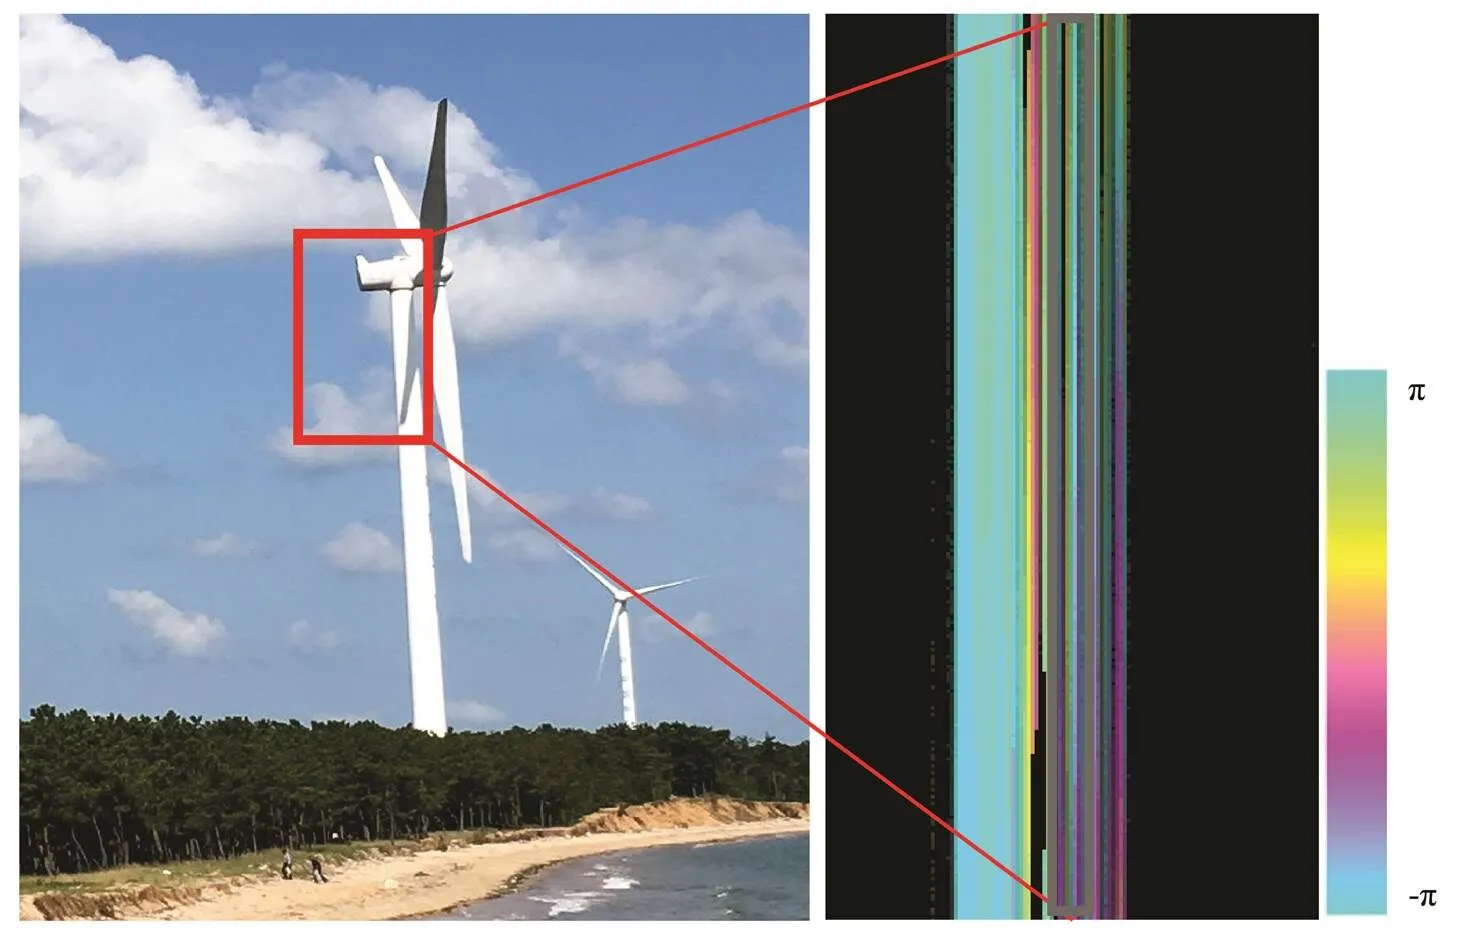
Fig.8 Phase unwrapping of the FT2 interferogram.

Fig.9 Deformation of the FT2 during the monitoring period.
3) FT3 and FT4 monitoring results
The deformation monitoring results of the FT3 and FT4 wind power towers are presented in Figs.3–5 and 3–6, respectively (the meaning of each image is the same as above). As the distance is relatively far, only a few tower body pixels are displayed in the interferogram. Compared with FT1 and FT2, the monitoring distance is longer, approximately 1km, and the width displayed on the interferogram is gradually reduced.
During the monitoring process, the generator is operating. According to the time series deformation diagrams shown in Figs.11 and 13, the overall deformation amplitude of the tower body is between −3 and 3mm, which is basically consistent with the wind condition at that time.
3.2 Discussion
Through the continuous observation of the fan vibration at different distances, the proposed method reveals the radar reflection intensity and coherence distribution of the fan tower with remarkable characteristics; it also visualizes the micro deformation information caused by the fan vibration in the form of a high-precision time series image displacement map. The monitoring distance is longer than 1km, and the accuracy still reaches the mm level. Moreover, the effectiveness and reliability of the method are verified under working and static conditions, thereby providing insights and a new tool for rapid and accurate fan vibration health diagnosis. Compared with GNSS, accelerometer (Osgood, 2001; Griffith, 2010; Osgood, 2010), and distributed optical fiber (Bang, 2012; Xu, 2013), the GBIR method can realize the real-time monitoring of targets and obtain high-precision shape variables without directly contacting the target. Therefore, no additional preparation steps, such as cable installation for power or data transfer, are needed inside the blade or the tower.
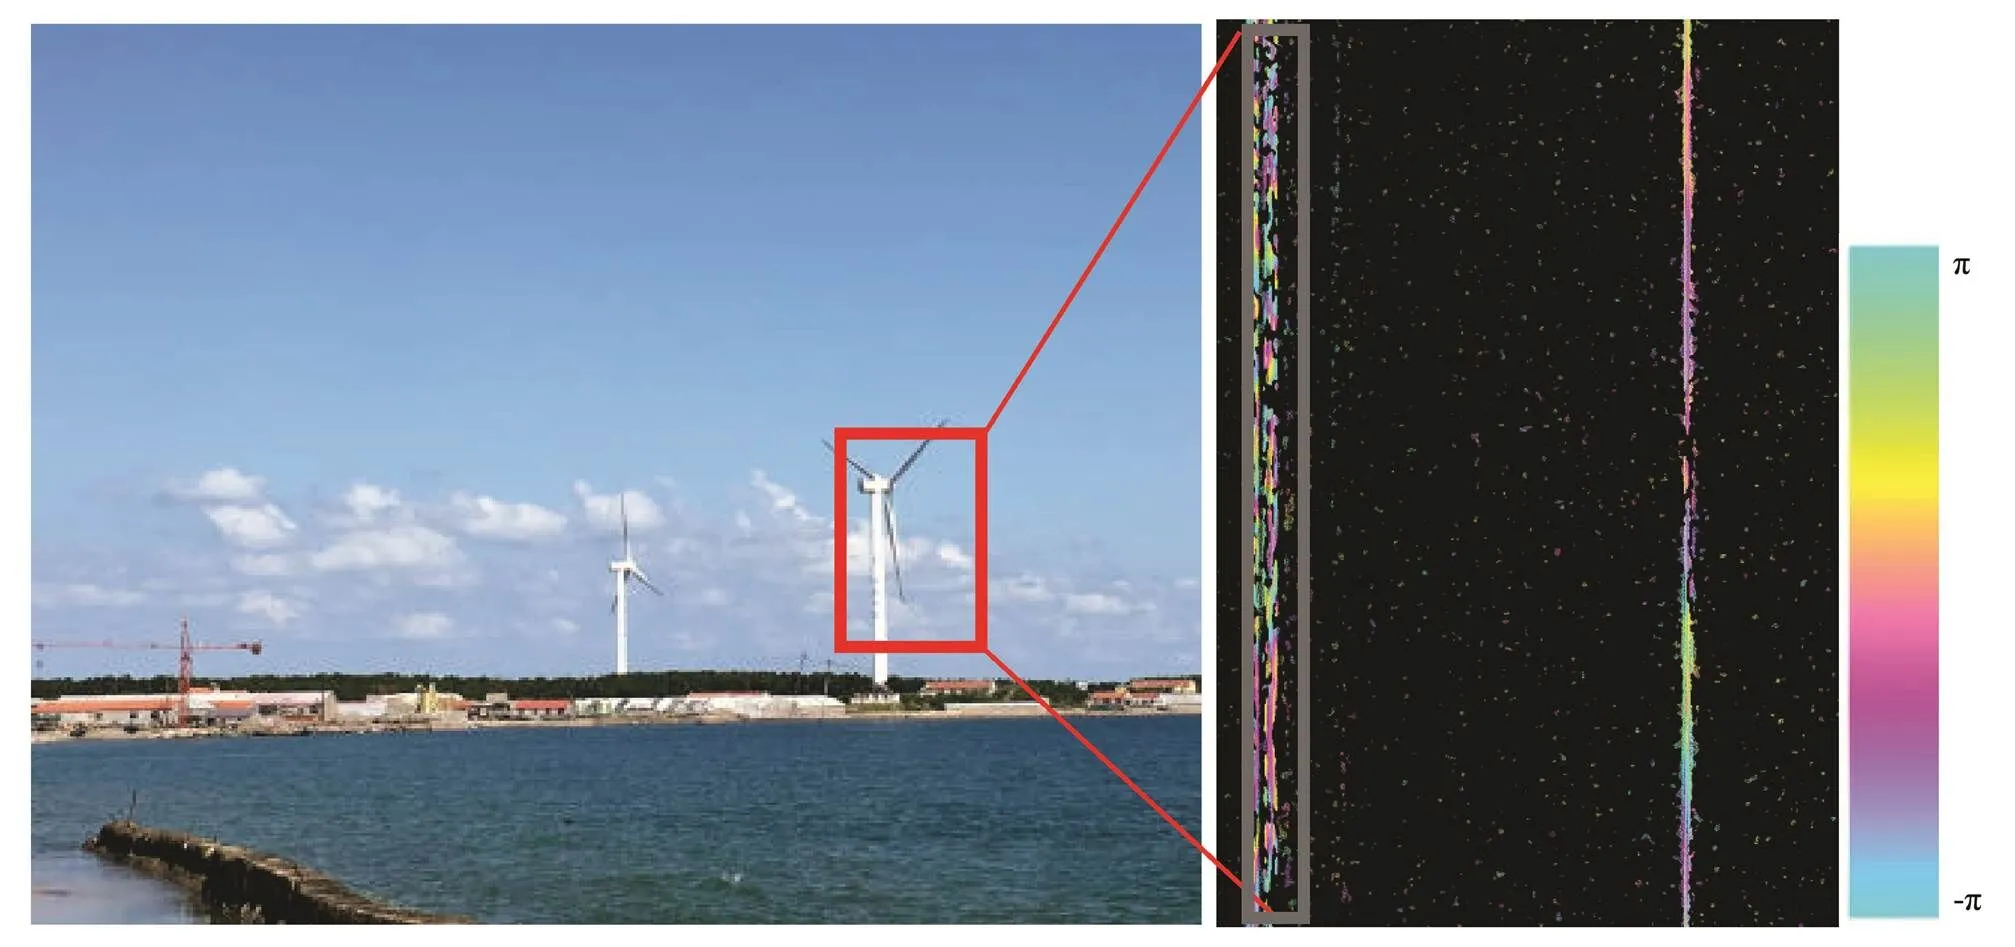
Fig.10 Phase unwrapping of the FT3 interferogram.
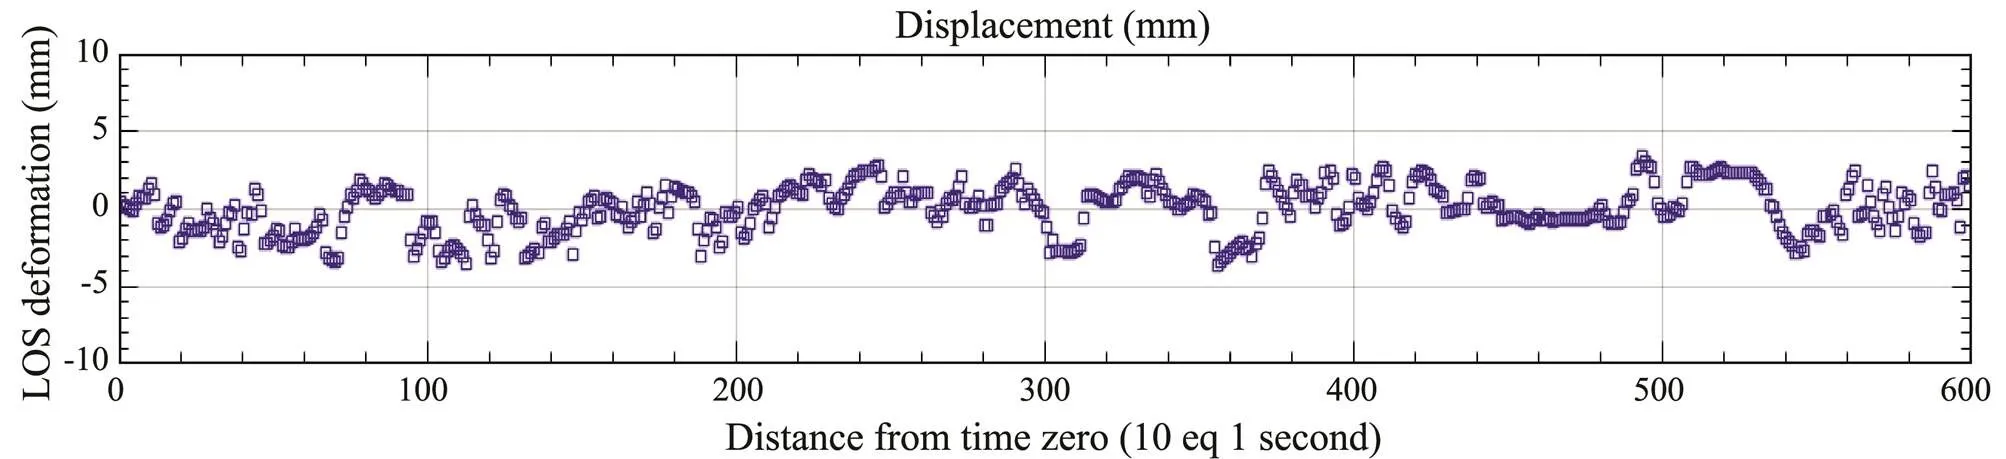
Fig.11 Deformation of the FT3 during the monitoring period.

Fig.12 Phase unwrapping of the FT4 interferogram.
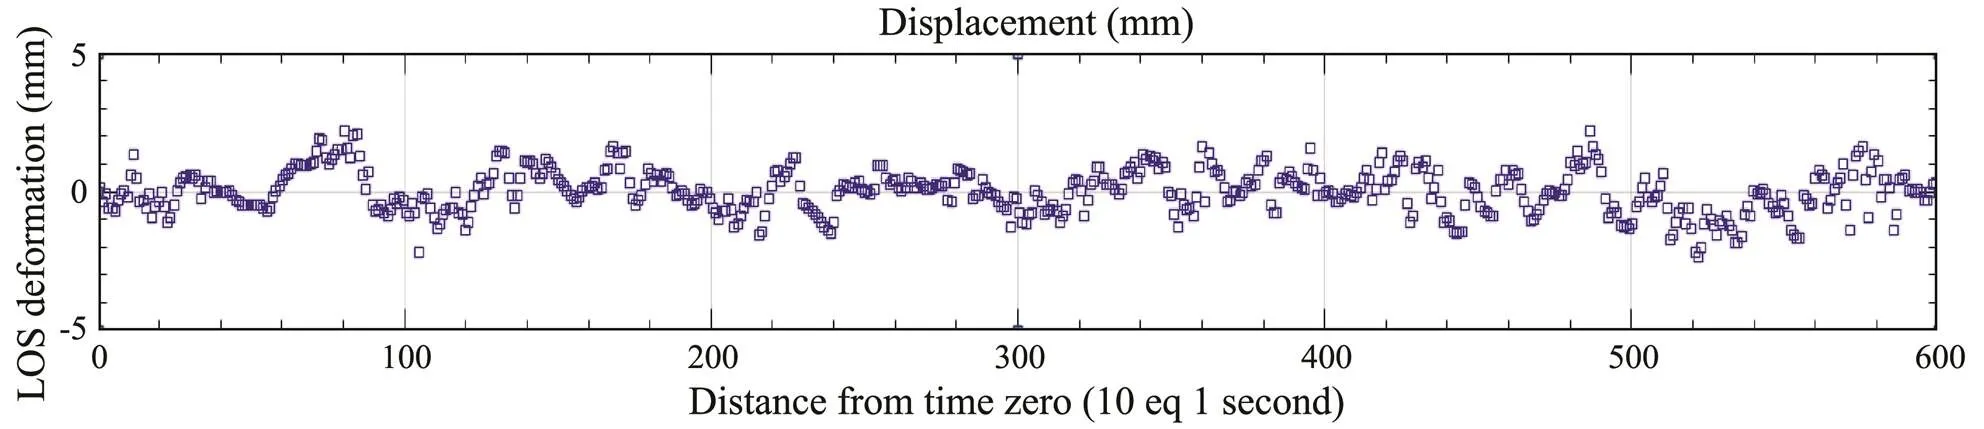
Fig.13 Deformation of the FT4 during the monitoring period.
According to current wind turbine vibration monitoring results, the accuracy of traditional methods, such as total stations (Wang and Sui, 2016), only reaches the cm level, which does not meet the requirements of strict measurement. The GNSS method has been applied in various deformation monitoring fields (Guo, 2020); it can monitor only the displacement changes in a series of feature points and cannot obtain the deformation of the whole surface. It cannot also readily reflect the deformation of the fan as a whole. Although close range ground photogrammetry (Ozbek, 2010) has been efficiently implemented at small scales in a wide variety of disciplines, this method is applied for the first time to a megawatt-scale wind turbine within the scope of this research project. However, the monitoring distance is limited. Even though 3D laser scanners (Nassif, 2005; Xie, 2017; Shi, 2019) can obtain high-precision point cloud data in real-time, the results are easily affected by terrain and meteorological conditions, especially coastal meteorological conditions, which are relatively complex. InSAR (Hu, 2014; Turbide, 2014) is suitable for the recognition of regional spatial deformation, although it can detect the millimeter-scale micro deformation of offshore wind turbines (Liu, 2011; Bhalla., 2014; Ferrentino, 2019). However, due to its limitations of fixed recurrence period, long baseline time, and single incident angle, the timeliness of vibration micro deformation monitoring for offshore wind turbines is also limited (Ma, 2020). Compared with other methods, the GBIR monitoring method has unique accuracy advantages, overcomes the limitations of weather conditions, and attains incomparable competitiveness.
The potential of the proposed technique under a variety of operating conditions has been demonstrated. However, the technique also has certain limitations that must be pointed out, such as the line of sight pointing upward, thereby neglecting other directions at present. Hence, if we wish to obtain the 3D deformation of a target, then we must set up instruments and equipment at different positions for continuous observation. Additionally, the GBIR technique is suitable for the micro deformation monitoring of high-rise buildings and local areas. With regard to large-scale deformation and settlement, the working efficiency is relatively low, and the spaceborne InSAR method has many advantages.
4 Conclusions
In this study, aiming at the potential deformation safety hazards caused by offshore wind turbine vibration, a real-time health diagnosis method using GBIR is proposed, and the key data processing flow is elaborated in detail. Real-time and reliable time series deformation maps at four different monitoring distances are successfully obtained. GBIR is useful in monitoring the dynamics of wind turbine vibration, thereby providing unprecedented spatial and temporal resolutions. The millimeter level monitoring accuracy of the ground-based radar system and the effectiveness and reliability of the monitoring method are verified. This method enriches the deformation monitoring means of high-rise buildings, improves the safety and health monitoring capacity of fans, provides information support and references for early warnings and the prevention of potential deformation disasters caused by wind turbine vibration, and avoids casualties and property losses caused by deformation disasters to the greatest extent.
1)Compared with conventional monitoring methods, the GBIR technique is a non-contact measurement method, which can realize the real-time, dynamic, and high-precision automatic deformation monitoring of offshore wind turbine vibration. It provides a real continuous space-time deformation map of the monitored area and can obtain the security risks of the deformation area as a whole.
2) Although we have accomplished the high-precision and real-time safety diagnosis of fan vibration, the GBIR technique obtains only deformation information along the radar line of sight. If we wish to acquire 3D deformation information of fan vibration, then we must monitor the fan along different directions, integrated in a unified coordinate frame, which can be achieved by establishing a 3D deformation model.
In the process of maritime power generation and the major national initiative of the ‘Maritime Silk Road’, taking the lead in adopting new technologies can greatly improve the efficiency and management levels of marine monitoring. Furthermore, the application prospect of the GBIR technique, with its high deformation monitoring potential of offshore wind power, can be enhanced in the future.
Acknowledgements
This research was funded by the Public Science and Technology Research Funds Projects of Ocean (No. 201405028), and the Scientific Research Project of Shandong Electric Power Engineering Consulting Institute Co., Ltd. (No. 2020-059).
Antonello, G., Casagli, N., Farina, P., Leva, D., Nico, G., Sieber A. J., and Tarchi, D., 2004. Ground-based SAR interferometry for monitoring mass movements., 1 (1): 21-28.
Bang, H., Kim, H., and Lee, K., 2012. Measurement of strain and bending deflection of a wind turbine tower using arrayed FBG sensors., 13 (12): 2121-2126.
Berardino, P., Fornaro, G., Lanari, R., and Sansosti, E., 2002. A new algorithm for surface deformation monitoring based on small baseline differential SAR interferograms., 40 (11): 2375-2383.
Bhalla, R., and Ling, H., 2014. Effect of wind turbine micro-Doppler on SAR and GMTI signatures. Radar Sensor Technology XVIII, International Society for Optics and Photonics. Maryland, 907716-1-10.
Caduff, R., Wiesmann, A., Bühler, Y., and Pielmeier, C., 2015. Continuous monitoring of snowpack displacement at high spatial and temporal resolution with terrestrial radar interferometry., 42: 813-820.
Casagli, N., Tibaldi, A., Merri, A., Del Ventisette, C., Apuani, T., Guerri, L., Fortuny-Guasch, J., and Tarchi, D., 2009. Deformation of Stromboli Volcano (Italy) during the 2007 eruption revealed by radar interferometry, numerical modelling and structural geological field data., 182 (3-4): 182-00.
Chen, J. D., and Wang, J., 2014. Development status, trends and prospects of offshore wind power in some foreign countries., 36 (4): 458-464.
Costantini, M., 1998. A novel phase unwrapping method based on network programming., 36 (3): 813-821.
Ferrentino, E., Nunziata, F., Marino, A., Migliaccio, M., and Li, X., 2019. Detection of wind turbines in intertidal areas using SAR polarimetry., 16 (10): 1516-1520.
Ferretti, A., Prati, C., and Rocca, F., 2000. Nonlinear subsidence rate estimation using permanent scatterers in differential SAR interferometry., 38 (5): 2202-2212.
Griffith, D. T., Mayes, R. L., and Hunter, P. S., 2010. Excitation methods for a 60kW vertical axis wind turbine., 1: 329-338.
Guo, W., Wang, G. Q., Bao, Y., Zhang, M. J., Sun, X. H., Zhao, R. B., and Gan, W. J., 2020. Tilt and settlement monitoring of high-rise building using GNSS precise point positioning and seasonal ground deformation., 45 (7): 1043-1051.
Hooper, A., Segall, P., and Zebker, H., 2007. Persistent scatterer interferometric synthetic aperture radar for crustal deformation analysis, with application to Volcán Alcedo, Galápagos., 112: B07407.
Hu, J., Li, Z. W., Ding, X. L., Zhu, J. J., Zhang, L., and Sun, Q., 2014. Resolving three-dimensional surface displacements from InSAR measurements: A review., 133: 1-17.
Intrieri, E., Gigli, G., Nocentini, M., Lombardi, L., Mugnai, F., and Casagli, N., 2015. Sinkhole monitoring early warning an experimental and successful GB-InSAR application., 241: 304-314.
Jáuregui, D. V., White, K. R., Woodward, C. B., and Leitch, K. R., 2003. Noncontact photogrammetric measurement of vertical bridge deflection., 8 (4): 212-222.
Ko, J. M., and Ni, Y. Q., 2005. Technology developments in structural health monitoring of large-scale bridges., 27 (12): 1715-1725.
Lazecky, M., Hlavacova, I., Bakon, M., Sousa, J. J., Perissin, D., and Patricio, G., 2016. Bridge displacements monitoring using space-borne X-band SAR interferometry., 10: 205-210.
Leva, D., Nico, G., Tarchi, D., Fortuny-Guasch, J., and Sieber, A. J., 2003. Temporal analysis of a landslide by means of a ground-based SAR interferometer., 41 (4): 745-752.
Li, J. H., 2016. Research on GB-InSAR deformation monitoring technology based on SFCW. Master thesis. University of Electronic Science and Technology of China.
Liu, Y., Wenhao, W., and Li, T., 2011. Power transmission towermonitoring technology based on TerraSAR-X products.. Nanjing, 8286: 82861E-1-82861E-7.
Ma, D. M., Li, Y. S., Cai, J. W., Li, B. Q., Liu, Y. X., and Chen, X. G., 2020. Real-time diagnosis of island landslides based on GB-RAR., 8: 192.
Ma, D. M., Liu, Y. X., Xu, W. X., Wang, Y. B., and Gao, X. G., 2018. Monitoring process and key technology of GB-InSAR., 8: 81-85.
Ma, J., 2010. Community structure and biodiversity of macrobenthos in Jiming Island of Weihai. Master thesis. Shandong Normal University.
Mário, V., Elsa, H., Miguel, A., Nuno, A., and Luís, R., 2018. Path discussion for offshore wind in Portugal up to 2030., 100: 122-131.
Monserrat, O., Crosetto, M., and Luzi, G., 2014. A review of ground-based SAR interferometry for deformation measurement., 93: 40-48.
Nassif, H. H., Gindy, M., and Davis, J., 2005. Comparison of laser Doppler vibrometer with contact sensors for monitoring bridge deflection and vibration., 38: 213-218.
Osgood, R., 2001. Dynamic characterization testing of wind turbines. National Renewable Energy Laboratory (NREL). Colorado, NREL/TP-500-30070.
Osgood, R., Bir, G., Mutha, H., Peeters, B., Luczak, M., and Sablon, G., 2010. Full-scale modal wind turbine tests: Comparing shaker excitation with wind excitation., Florida, USA, 113-124.
Ozbek, M., Rixen, D. J., Erne, O., and Sanow, G., 2010. Feasibility of monitoring large wind turbines using photogrammetry., 35: 4802-4811.
Peng, T., 2019. Monitoring and analysis on differential settlement of wind turbine foundation in an offshore wind farm., 33 (2): 75-78.
Pieraccini, M., 2013. Monitoring of civil infrastructures by interferometric radar: A review., 2013: 786961.
Pieraccini, M., Fratini, M., Parrini, F., and Atzeni, C., 2006. Dynamic monitoring of bridges using a high-speed coherent radar., 44: 3284-3288.
Psimoulis, P. A., and Stiros, S. C., 2007. Measurement of deflections and of oscillation frequencies of engineering structures using Robotic Theodolites (RTS)., 29: 3312-3324.
Qin, S. F., Li, W., and Sun, Y., 2017. Application study on fan power structure system safety monitoring., 39 (10): 158-162.
Rödelsperger, S., Becker, M., Gerstenecker, C., Läufer, G., Schilling, K., and Steineck, D., 2010. Digital elevation model with the ground-based SAR IBIS-L as basis for volcanic deformation monitoring., 49 (3): 241-246.
Severin, J., Eberhardt, E., Leoni, L., and Fortin, S., 2014. Development and application of a pseudo-3D pit slope displacement map derived from ground-based radar., 181: 202-211.
Shi, Y. J., 2019. Application of 3D laser scanning technology in verticality detection of fan tower., 47 (2): 110-115.
Sousa, J., and Bastos, L., 2013. Multi-temporal SAR interferometry reveals acceleration of bridge sinking before collapse., 13 (3): 659-667.
Takahashi, K., Matsumoto, M., and Sato, M., 2013. Continuous observation of natural disaster-affected areas using ground-based SAR interferometry., 6 (3): 1286-1294.
Tarchi, D., Antonello, G., Casagli, N., Farina, P., Fortuny-Guasch, J., Guerri, L., and Leva., D., 2005. On the use of ground-based SAR interferometry for slope failure early warning: The Cortenova rock slide (Italy)., 2005: 337-342.
Tarchi, D., Ohlmer, E., and Sieber, A., 1997. Monitoring of structural changes by radar interferometry., 9: 213-225.
Turbide, S., Marchese, L., Terroux, M., and Bergeron, A., 2014. Synthetic aperture ladar concept for infrastructure monitoring., 2014: 92500B.
Usai, S., 2001. A new approach for long term monitoring of deformations by differential SAR interferometry. PhD thesis. Delft University of Technology.
Voytenko, D., Dixon, T. H., Howat, I. M., Gourmelen, N., Lembke, C., Werner, C. L., De La Peña, S., and Oddsson, B., 2015. Multi-year observations of Breiðamerkurjökull, a marine-terminating glacier in southeastern Iceland, using terrestrial radar interferometry., 61: 42-54.
Wang, J. H., and Sui, J. W., 2016. Study on the method of wind power tower deformation monitoring., 39 (6): 19-21.
Wang, Z. X., Jiang, C. W., Ai, Q., and Wang, C. M., 2009. The key technology of offshore wind farm and its new development in China., 13 (1): 216-222.
Werner, C., Wiesmann, A., Strozzi, T., Kos, A., Caduff, R., and Wegmiuler, U., 2012. The GPRI multi-mode differential interferometric radar for ground-based observations.. Nuremberg, Germany, 304-307.
Wong, K. Y., 2004. Instrumentation and health monitoring of cable-supported bridges., 11 (2): 91-124.
Wu, X. N., Hu, Y., Li, Y., Yang, J., Duan, L., Wang, T. G., Adcock, T., Jiang, Z. Y., Gao, Z., Lin, Z. L., Borthwick, A., and Liao, S. J., 2019. Foundations of offshore wind turbines: A review., 104: 379-393.
Xie, H. Q., Yang, T., Xu, D. W., Qin, Y. Z., Lu, X., and Wang, C., 2017. Experimental study of the tilt of wind turbine tower using laser point cloud data., 2017 (12): 38-42.
Xu, J. L., 2013. DPP-BOTDA based wind turbine blade fatigue monitoring technique and evaluation method. Master thesis. Harbin Institute of Technology.
Xu, Z. S., and Xia, M. M., 2011. Distance and similarity measures for hesitant fuzzy sets., 181: 2128-2138.
Zeng, T., Deng, Y. K., Hu, C., and Tian, W. M., 2019. Development state and application examples of ground-based differential interferometric radar., 8 (1): 154-170.
Zhang, B. C., Ding, X. L., Jiang, M., Zhang, B., Wu, S. B., and Liang, H. Y., 2016. Ground-based interferometric radar for dynamic deformation monitoring of the Ting Kau Bridge in Hong Kong., Beijing, 6875-6878.
Zhang, B. C., Ding, X. L., Werner, C., Tan, K., Zhang, B., Jiang, M., Zhao, J. W., and Xu, Y. L., 2018. Dynamic displacement monitoring of long-span bridges with a microwave radar interferometer., 138: 252-264.
Zhang, L., Ding, X. L., and Lu, Z., 2011. Ground settlement monitoring based on temporarily coherent points between two SAR acquisitions., 66 (1): 146-152.
Zogg, H., and Ingensand, H., 2008. Terrestrial laser scanning for deformation monitoring-load tests on the felsenauduct (CH)., Beijing, 555-562.
August 27, 2020;
February 28, 2021;
March 23, 2021
© Ocean University of China, Science Press and Springer-Verlag GmbH Germany 2021
. E-mail: demingma@fio.org.cn
(Edited by Xie Jun)
杂志排行

Journal of Ocean University of China的其它文章
- Case Study of a Short-Term Wave Energy Forecasting Scheme:North Indian Ocean
- Temporal and Spatial Characteristics of Wave Energy Resources in Sri Lankan Waters over the Past 30 Years
- Dependence of Estimating Whitecap Coverage on Currents and Swells
- The Variation of Microbial (Methanotroph) Communities in Marine Sediments Due to Aerobic Oxidation of Hydrocarbons
- 3-Aminopropyltriethoxysilane Complexation with Iron Ion Modified Anode in Marine Sediment Microbial Fuel Cells with Enhanced Electrochemical Performance
- Removal of Sulfamethazine by Corn Biochars from Aqueous Solution: Sorption Mechanisms and Efficiency