Effect of Zinc Oxide Nanoparticles on Denitrification and Denitrifying Bacteria Communities in Typical Estuarine Sediments
2021-06-25CHENXiXIANGZhuangzhuangRENZhaomengHUANGXiaoLIHuiSUNPengfeiandBAIJie
CHEN Xi, XIANG Zhuangzhuang, REN Zhaomeng, HUANG Xiao, LI Hui, 4), SUN Pengfei, and BAI Jie, 4), *
Effect of Zinc Oxide Nanoparticles on Denitrification and Denitrifying Bacteria Communities in Typical Estuarine Sediments
CHEN Xi1), 2), XIANG Zhuangzhuang1), REN Zhaomeng1), HUANG Xiao3),*, LI Hui1), 4), SUN Pengfei1), and BAI Jie1), 4), *
1)College of Environmental Science and Engineering, Ocean University of China, Qingdao 266100, China 2) College of Marine Life Sciences, Ocean University of China, Qingdao 266003, China 3)Collaborative Innovation Center of Atmospheric Environment and Equipment Technology,Jiangsu Key Laboratory of Atmospheric Environment Monitoring and Pollution Control, School of Environmental Science and Engineering, Nanjing University of Information Science and Technology, Nanjing 210044, China 4)Key Laboratory of Marine Environmental Science and Ecology, Ministry of Education, Ocean University of China, Qingdao 266100, China
For revealing the effects of increasing of zinc oxide nanoparticles (ZnO NPs) on denitrification and denitrifying bacteria communities in estuarine sediments, the surface sediments of two typical estuaries (the Yangtze River Estuary and the Yellow River Estuary) were added with medium concentration (170mgL−1) and high concentration (1700mgL−1) of ZnO NPs for anaerobic culture in laboratory. The concentration of NO3−and NO2−, the reductase activity and denitrification rate were measured by physicochemical analysis,gene abundance and denitrifying bacteria communities by molecular biological methods. The results showed that ZnO NPs inhibited NO3−, NO2−reduction process and NO3−, NO2−reductase activity, and a stronger inhibition effect resulting from the higher ZnO NPs concentration. ZnO NPs decreasedgene abundance and community diversity of denitrifying bacteria. In addition, the inhibition degree of ZnO NPs on the denitrification process of sediments in different estuaries was different. These results were of great significance for evaluating the potential ecological toxicity and risks of nanomaterials in estuaries.
zinc oxide nanoparticles; denitrification; denitrifying bacteria community; estuarine; sediments
1 Introduction
As one of the most common nanomaterials, zinc oxide nanoparticles (ZnO NPs) are widely used in coatings, clothings, water treatments and other fields (Kumar., 2017), and their releasing and a series of processes such as accumulation, dissolution, complexation, transformation and sedimentation cause potential risks to natural waters and sediment ecosystems (Jiang.,2017). Some studies have been performed to assess the influence of nanoparticles (.., Ag and CuO) on the denitrification and the microbial community structure in sediment bio- films (Miao., 2019; Liu., 2020; Wang., 2020). The toxicity of ZnO NPs to microorganisms were mainly attributed to the release of dissolved Zn2+ions and the generation of reactive oxygen species (ROS) induced by nanoparticles (Sirelkhatim., 2015). Zheng. (2011) also found that the presence of ZnO NPs could increase reactive oxygen species (ROS), which led to the decrease of nitrate reductase activities. In addition, ZnO NPs can also inhibit the gene expression and catalytic activities of key denitrifying enzymes (Zheng., 2014).The toxicity of ZnO NPs is also related to its concentration, the higher the concentration of ZnO NPs, the stronger the inhibition. ZnO NPs even can promote the growth of microorganisms when the concentration is too low (Brayner.,2006).
As a key process in nitrogen cycle, denitrification is driven by a variety of heterotrophic denitrifying bacteria (Altabet., 2002; Wan.,2018). Denitrifying bacteria gradually reduce NO3−to NO2−, NO, N2O and N2with carbon substrates as electron donors, and the corresponding catalytic reductases include nitrate reductase (Nar), nitrite reductase (Nir), nitric oxide reductase (Nor) and nitrous oxide reductase (Nos) (Wan.,2016). Denitrification processes depend on microbial population characteristics and enzymatic activities, which are related to various physical and chemical conditions, such as temperature, pH, organic carbon substrates, and toxic compounds (Denise.,2011; Wang and Chen, 2015). Meanwhile, previous studies have shown that nanomaterials could influence denitrification by altering microbial community structure, reducing the abundances of denitrification functional genes (such as,) and microbial enzymes activities (Chen.,2012). Denitrifying bacteria could be quantified by coding the functional genes of key denitrification enzymes (Wan.,2016).
Estuary is an important nitrogen sink of terrestrial and marine ecosystems. Denitrification in estuarine sediments plays a vital role in alleviating eutrophication and improving nitrogen load of marine system. Estuary is also a sensitive area that is affected by exogenous pollutants on community diversity and ecological functions of denitrifying bacteria (Nogales., 2002).
In this study, the effects of different ZnO NPs concentrations on NO3−and NO2−reduction process, reductase activity, denitrification rate,gene abundance and denitrifying bacteria communities were analyzed to investigate the potential influence of ZnO NPs on denitrification and mechanisms for the toxicity. This study could provide evidence for studying the effect of ZnO NPs on the ecological functions in sediments from different estuaries.
2 Materials and Methods
2.1 ZnO NPs for Experiment and Pretreatment
ZnO NPs (CAS is 1314-13-2) used in this study were purchased from SIGMA-ALDRICH®. The ZnO NPs dissolution is prone to agglomeration effect, so ultrasonic treatment (40kHz and 250W) was needed for 1h under ice bath conditions (Table 1). The average diameter and Zeta potential of different concentrations of ZnO NPs in the exposure suspension were determined by dynamic light scattering (DLS) with a Malvern Zetasizer Nano ZS90 (Malvern Instruments, UK).
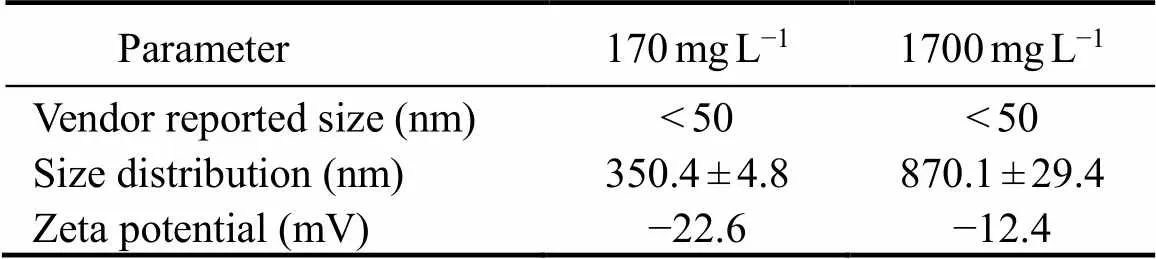
Table1 Different concentrations of ZnO NPs properties
2.2 Station Placement
In October 2018, two sampling stations were set up in the Yangtze River Estuary (Station A, 122.3364˚E, 31.1111˚N) and the Yellow River Estuary (Station B, 119.3750˚E, 37.3342˚N), respectively, as shown in Fig.1. The Yangtze River Estuary and the Yellow River Estuary are the most important estuaries in the South and North of China, but their environmental characteristics and the ecological impacts of land-based pollutants are different. Atmospheric subsidence, sewage from domestic, industry and agriculture, and input of surface runoff have brought a lot of pollutants to the estuary. Considering the rapid development of nanotechnology, more and more NPs would be released into these areas which would cause great pressure on the environment of the regions.

Fig.1 Sampling stations.
2.3 Establishment of Cultivation System and Experimental Incubation
Surface sediments (0–5cm) were collected by Peterson mud collector from two sampling stations. The sediments were immediately packed into sterile plastic bags, and the bottom seawater of the corresponding stations was collected into a polyethylene plastic bottle. All sediments were refrigerated in −4℃ and brought back to laboratory, the sediments were filtered through 1 mm sieve to remove large particles, and the seawater was filtered through 0.22 μm acetate membrane. The characteristics of seawater and sediments from two stations are shown in the Table 2.
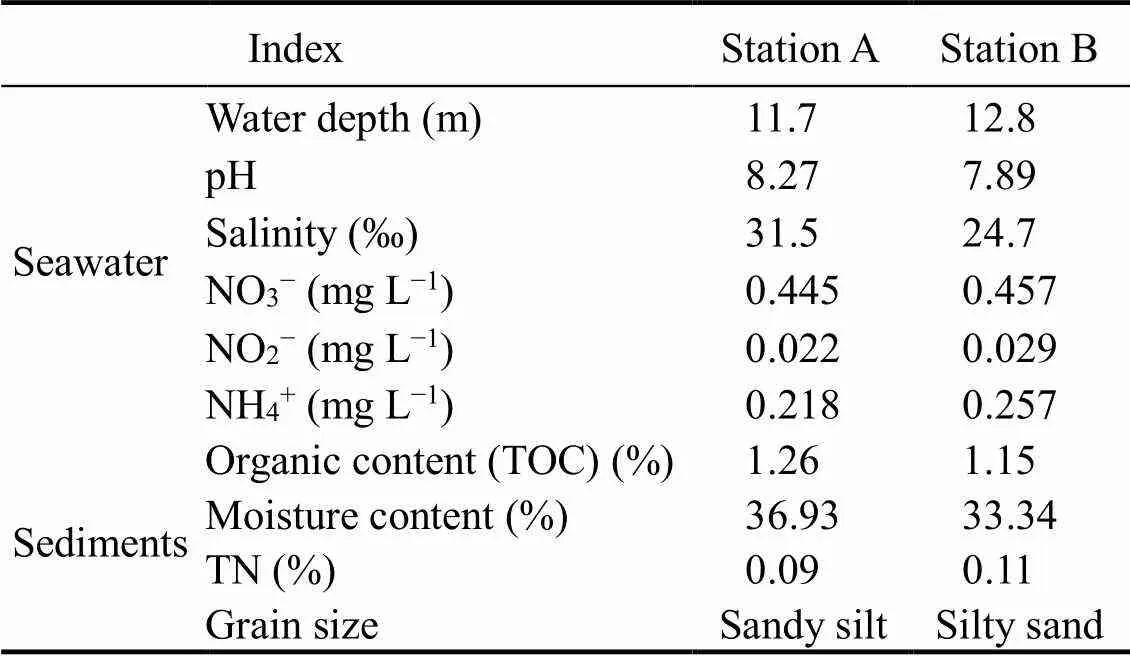
Table 2 The characteristics of seawater and sediments
Two control groups and four treatment groups were set up with different concentrations of ZnO NPs at two stations, respectively. The low and high concentration treatment groups were set up according to semi-inhibition concentration and 10 times of the semi-inhibition concentration of ZnO NPs on denitrification, respectively. The experimental groups were named as: AC (Station A, 0mgL−1), AL (Station A, 170mgL−1) and AH (Station A, 1700mgL−1), BC (Station B, 0mgL−1), BL (Station B, 170mgL−1) and BH (Station B, 1700mgL−1).
Each incubation bottle was filled with 15g of sediments and 15mL of the above culture medium. The culture medium was disposed into overlying seawater, which all contained 1% C6H12O6and 50mmolL−1KNO3. The pretreated ZnO NPs were added to the culture medium to make up treatment groups of different ZnO NPs concentrations. All incubation bottles were purged with nitrogen for 15min and then sealed to an anaerobic environment. The bottles were incubated at 28℃ for 8d in a constant temperature oscillator for 100rmin−1. Three parallel experimental groups were set up for each concentration.
2.4 Sample Collecting and Processing
Five groups of culture experiments at each concentration of ZnO NPs concentrations were conducted at the same time. On 0, 2nd, 4th, 6th and 8th day of culture, 15mL mud-water mixture after shaking was taken and the NO3−and NO2-concentration, NO3−and NO2−reductase activity, denitrification rate in sediments were determined immediately.Thegene abundance was determined by sampling on 0, 4 and 8d, respectively, and the community structure and diversity of denitrifying bacteria were determined by sampling at the end of incubation. All sediment samples were immediately stored at -80℃.
2.5 NO3−, NO2−Reductase Activity and Denitrification Rate Analysis
Measurements of NO3−, NO2−reductase as following: 5 mL of the cultured muddy water mixture after incubation was collected and centrifuge with 8000rmin−1for 10min, and then discard the supernatant, wash with 100molL−1potassium phosphate buffer (pH=7.4) for 3 times. Ultrasonic treatment was followed under 4℃ with 20kHz for 5 min, and centrifuged (12000rmin−1, 10 min) again. The supernatant after centrifugation and reductase culture medium were mixed into anaerobic bottle to incubate anaerobically at 30℃ for 30 min. The NO3−, NO2−reductase activity were calculated according to the reduction amount of NO3−, NO2−(Bao.,2016). The reductase culture medium contained: 100mmolL−1potassium pho- sphate buffer, 1mmolL−1NaNO3/NaNO2, 1mmolL−1me- thyl viologen and 5mmolL−1Na2S2O4.
The denitrification rate was determined by slightly improved acetylene inhibition method (Zhong.,2009).
The NO3−, NO2−concentration were determined by QuAAtro nutrient salt automatic analyzer (AA3, German bran-luebbe).
2.6 Molecular Biological Anlysis
2.6.1 Total DNA extraction and PCR amplification
The total DNA was extracted by Mag-Bind Soil DNA Kit (200) (Omega Bio-Tek) and detected by Nanodrop (Thermo Scientific) for concentration and purity of nucleic acid, then stored at −80℃ for subsequent molecular biological determination. The region ofgene was amplified by ordinary PCR, and the primer used was Cd3aF-R3cd (Jarvis.,2004). PCR amplification mixture contained: 5×reaction buffer 5 μL, 5×GC buffer 5μL, dNTP (2.5mmolL−1) 2μL, Forwardprimer (10μmolL−1) 1μL, Reverseprimer (10μmolL−1) 1μL, DNA Template 2μL, ddH2O 8.75μL, Q5 DNA Polymerase 0.25μL. PCR amplification conditions: initial denaturation 98℃ for 2 min, denaturation 98℃ for 15s, annealing 55℃ for 30s, extension 72℃ for 30s, final extension 72℃ for 5min, 10℃ holding 25–30 cycles. The target bands were recovered by 1.2% agarose gel electrophoresis, and the recovery concentration of target bands was used to confirm whether the amplification was successful or not. The amplified products were tested as soon as possible.
2.6.2 Real-time PCR
The target gene bands recovered by agarose gel electrophoresis were cloned, and plasmid DNA was extracted and diluted 10 times gradient to establish standard curves. Thegene was quantitatively analyzed by Real-time PCR using total DNA extracted from sediment samples as template.
The used primer ofgene: Cd3aF-R3cd.
PCR amplification conditions: 95℃ for 5min, 95℃ for 15s, 60℃ for 30s, 40 cycles.
PCR amplification mixture: 16μL of system contained: 8µL mixture A system (2×SYBR real-time PCR premixture 10μL, Forwardprimer (10μmolL−1) 0.4μL, Reverseprimer (10μmolL−1) 0.4μL), 8µL of DNA template diluent.
2.6.3 Community of denitrifying bacteria assay
The sediment samples were sequenced by Personalbio Company (Shanghai, China) to analyze the diversity of microbial communities. The community structure was divided into operational taxa (OTU) by QIIME software, and Alpha diversity was analyzed by calculating Shannon index (Shannon, 1948), Simpson index (Simpson, 1972) and coverage.
2.7 Statistical Analysis
Data mapping was done with origin 9.2. Statistical ana- lysis was finished by SPSS 19.0, and significance of difference was tested by one-way ANOVA (<0.05 was considered to be statistically significant).
3 Results
3.1 Effect of ZnO NPs on Removal of NO3− and Accumulation of NO2−
3.1.1 Removal efficiency of NO3−
The variation of NO3−concentration in sediments exposed to different ZnO NPs concentrations with incubation time (Fig.2). In the Yangtze Estuary, the removal effi- ciency of NO3−in control group, low concentration group and high concentration group was 71.71%, 51.02% and 35.92% on the 2nd day, respectively. The removal efficiency of NO3−in the treatment groups was significantly lower than that in the control group. Then the difference of removal efficiency of NO3−among three groups gradually decreased. On the 8th day, the three groups of removal efficiency of NO3−changed into 98.35%, 97.47% and 93.06%, respectively. In the Yellow River Estuary, the removal efficiency of NO3−of the three groups was 91.44%, 76.73% and 58.59%, and on the 8th day, the removal efficiency of NO3−is 99.96%, 99.73% and 89.26%. Therefore, ZnO NPs had an inhibition on the removal efficiency of NO3−in sediments, and the higher the ZnO NPs concentration, the stronger the inhibition (<0.05).
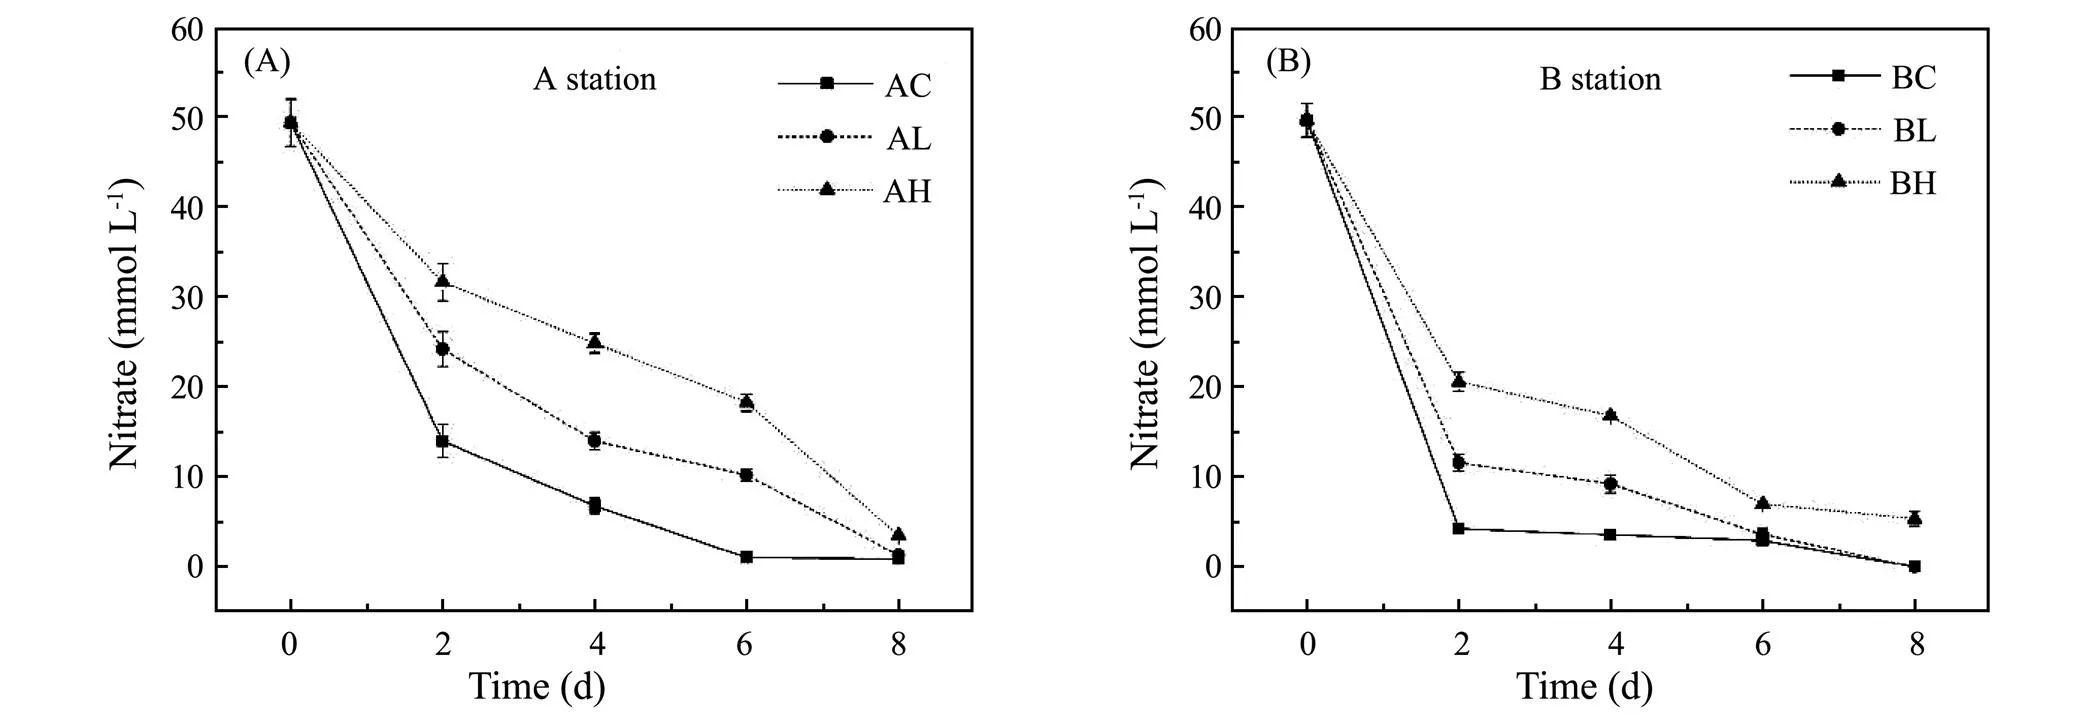
Fig.2 Variation of NO3− concentration at different ZnO NPs concentrations.
3.1.2 Accumulation of NO2−
The variation of NO2−concentration exposed to different ZnO NPs concentrations with incubation time was shown in Fig.3. In the Yangtze Estuary, the reduction amount of NO2−in control group, low concentration group and high concentration group was 34.88, 24.95 and 17.71mmolL−1on the 2nd day, respectively. The reduction amount of NO2−in treatment groups was significantly lower than that in control group, and then gradually recovered. On the 8th day, the reduction amount of NO2−in three groups was 48.29, 44.18 and 31.28mmol L−1, respectively. In the Yellow River Estuary, the reduction amount of NO2−in the above groups was 32.61, 31.14 and 25.43mmolL−1, and on the 8th day, the corresponding reduction amount of NO2−was 48.29, 44.18 and 31.28mmolL−1. Fig.3 illustrates that ZnO NPs could inhibit the reduction of NO2−, and the higher the ZnO NPs concentration, the stronger the inhibition (<0.05), which aggravated the accumulation of NO2−. The inhibition degree of ZnO NPs on the reduction of NO2−in sediments in the Yangtze River Estuary was greater than that in the Yellow River Estuary.
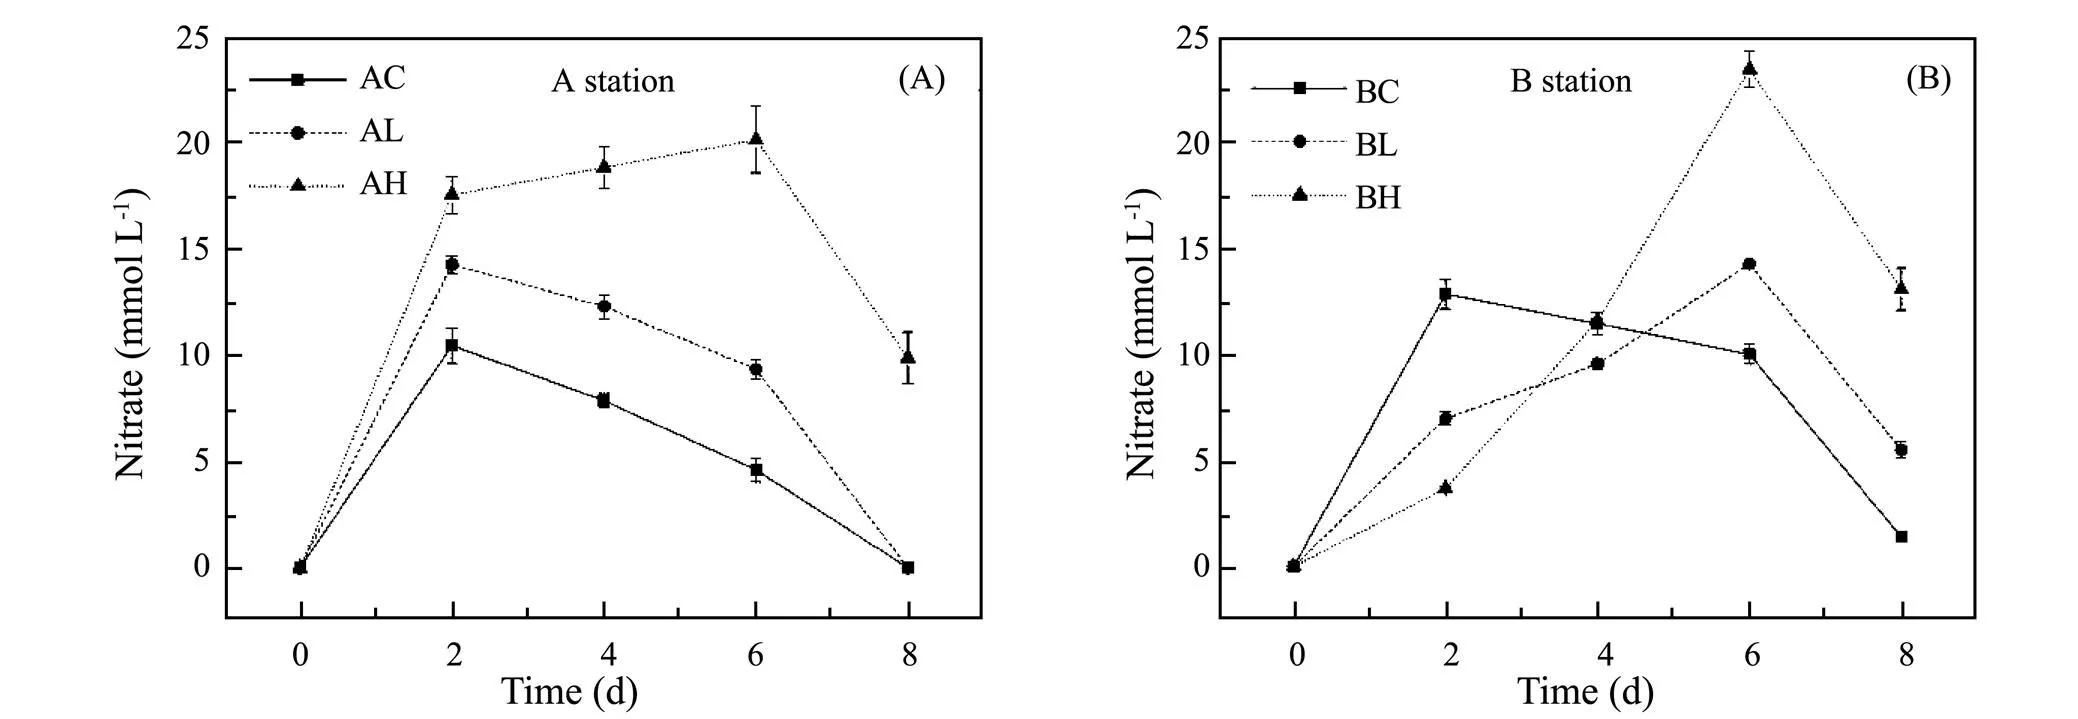
Fig.3 Variation of NO2− concentration at different ZnO NPs concentrations.
3.2 Effect of ZnO NPs on NO3−, NO2−Reductase Activity in Sediments
3.2.1 Effect of ZnO NPs on NO3−reductase activity in sediments
The variation of NO3−reductase activity in sediments exposed to different ZnO NPs concentrations was shown in Fig.4. In the Yangtze Estuary (shown in Fig.4A), on the 2th day, the NO3−reductase activity in control, low and high concentration groups were 3.97, 3.51 and 2.65µmol(hg)−1, and the low and high concentration groups were 88.4% and 66.9% of the control group, respectively, indicating the NO3−reductase activity in treatment groups were significantly inhibited, then gradually recovered to 91.3% and 74.7% of the control group on the 8th day.
In the Yellow River Estuary (shown in Fig.4B), on the 2th day, the NO3−reductase activity in treatment groups were the lowest during incubation, which were 84.5% and 77.7% of the control group. On the 8th day, the NO3−reductase activity in the low and high concentration groups recovered to 91.6% and 86.3% of the control group, respectively. The results indicated that ZnO NPs could inhibit NO3−reductase activity in sediments at both stations, and the higher the ZnO NPs concentration, the stronger the inhibition (<0.05).
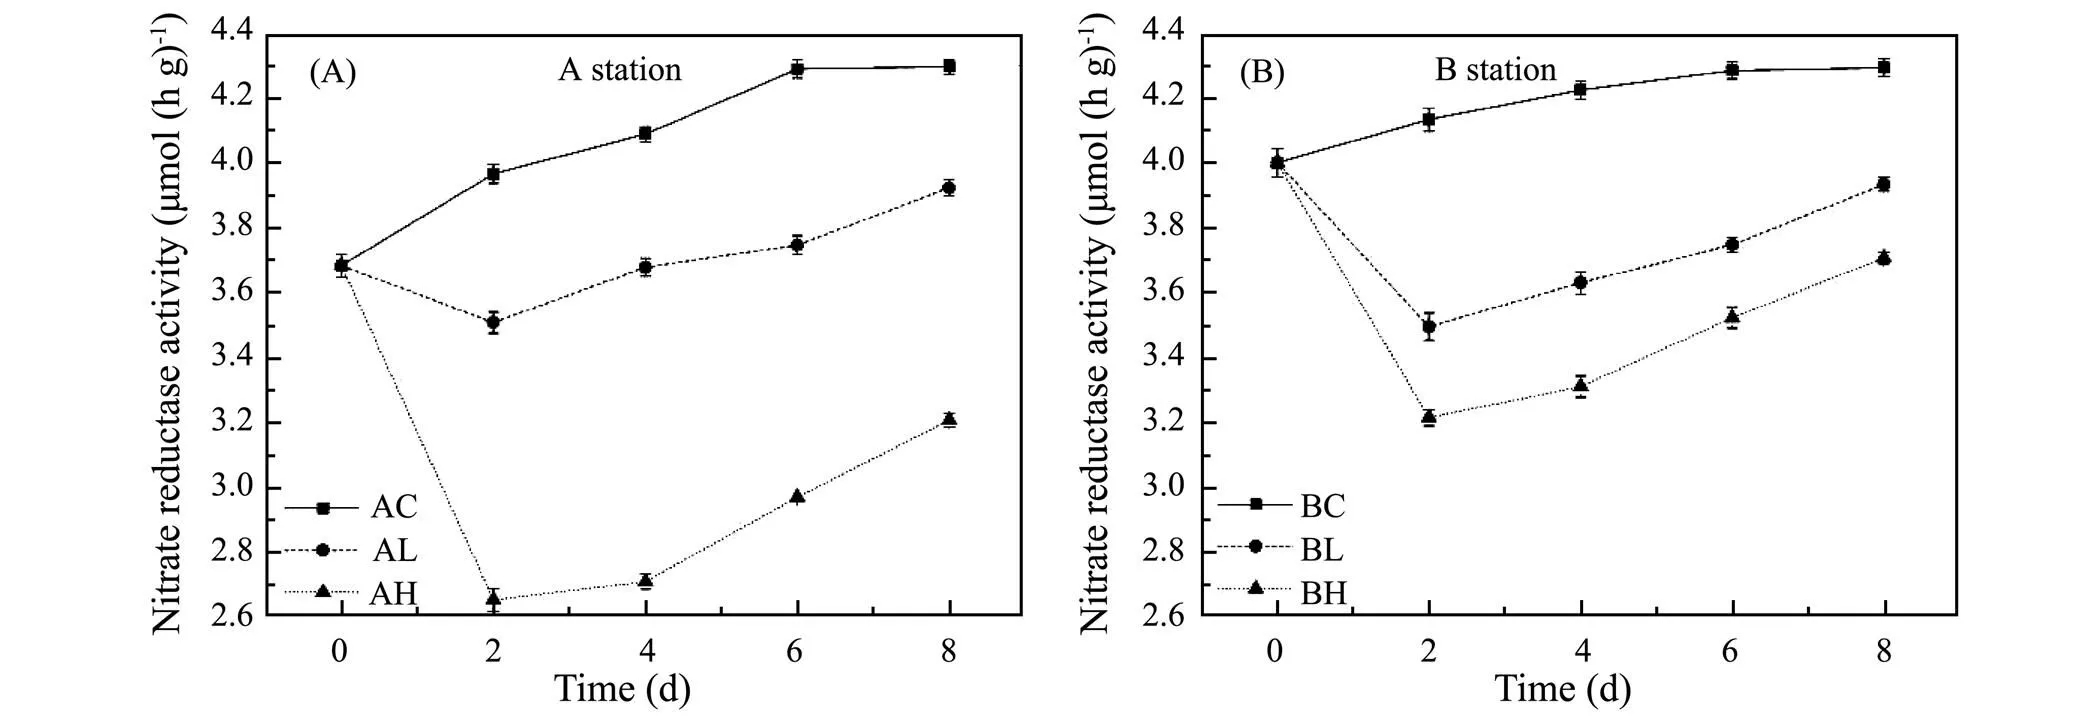
Fig.4 Variation of NO3− reductase at different ZnO NPs concentrations.
3.2.2 Effect of ZnO NPs on NO2−reductase activity in sediments
The variation of NO2−reductase activity in sediments exposed to different ZnO NPs concentrations is shown in Fig.5. The reductase activity in treatment groups was significantly lower than that in the control group at both stations. In the Yangtze Estuary (shown in Fig.5A), the difference NO2−reductase activity among three groups was the greatest on the 4th day when the low and high concentration groups were 60% and 5.7% of the control group, and then restored to 88.6% and 61.2% of the control group on the 8th day, respectively. In the Yellow River Estuary (shown in Fig.5B), on the 2nd day the NO2−reductase activity in the low and high concentration groups were 81.6% and 67.2% of the control group. On the 8th day, the low and high concentration groups were 95.9% and 85.9% of the control group, respectively. Therefore, ZnO NPs inhibited the NO2−reductase activity at both stations and the higher the ZnO NPs concentration, the stronger the inhibition (<0.05). The inhibition degree of ZnO NPs on NO2−reductase activity in sediment samples in the Yangtze River Estuary was stronger than that in the Yellow River Estuary.
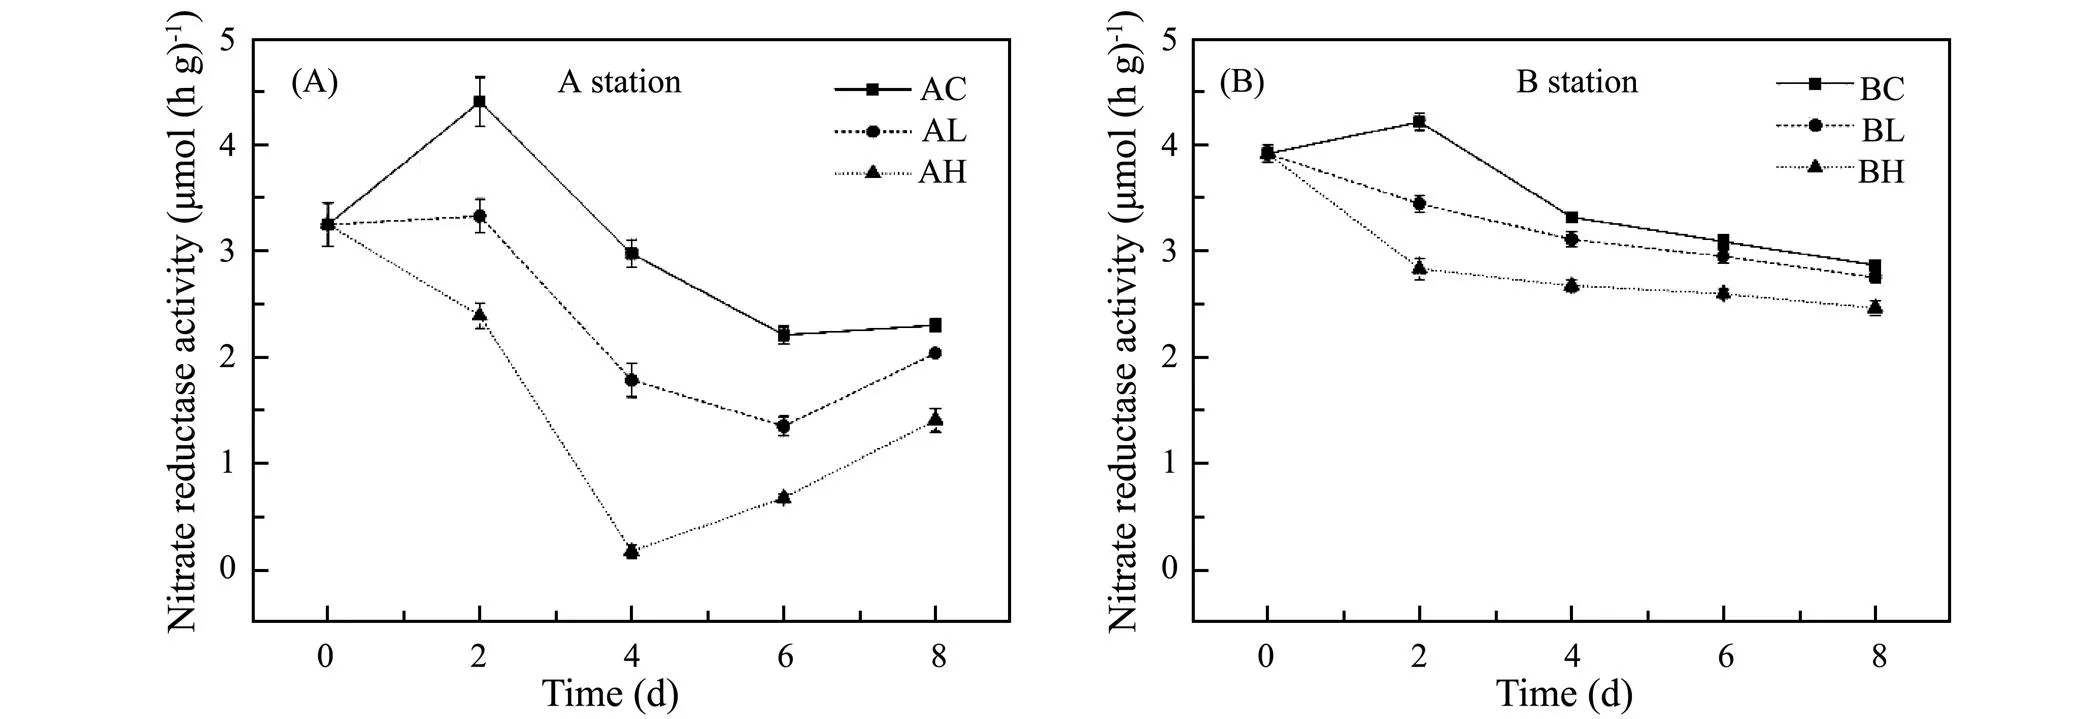
Fig.5 Variation of NO2− reductase at different ZnO NPs concentrations.
3.3 Effect of ZnO NPs on Denitrification Rate in Sediments from Different Estuaries
The variation of denitrification rate in sediments exposed to different ZnO NPs concentrations is shown in Fig.6. The magnitudes of denitrification rate in sediments at both stations were as follow: the control group > the low concentration group > the high concentration group, indicating that the denitrification rate in treatment groups were significantly inhibited (<0.05).
In the Yangtze Estuary (shown in Fig.6A), the denitrification rate of each group increased first and then decreased during incubation. On the 6th day, the control group reached the maximum value of 4.06nmol(hg)−1, which were 7.8 times of the initial value. The variation range of denitrification rate in treatment groups was significantly lower than that in control group. The maximum value of the low and high concentration groups was 1.84 nmol(hg)−1on the 6th day and 0.72nmol(hg)−1on the 8th day, respectively, which were 3.6 and 1.6 times of the initial values. Finally on the 8th day, the denitrification rate of the low and high concentration groups were 48.9% and 20.7% of the control group, respectively.
In the Yellow River Estuary (shown in Fig.6B), denitrification rates of three groups increased gradually during incubation. On the 8th day, the denitrification rate of the control group, the low and high concentration groups reached 5.20, 3.38 and 1.38nmol(hg)−1, which were 10.4, 10.3 and 4.3 times of respective initial value, and the low and high concentration were 64.8% and 26.5% of the control group. These results indicated that ZnO NPs had obvious inhibition on denitrification rate at both stations and the higher the ZnO NPs concentration, the stronger the inhibition (<0.05). According to the effect of ZnO NPs on denitrification rate in sediment samples at Station A was stronger than that at Station B, we speculated that the effect of ZnO NPs on denitrification functions in sediments from the Yangtze Estuary was more obvious than that from the Yellow River estuary.
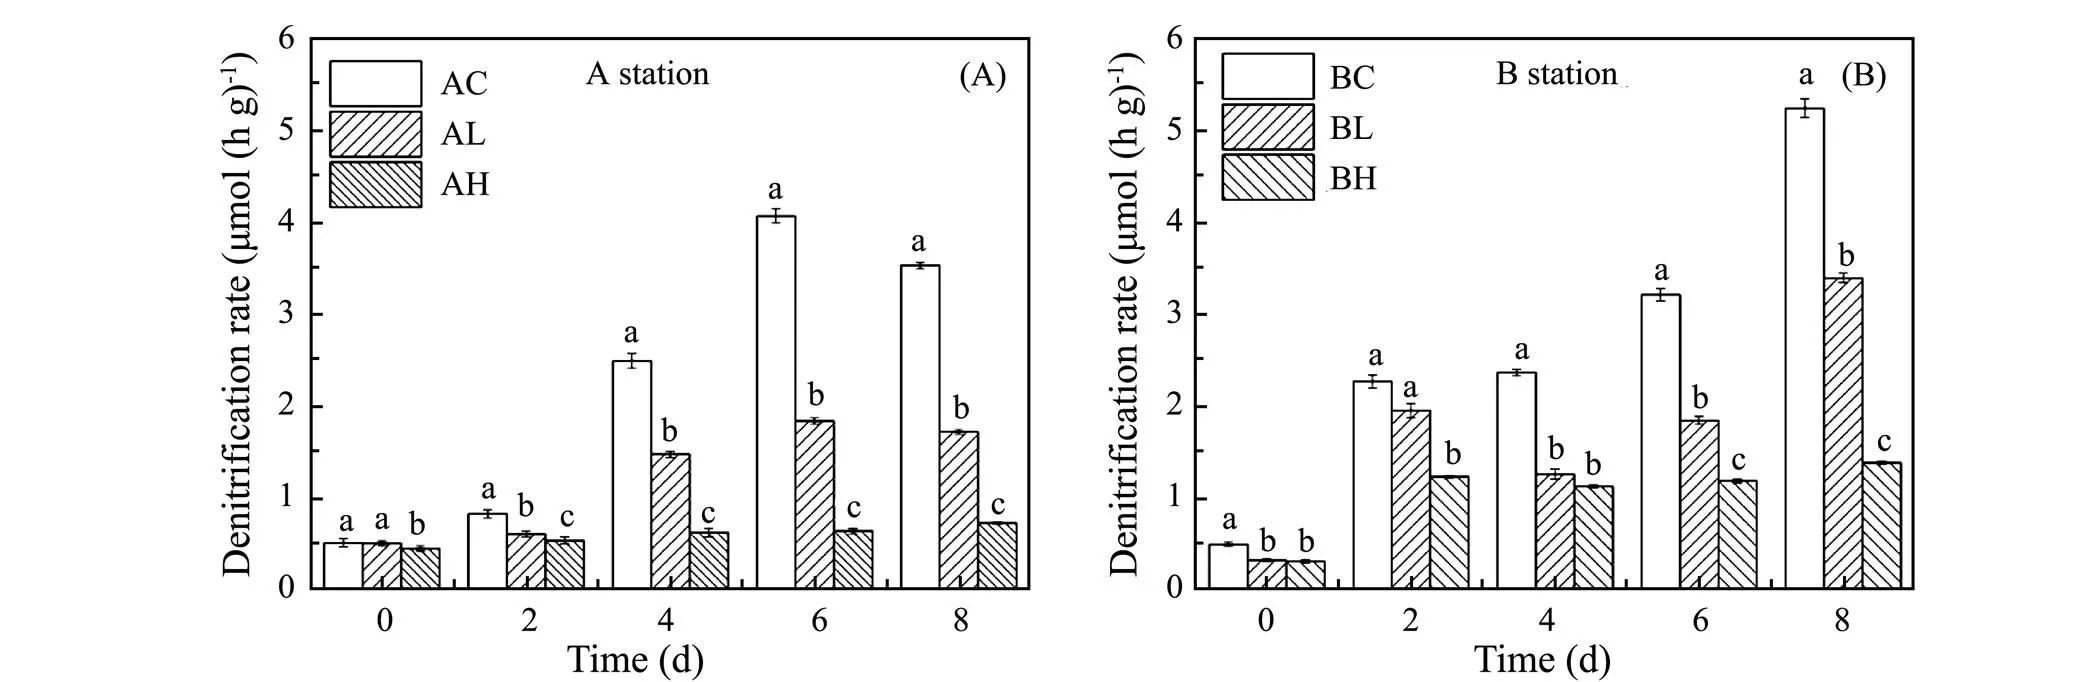
Fig.6 Variation of denitrification rate at different ZnO NPs concentrations.
3.4 Effect of ZnO NPs on nirS Gene Abundance in Sediments
gene is an important functional gene involved in microbial denitrification, and its abundance is often used to represent the gene abundance of denitrifying bacteria. As shown in Fig.7, thegene abundance increased with incubation time, and decreased with the increase of the concentration of the ZnO NPs. In the Yangtze Estuary (shown in Fig.7A), the gene abundance in control, low and high concentration groups were 2.69×10⁸, 4.36×10⁷and 1.12×10⁷copiesg−1, and the low and high concentration groups were 16.21% and 4.16% of the control group, respectively. In the Yellow River estuary (shown in Fig. 7B), the gene abundance in above groups were 6.60×10⁷, 3.75×10⁷and 5.580×10⁶copiesg−1, and the low and high concentration groups were 56.8% and 8.45% of the control group. The results indicated that ZnO NPs had a significant inhibition ongene abundance at both stations and the higher the ZnO NPs concentration, the stronger the inhibition (<0.05). Moreover, the inhibition degree of ZnO NPs ongene abundance in sediment samples in the Yangtze estuary was stronger than that in the Yellow River Estuary.
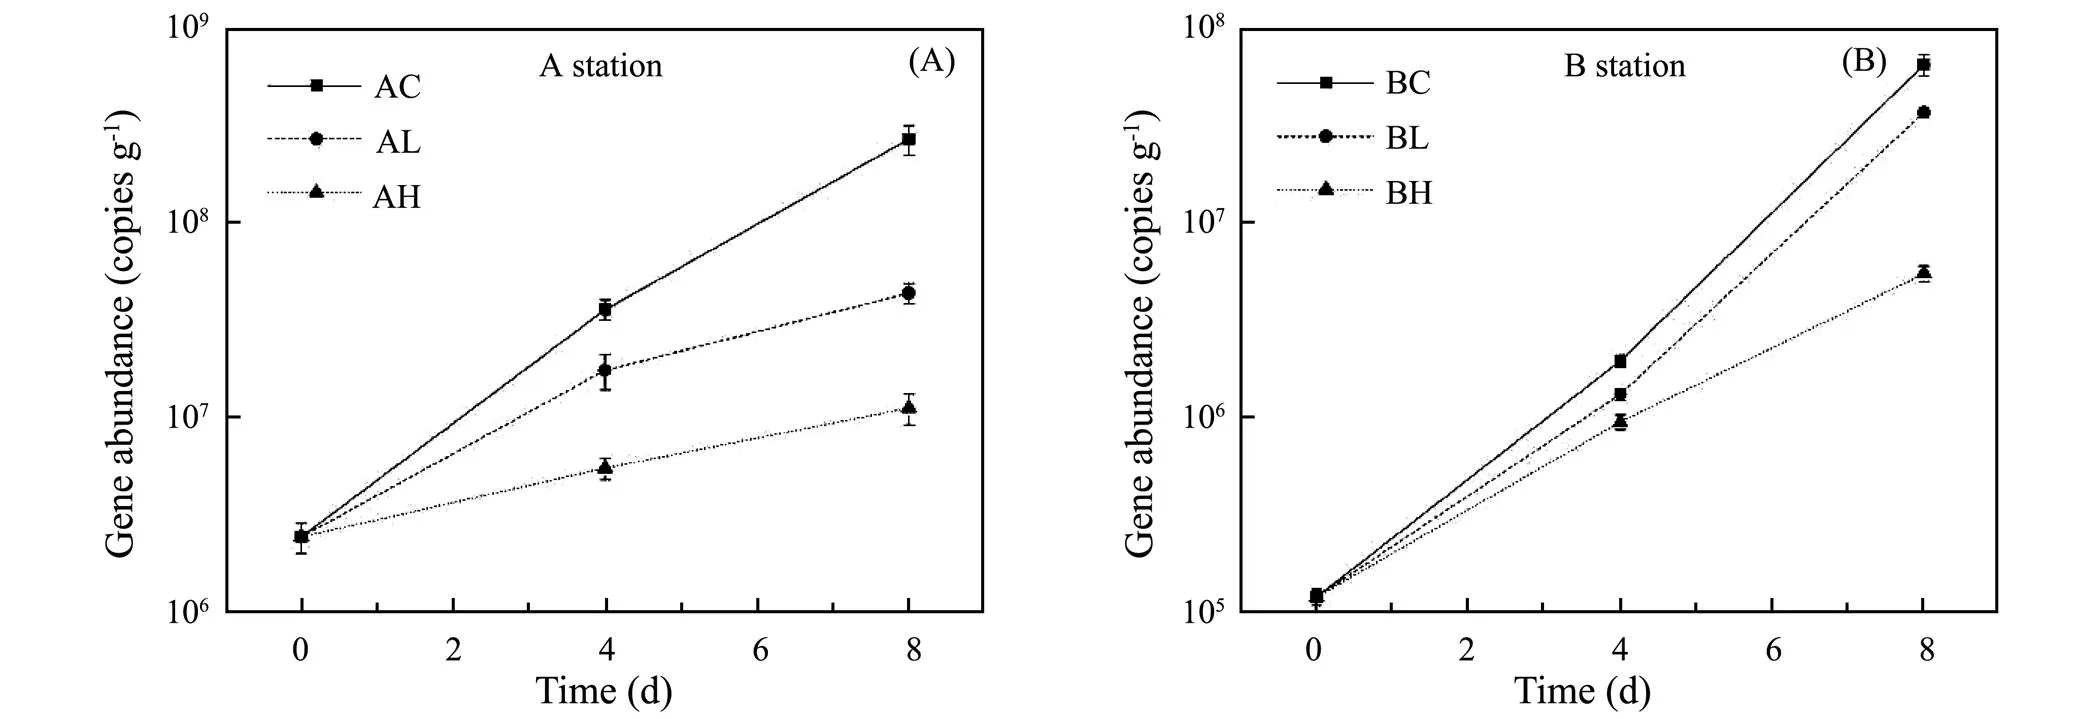
Fig.7 Variation of nirS gene abundance (based on dry weight) at different ZnO NPs concentrations.
3.5 Responses of Denitrifying Bacteria Communi- ties in Sediments to ZnO NPs
3.5.1 Effect of ZnO NPs on community diversity of denitrifying bacteria
The population diversities of denitrifying bacteria represented by thegene in sediments at two stations were analyzed. The results are shown in Table 3. The denitrifying bacteria coverages of the four groups in sedi- ments at both stations were all greater than 98%. The Shannon index and Simpson index in the control group were higher than those in high concentration group, which suggested that the diversity level of denitrifying bacteria in control group was higher than that in high concentration group, and ZnO NPs had a significant inhibition on community diversity of denitrifying bacteria in sediments.
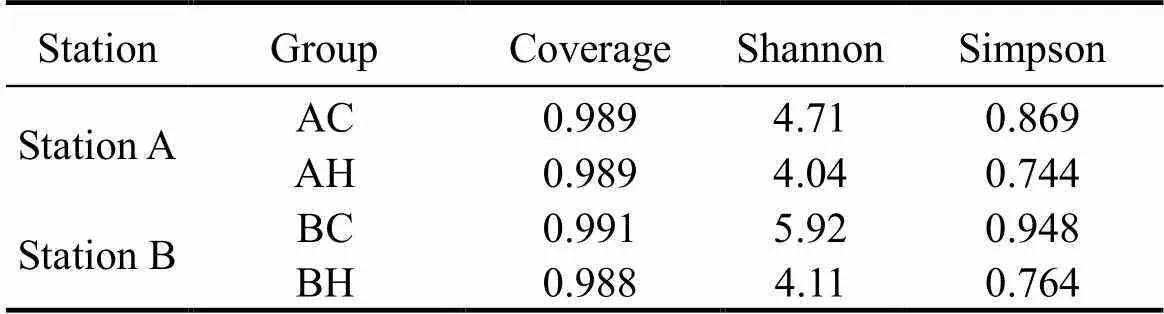
Table 3 Microbial diversity index of different samples
3.5.2 Effect of ZnO NPs on community structure of denitrifying bacteria
The changes of community structure of denitrifying bacteria exposed ZnO NPs are shown in Fig.8. Fig.8A shows that the phylum level of thegene at two stations was mainly annotated as,, Unclassified bacteria, and Chloroflexi, while the other bacteria accounted for a very small proportion. The changes of bacterial community structure at two stations were similar after the addition of ZnO NPs. Compared with the control group, the high concentration group at both stations showed an increase in the proportion ofand a decrease in the proportion of, but the change of Station A was greater than that of Station B.
Fig.8B shows that,, unidentified bacteria andwere the four most common denitrifying bacteria genus in sediments in control group at Station A, and compared with the control group, the percentage ofin high concentration group increased from 31.3% to 64.9%, while that ofdecreased from 37.9% to 2.9%. At Station B,, unidentified,and unidentified bacteria were the four most common denitrifying bacteria genus in sediments in control group, and compared with the control group, the percentage ofin high concentration group increased from 31.3% to 64.9%, while that ofdecreased from 37.9% to 2.9%.
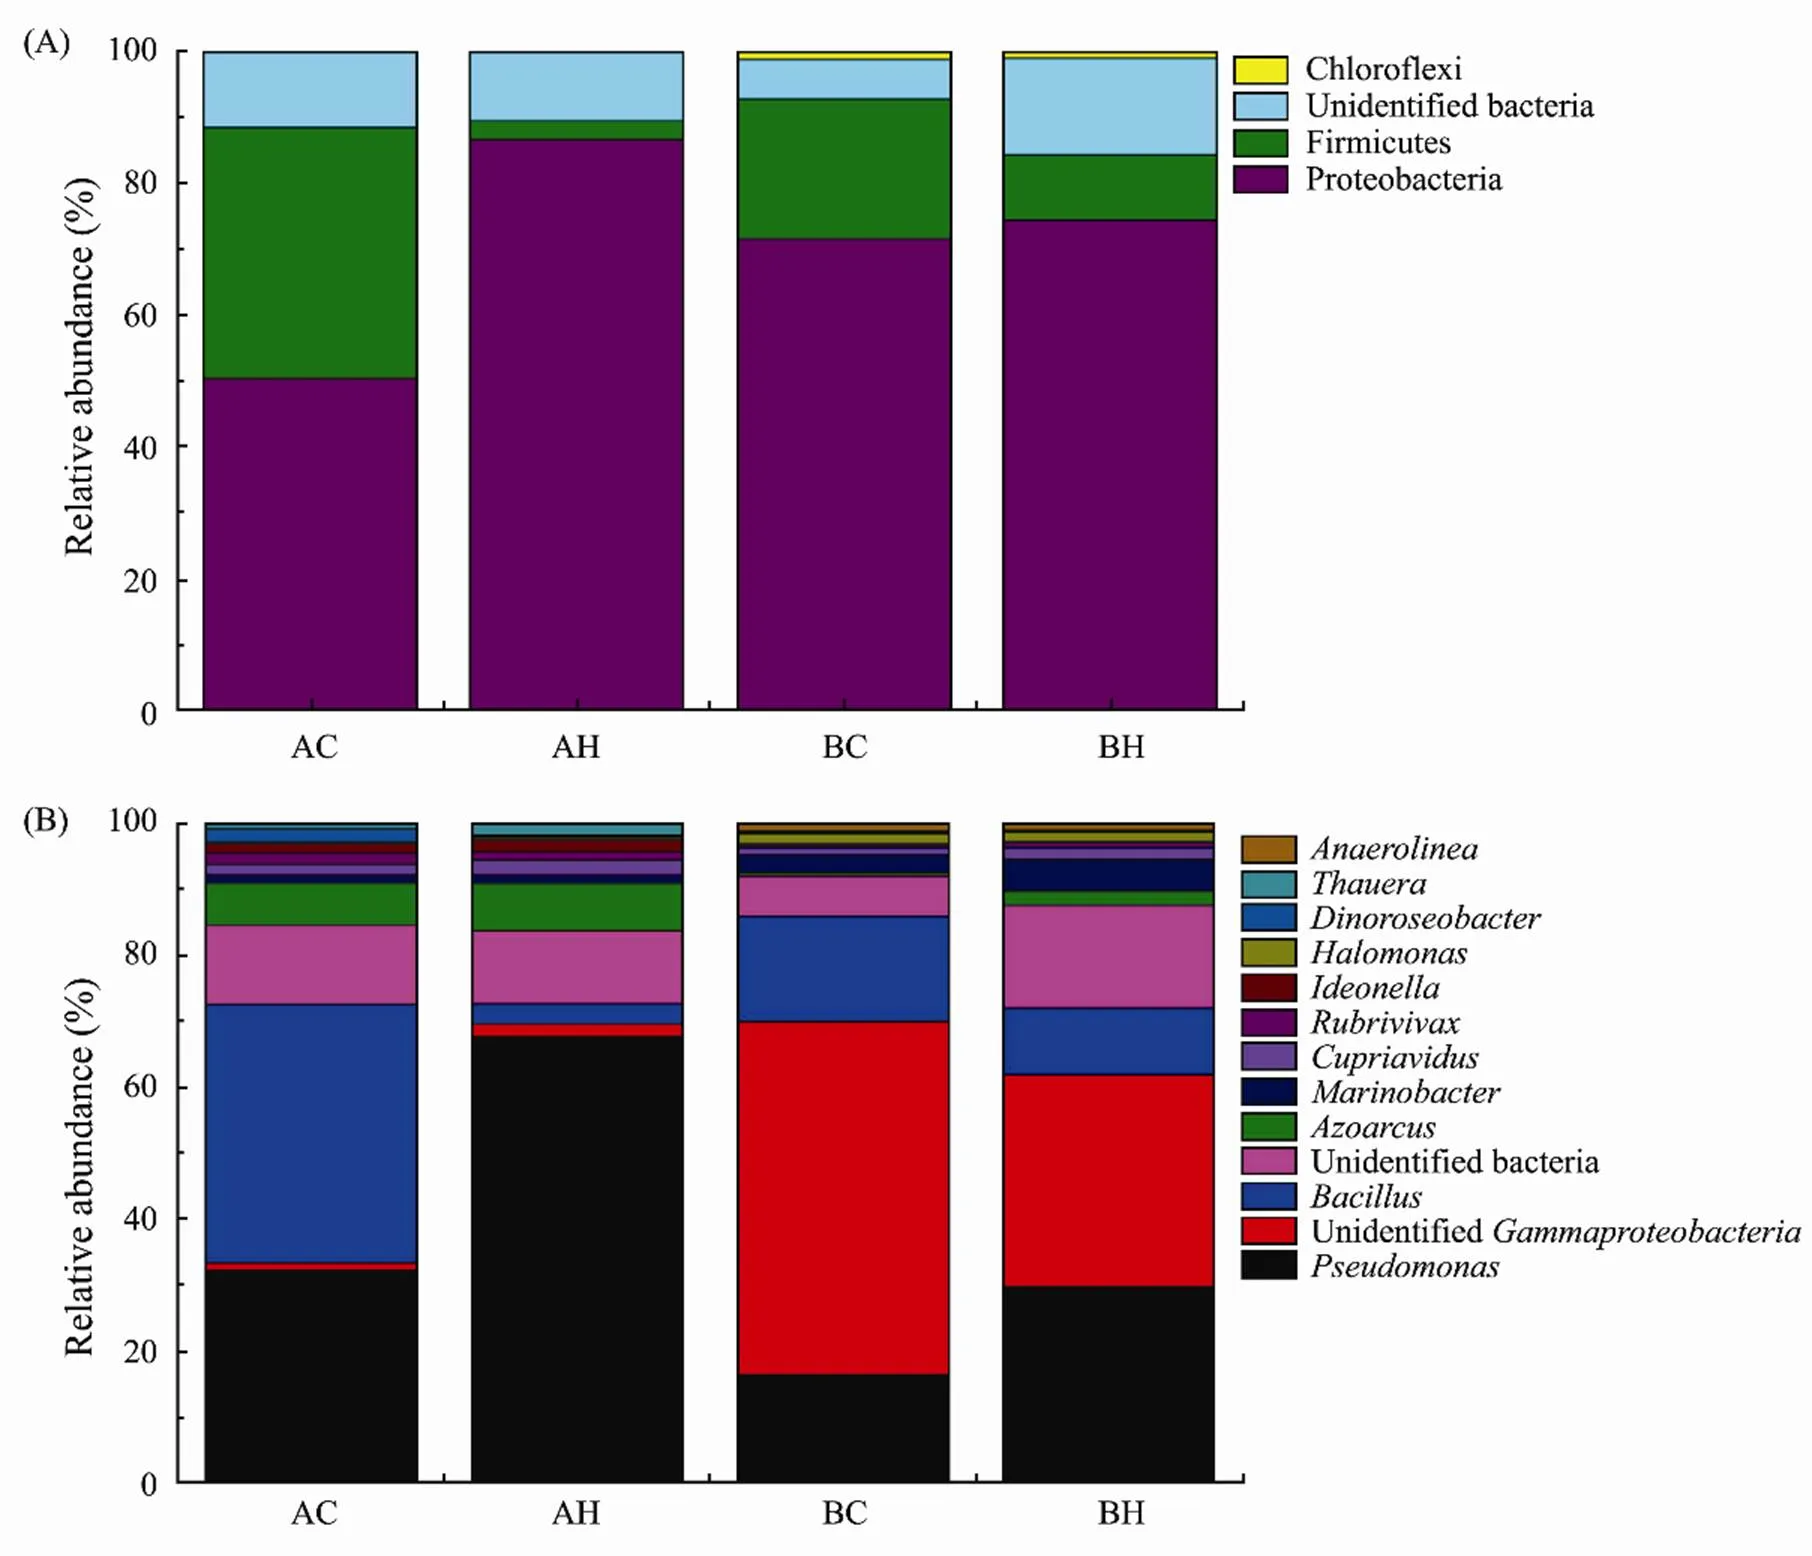
Fig.8 Distribution of denitrifying bacteria communities under the action of ZnO NPs. (A) at phylum level, (B) at genus level.
4 Discussion
4.1 Effect of ZnO NPs on Denitrification Key Process
The conversions of NO3−into NO2−and NO2−into NO are the two key processes in denitrification. In this study, ZnO NPs significantly inhibited NO3−, NO2−reduction process. Denitrifying reductases are synthesized by denitrifying bacteria and their activities can directly reflect the activities of denitrifying bacteria.The NO3−, NO2−reductase are directly involved in the NO3−, NO2−reduction process (Shi and Huang, 1999), and they were also inhibited by ZnO NPs, especially the NO2−reductase activity was more intensely inhibited. Therefore, ZnO NPs can inhibit NO3−, NO2−reductase activity to inhibit NO3−, NO2−reduction process, and the inhibition of NO3−reduction process was more strongly. A large amount of NO2−accumulated during the experiment, which may be related to the inhibition of nitrite reductase activity.
Many studies have shown that the accumulation of NO2−in the environment can cause damage to plants and animals. When the concentration of NO2−is too high in the water environment, it will cause the accumulation of NO2−in the plasma of some aquatic animals. The NO2−can convert the heme or blue blood of aquatic animals into methemoglobin and high iron serotonin, which reduces their oxygen delivery capacity and constitute damage. In addition, plant growth can be inhibited by affecting proton permeability and chloroplasts of cell membranes (Abe.,2002; Jensen, 2003). Therefore, the accumulation of NO2−caused by ZnO NPs inhibition on denitrification will also have a significant impact on material circulation capacity of marine ecosystems.
4.2 Variations of Denitrification Rate, nirS Gene Abundance and Denitrifying Bacteria Com- munities Under the Action of ZnO NPs
Denitrification rate is an indicator comprehensively reflecting denitrification intensity, which is closely related to denitrifying bacteria. The variation ofgene abundance can reflect the effect of ZnO NPs on denitrifying bacteria. In this study, after adding ZnO NPs into sediments at two stations, thegene abundance and denitrification rate were significantly inhibited. Spearman correlation analysis ofgene abundance and denitrification rate at two stations showed that there was a significant positive correlation between them, which indicated that reduction of thegene abundance is one of the key reasons for the effect of ZnO NPs on denitrification rate.
There are many genes involved in denitrification, and the reduction of NO2−to NO is considered as a marker reaction of denitrification which is different from other nitrate metabolism and an important speed-limiting step of denitrification (Braker., 1998), so the corresponding coding nitrite reductase genes such as(containing copper) and(containing heme) are often used as a representative marker for studying denitrifying community structure (Zheng., 2015). In this study,gene was used as the research object to analyze the changes of community structure and diversity of denitrifying bacteria under the stress of ZnO NPs. In terms of community composition,,and Unclassified bacteria always occupied the dominant position in sediments at two stations. Compared with the control group, the proportion ofincreased in high concentration group at both stations. Similar result was obtained by Liu. (2018), who indicated thatwas sensitive to NPs in the sediment, but(containingand) were more tolerant to NPs after short-term exposure.are the Gram-negative bacterium, widely distributed in sediments, water and air. They have more lipopolysaccharides than Gram-positive bacteria, and also have an outer membrane (Kalyani.,2008), so they have stronger resistant to pollutant thanwhich are mostly gram-positive bacteriaIn terms of community diversity, ZnO NPs reduced the level of community diversity of denitrifying bacteria in sediments at two stations, similar results have been obtained in previous studies (Miao., 2019). The level of community diversity might lead to the decline of the ability of estuarine sediments to resist disturbance and maintain ecological function.
4.3 Comparison of Ecological Effect of ZnO NPs in Two Estuaries
Due to the small size and large surface area of ZnO NPs, dissolution in water often occurs in the form of agglomerates, resulting in poor migration ability in water and easy to settle and transfer into sediments (Wiesner.,2006). As an important migration route of nanomaterials, various dissolved or suspended pollutants in the estuarine waters are more complex, and the water salinity is high, which easily lead to agglomeration and subsidence of ZnO NPs (Alinsafi.,2008).
The results indicated that ZnO NPs had significant inhibition on NO3−and NO2−reduction process, NO3−and NO2−reductase activity, denitrification rate,gene abundance and community diversity in two estuaries. As an important part of nitrogen cycle, the inhibition of denitrification by ZnO NPs may increase the eutrophication degree in the Estuary area. Based on the experimental results, it is speculated that the effects of ZnO NPs on denitrification functions in sediments from the Yangtze River Estuary were greater than those from the Yellow River Estuary, which may due to the higher salinity of seawater and smaller grain size of sediments in the Yangtze River Estuary make ZnO NPs more prone to premature agglomeration and sedimentation (Keller., 2010).
5 Conclusions
The variation of NO3−, NO2−concentration and NO3−, NO2−reductase activity assay indicated that ZnO NPs inhibited the NO3−, NO2−reduction process in sediments by inhibiting NO3−, NO2−reductase activity, and the stronger inhibition resulting from the higher ZnO NPs concentration. Denitrification rate assay and PCR sequencing indicated that ZnO NPs had significant inhibition on denitrification rate in sediments, and the decrease ofgene abundance was the key reason. ZnO NPs reduced the community diversity of denitrifying bacteria, and changed some denitrifying bacteria dominance including the increase ofand the decrease ofin sediments in two estuaries. Thus, our results provide evidence that ZnO NPs can suppress denitrification and microbial communities in sediments of estuarine area, with low concentration posing a decreased threat to denitrifiers. Future studies should be performed to investigate the effects of long-term exposure on the denitrification in the whole estuarine ecosystem.
Acknowledgements
This work was supported by the National Key Research and Development Program of China (No. 2018 YFC1407601), the Startup Foundation for Introducing Talent of NUIST, and the National Key R&D Program of China (No. 2018YFD0900805).
Abe, K., Imamaki, A., and Hirano, M., 2002. Removal of nitrate, nitrite, ammonium and phosphate ions from water by the aerial microalga., 14 (2): 129-134.
Alinsafi, A., Adouani, N., Béline, F., Lendormi, T., Limousy, L., and Sire, O., 2008. Nitrite effect on nitrous oxide emission from denitrifying activated sludge., 43 (6): 683-689.
Altabet, M. A., Higginson, M. J., and Murray, D. W., 2002. The effect of millennial-scale changes in Arabian Sea denitrification on atmospheric CO2., 415 (6868): 159-162.
Bao, S., Wang, H., Zhang, W., Xie, Z., and Fang, T., 2016. An investigation into the effects of silver nanoparticles on natural microbial communities in two freshwater sediments., 219: 696-704.
Braker, G., Fesefeldt, A., and Witzel, K. P., 1998. Development of PCR primer systems for amplification of nitrite reductase genes (and) to detect denitrifying bacteria in environmental samples., 64 (10): 3769-3775.
Brayner, R., Ferrari-Iliou, R., Brivois, N., Djediat, S., Benedetti, M. F., and Fiévet, F., 2006. Toxicological impact studies based onbacteria in ultrafine ZnO nanoparticles colloidal medium., 6 (4): 866-870.
Chen, Y., Su, Y., Zheng, X., Chen, H., and Yang, H., 2012. Alumina nanoparticles-induced effects on wastewater nitrogen and phosphorus removal after short-term and long-term exposure., 46 (14): 4379-4386.
Jensen, F. B., 2003. Nitrite disrupts multiple physiological functions in aquatic animal.–, 135 (1): 9-24.
Jiang, H. S., Yin, L., Ren, N. N., Xian, L., Zhao, S., Li, W., and Gontero, B., 2017. The effect of chronic silver nanoparticles on aquatic system in microcosms., 223: 395-402.
Kalyani, D. C., Patil, P. S., Jadhav, J. P., and Govindwar, S. P., 2008. Biodegradation of reactive textile dye Red BLI by an isolated bacteriumsp. SUK1., 99 (11): 4635-4641.
Keller, A. A., Wang, H., Zhou, D., Lenihan, H. S., Cherr, G., Cardinate, B. J., Miller, R., and Ji, Z., 2010. Stability and aggregation of metal oxide nanoparticles in natural aqueous matrices., 44 (6): 1962- 1967.
Kumar, R., Umar, A., Kumar, G., and Nalwa, H. S., 2017. Antimicrobial properties of ZnO nanomaterials: A review. C, 43 (5): 3940-3961.
Liu, S. Q., Wang, C., Hou, J., Wang, P. F., and Miao, L. Z., 2020. Effects of ag NPs on denitrification in suspended sedimentsinhibiting microbial electron behaviors., 171: 115436.
Liu, S. Q., Wang, C., Hou, J., Wang, P. F., and Miao, L. Z., Fan, X. L., You, G. X., and Xu, Y., 2018. Effects of Ag and Ag2S nanoparticles on denitrification in sediments., 137: 28-36.
Miao, L. Z., Wang, P. F., Hou, J., Yao, Y., Liu, Z. L., and Liu, S., 2019. Low concentrations of copper oxide nanoparticles alter microbial community structure and function of sediment biofilms., 653: 705-713.
Nogales, B., Timmis, K. N., Nedwell, D. B., and Osborn, A. M., 2002. Detection and diversity of expressed denitrification genes in estuarine sediments after reverse transcription-PCR amplification from mRNA., 68 (10): 5017-5025.
Shannon, C. E., 1948. A mathematical theory of communication., 27 (3): 623-656.
Shi, Y., and Huang, G. H., 1999. Relationship between denitrifying enzyme activity and N2O emission in soil., 10 (3): 329-331.
Simpson, E. H., 1972. Measurement of diversity., 27 (2): 261.
Sirelkhatim, A., Mahmud, S., Seeni, A., Kaus, N. H. M., Ann, L. C., Bakhori, S. K. M., Hasan, H., and Mohamad, D., 2015. Review on zinc oxide nanoparticles: Antibacterial activity and toxicity mechanism., 7 (3): 219-242.
Throbäck, I. N., Enwall, K., Jarvis, A., and Hallin, S., 2004. Reassessing PCR primers targeting,andgenes for community surveys of denitrifying bacteria with DGGE., 49 (3): 401-417.
Wan, R., Chen, Y., Zheng, X., Su, Y., and Huang, H., 2018. Effect of CO2on NADH production of denitrifying microbesinhibiting carbon source transport and its metabolism., 627: 896-904.
Wan, R., Chen, Y., Zheng, X., Su, Y., and Li, M., 2016. Effect of CO2on microbial denitrificationinhibiting electron tran- sport and consumption., 50 (18): 9915-9922.
Wang, C., Liu, S. Q., Hou, J., Wang, P. F., Miao, L. Z., and Li, T. F., 2020. Effects of silver nanoparticles on coupled nitrification-denitrification in suspended sediments., 389: 122130.
Wang, C., Liu, S. Q., Hou, J., Wang, P. F., Miao, L. Z., and Li, T. F., 2020. Effects of silver nanoparticles on coupled nitrification-denitrification in suspended sediments., 389: 122130.
Warneke, S., Schipper, L. A., Matiasek, M. G., Scow, K. M., Cameron, S., Bruesewitz, D. A., and McDonald, I. R., 2011. Nitrate removal, communities of denitriners and adverse effects in different carbon substrates for use in denitrification beds., 45 (17): 5463-5475.
Wiesner, A. D., Katz, L. E., and Chen, C. C., 2006. The impact of ionic strength and background electrolyte on pH measurements in metal ion adsorption experiments., 301 (1): 329-332.
Zheng, X., Su, Y., Chen, Y., Wan, R., Liu, R., Li, M., and Yin, D. Q., 2014. Zinc oxide nanoparticles cause inhibition of microbial denitrification by affecting transcriptional regulation and enzyme activity., 48 (23): 13800-13807.
Zheng, X., Wu, R., and Chen, Y., 2011. Effects of ZnO nanoparticles on wastewater biological nitrogen and phosphorus removal., 45 (7): 2826- 2832.
Zhong, J. C., Liu, G. F., Fan, C. X., Bai, X. L., Li, B., Zhang, L., and Ding, S. M., 2009. Environmental effects of lake sediment dredging: III Effects on sediment denitrification., 21 (4): 465-473 (in Chinese with English abstract).
January 24, 2020;
December 22, 2020;
December 30, 2020
© Ocean University of China, Science Press and Springer-Verlag GmbH Germany 2021
E-mail:huangxiao901231@126.com E-mail: baijie@ouc.edu.cn
(Edited by Ji Dechun)
杂志排行

Journal of Ocean University of China的其它文章
- Case Study of a Short-Term Wave Energy Forecasting Scheme:North Indian Ocean
- Temporal and Spatial Characteristics of Wave Energy Resources in Sri Lankan Waters over the Past 30 Years
- Vibration Deformation Monitoring of Offshore Wind Turbines Based on GBIR
- Dependence of Estimating Whitecap Coverage on Currents and Swells
- The Variation of Microbial (Methanotroph) Communities in Marine Sediments Due to Aerobic Oxidation of Hydrocarbons
- 3-Aminopropyltriethoxysilane Complexation with Iron Ion Modified Anode in Marine Sediment Microbial Fuel Cells with Enhanced Electrochemical Performance