Risk Assessment of Marine Environments Along the South China Sea and North Indian Ocean on the Basis of a Weighted Bayesian Network
2021-06-25LIMingZHANGRenandLIUKefeng
LI Ming, ZHANG Ren, 2), *, and LIU Kefeng
Risk Assessment of Marine Environments Along the South China Sea and North Indian Ocean on the Basis of a Weighted Bayesian Network
LI Ming1), ZHANG Ren1), 2), *, and LIU Kefeng1)
1) College of Meteorology and Oceanography, National University of Defense Technology, Nanjing 211101, China 2) Collaborative Innovation Center on Meteorological Disaster Forecast, Warning and Assessment, Nanjing University of Information Science and Engineering, Nanjing 210044, China
Marine environments have a considerable influence on the construction of the Chinese 21st Century Maritime Silk Road. Thus, an objective and quantitative risk assessment of marine environments has become a key problem that must be solved urgently. To deal with the uncertainty in marine environmental risks caused by complex factors and fuzzy mechanisms, a new assessment technique based on a weighted Bayesian network (BN) is proposed. Through risk factor analysis, node selection, structure construction, and parameter learning, we apply the proposed weighted BN-based assessment model for the risk assessment and zonation of marine environments along the Maritime Silk Road. Results show that the model effectively fuses multisource and uncertain environmental information and provides reasonable risk assessment results, thereby offering technical support for risk prevention and disaster mitigation along the Maritime Silk Road.
marine environment; risk assessment; Bayesian network
1 Introduction
The 21st Century Maritime Silk Road initiative is a new cooperation mechanism proposed by China to expand marine development space, promote trade development, and strengthen political cooperation. However, sea areas along the Maritime Silk Road are wide, and the marine environment is complex. Frequent marine disasters pose severe security challenges to the development and utilization of the ocean. To prevent the adverse effects of marine environments on the construction of the Maritime Silk Road, a scientific assessment of marine environmental risk has become a problem that must be studied urgently.
Marine environments are influenced by numerous oceanic and meteorological factors, which have a complex set of relationships between each other; thus, the risk assessment of marine environments is a systems engineering. Research on marine environmental risk assessment, specifically for the Maritime Silk Road, is limited. Zheng(Zheng and Li, 2015; Zheng and Sun, 2016; Zheng, 2017) statistically analyzed the geographical profile and climatic and hydrological characteristics of the sea areas along the Maritime Silk Road. Yang and Zhang (2016) applied a cloud model to assess and rank marine environment risk quantitatively. Qi and Cai (2017) evaluated the impact of climate change on the construction of the Maritime Silk Road and focused on the cyclonic disasters of the tropics.
By contrast, studies on marine disaster assessment and advance warning abound. In foreign countries, the comprehensive risk of multiple marine disasters is a commonly studied topic. Dubois (2012) designed an integrated risk analysis frame of multiple marine disasters in coastal areas, including unit division, identification of disaster-causing factors, and vulnerability and risk assessments of disaster losses. The Earth System Science Partnership started integrated risk governance to analyze internal relations between marine disasters and climate change at different spatial-temporal scales (Khatsü and Westen, 2011). The Federal Emergency Administration of the USA developed a natural hazard loss estimation software (, HAZUS-MH) to evaluate and predict the risk losses caused by storm surges, sea waves, and typhoons.
Local research on the risk assessment of marine disasters is lagging in comparison with foreign studies. Li and Luo (2006) used the analytical hierarchy process (AHP) to establish a disaster assessment model for tropical cyclones and evaluate the risk losses. Wen and Zhao (2007) established an evaluation system by analyzing risk-causing factors and risk-on bodies to develop a red tide risk assessment model. Zhao and Xu (2007) summarized the research progress of storm surge disaster assessment and conducted a risk assessment from the aspects of natural environment and humanistic society. The above studies on marine environmental risk are restricted to a single type of marine disaster, such as sea wave, red tide, and storm surge. A few studies on integrated and systematic risk assessment have been conducted. Ye(2005) analyzed the temporal-spatial characteristics of marine and meteorological factors and discussed the comprehensive risk management system of marine disasters. Zhang (2012) ex- plained marine environment features in the South China Sea from the perspectives of marine geography, marine meteorology, and marine hydrology and conducted a hazard analysis of disaster-causing factors. Yang and Li (2013) studied the vulnerability of marine disaster-on bodies and established a vulnerability assessment system from the aspects of nature, society, and economics. Feng and Liu (2017) introduced some intelligent algorithms to predict the economic losses and the number of people affected by extreme marine environments.
Marine environmental risk along the 21st Century Maritime Silk Road has many evaluation indicators, and environmental data are random and fuzzy. In addition, the relationships among indicators are nonlinear, thus resulting in great uncertainty in marine environmental risk. In the above local and foreign studies, the main risk assessment methods include AHP, risk function models, neural networks (NNs), gray comprehensive evaluation (GCE), and fuzzy comprehensive evaluation (FCE). The subjective assessment based on expert knowledge is incapable of obtaining scientific and reasonable results. The analytical function is a linear model, which is only suitable for modeling with small-scale evaluation indicators, and the analytical function has strict mathematical assumptions that cannot adapt to nonlinear relationships in marine environments. NNs have great advantages in nonlinear system modeling but fail to process uncertain information. FCE and GCE can only deal with one kind of uncertainty, such as randomness or fuzziness, and dealing with all uncertainties comprehensively is difficult. The existing assessment models hardly process uncertain information and are incapable of achieving risk assessment with multisource indicators. Therefore, developing new risk assessment methods propitious to the marine environment would be impressive.
Bayesian Networks (BNs) are an emerging artificial intelligence algorithm that shows great advantage in the expression of uncertain knowledge and the reasoning of complex relationships. Hopefully, the application of BNs in risk assessment becomes an inevitable development trend. Some studies have applied BNs in assessment with nonlinear uncertain problems. Aguilera(2010) adopt- ed clustering analysis to grade indicators and applied BN for groundwater quality evaluation. Zhang (2015) applied the BN for the risk assessment of ship collision and ship oil spills. Boutkhamouin(2017) used the BN to identify causal relationships between evaluation indicators and targets and studied the risk assessment of floods. Li(2018a) introduced the BN for the hazard evaluation and management of storm surge. However, to the best of our knowledge, only a few studies have used BN for marine environmental risk assessment.
According to the characteristics of marine environments, we adopt an improved BN,, weighted BN, to evaluate the marine environmental risk of the 21st Century Maritime Silk Road. Through the identification of risk-causing factors, selection of network nodes, network structural learning, node parameter learning, and probabilistic reasoning, a new weighted BN-based risk assessment model is designed with expert knowledge and objective data; this model can deal with uncertainties in marine environments and achieve probabilistic risk assessment. The remainder of the paper is organized as follows: Section 2 presents the basic theory of BN. Section 3 introduces the specific techniques of the weighted BN-based model. The obtained results and analyses are provided in Section 4. Section 5 concludes the study and sum- marizes the major findings.
2 Bayesian Network and Its Applicability
In this section, we first analyze characteristics of marineenvironments and explain the essence of marine environmental risk assessment and the applicability of BN. Then, we introduce BN theory and the weighted BN model.
2.1 Marine Environmental Risk Analysis
The marine environment along the Chinese 21st Century Maritime Silk Road is a coupled system with a hierarchical structure, various factors, and a fuzzy mechanism. Marine environmental factors are multisource and transient Therefore, the relationships between marine environmental risk and factors are nonlinear and fuzzy.
On the physical plane, marine environmental risk is the presence of the interactions of geographical, meteorological, and hydrological factors; on the mathematical plane, it is the comprehensive expression of multisource information about various indicators. In this study, we define the connotation of risk assessment as the fusion and inference of marine environmental factors. We have explained that environment information is characterized by multidimensionality, randomness, and fuzziness. Therefore, risk assessment is essentially the expression, fusion, and reasoning of multisource uncertain environmental information.
Existing assessment methods hardly process uncertain information. With the recent rapid development of artificial intelligence, an increasing number of machine and deep learning algorithms have been applied to deal with complex uncertainties and nonlinear modeling problems. BN, a promising uncertain knowledge expression and reasoning technology, is well suited for the risk assessment of marine environments along the Maritime Silk Road.
2.2 Bayesian Network
BNs, whose theoretical bases are graph theory and probability theory, are not only a graphical expression of causal relationships among variables but also a probabilisticreasoningtechniqueforrandomvariables(Pearl,1995). It can be represented by a binary=<,>.
=(,) represents a directed acyclic graph.is a set of nodes where each one represents a variable in the problem domain.is a set of arcs, and a directed arc represents the causal dependency between variables.
is the network parameter, that is, the conditional prob- ability distribution (CPT) of nodes.expresses the degree of mutual influence between nodes and presents quantitative characteristics in the knowledge domain.
Assume a set of variables=(1, ···,v). The mathematical basis of BN is the Bayes theorem (Eq. (1)), which is also the core of Bayesian inference.

where P(v) is the prior probability, P(v|v) is the conditional probability, and P(v|v) is the posterior probability. On the basis of P(v), P(v|v) can be derived with the Bayes theorem under relevant conditions P(v|v) .
Bayesian inference can be achieved by Eq. (2), which is derived from Eq. (1) under the conditional independence assumption (CIA), that is, each child node is independent of nonparent nodes under given conditions.

wherevis the network node, Pa(v) is the parent node ofv, and P(1,2,···,v) is the joint probability distribution. Bayesian inference is the calculation of the probability distribution of a set of query variables in accordance with evidences of input variables.
BNs are based on the so-called Bayes theorem with CIA, which improves the running efficiency of BNs (Li and Liu, 2019; Li, 2020). However, marine environment variables are interrelated. CIA is rarely true in the application of BNs in marine environmental risk assessment because factors are commonly correlated with each other.
A major way to deal with the problem is node weighting. The resulting model is called the weighted BN (Wu, 2013), which incorporates node weights into CPT, as shown in Eq. (3).

where c is the parent node ofvi, and wi is the weight of the node vi. can be regarded as the weighted CPT. Fig.1 shows the visual difference between weighted BN and BN. The weighted BN assigns different weights to different nodes, and weights enforce nodes to play different roles in probabilistic reasoning. It relaxes the CIA and is still effective for modeling with strong related variables. Therefore, we adopt the weighted BN for risk assessment modeling.
3 Weighted BN-Based Risk Assessment Model
In modeling with BN, causal relationships behind data are identified by data analysis to build a mathematical network whose structure and probability distributions are close to reality. The modeling process mainly includes two aspects: 1) selecting nodes to build a network structure and 2) determining the probability distributions of network nodes. According to Li(2018b), the three major modeling methods are as follows:
1) Subjective manual construction
On the basis of expert knowledge, the causal relationships among nodes are determined, and the probability distributions are subjectively assigned to the nodes in the network.
This modeling method is simple and clear but subjective.
2) Objective automatic construction
The network structure and node parameters are trained from large datasets by mathematical statistics methods.
This modeling method avoids subjective experience, but the technical limitation of the statistical model makes the rationality of the network questionable and ignores the knowledge fusion ability of the BN.
3) Combination construction
Expert knowledge and objective data are combined to build and optimize the network structure and conditional probability distribution.
This modeling method is widely recognized as an effective way to optimize the BN continuously on the basis of the fusion of subjective and objective information (Wang, 2007).
Considering the uncertainty and complexity of marine environmental risk, we combine expert knowledge and ob- jective data to construct the weighted BN model for marine environmental risk assessment. The modeling process includes node selection, data process, structural learning, weighted parameter learning, and probabilistic reasoning. Fig.2 shows the technical route.
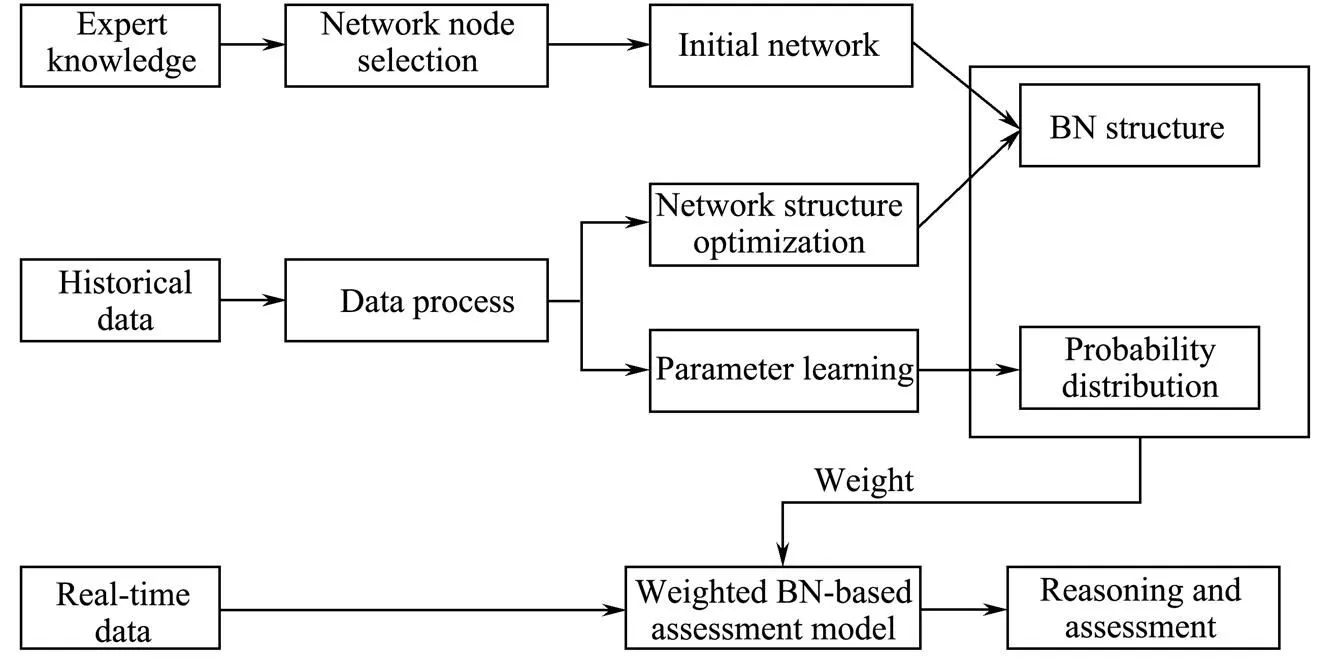
Fig.2 Technical route of the weighted BN.
First, appropriate influencing factors of marine environments are selected as network nodes. Then, data of factors are discretized to determine the states of nodes. Next, the influence relationships among nodes are determined on the basis of expert knowledge, and conditional probability distributions are calculated from historical data, and the probability distributions are weighted. Lastly, the weighted BN is completed, and probabilistic reasoning is conducted by inputting factor information to obtain the results of the risk assessment. In the next section, we apply the weighted BN model for the risk assessment of marine environments along the Maritime Silk Road.
4 Risk Assessment and Zonation of Marine Environments
Supported by China’s coastal economic belt, the 21st Century Maritime Silk Road connects China with Asia, Europe, and Africa through seas and is divided into the northern, southern, and western routes. The western route is the most important route; it passes through South Asia, West Asia, and East Africa through the Strait of Malacca from the South China Sea, covering the South China Sea and the Indian Ocean. In this section, we conduct the marine environmental risk assessment of the South China Sea and the Indian Ocean (15˚S–30˚N, 30˚–135˚E) along the Maritime Silk Road, as shown in Fig.3. The assessment modeling is conducted with the FULL_BNT toolbox in MATLAB.
4.1 Marine Environmental Risk Identification
Based on the risk formation mechanism (Li, 2012), we identify the marine environmental risk through the analysis of geographical, meteorological, and hydrological characteristics to define the environment of risk source, risk factors, risk-on objects, and risk consequences clearly. The results of risk identification are shown in Table 1.
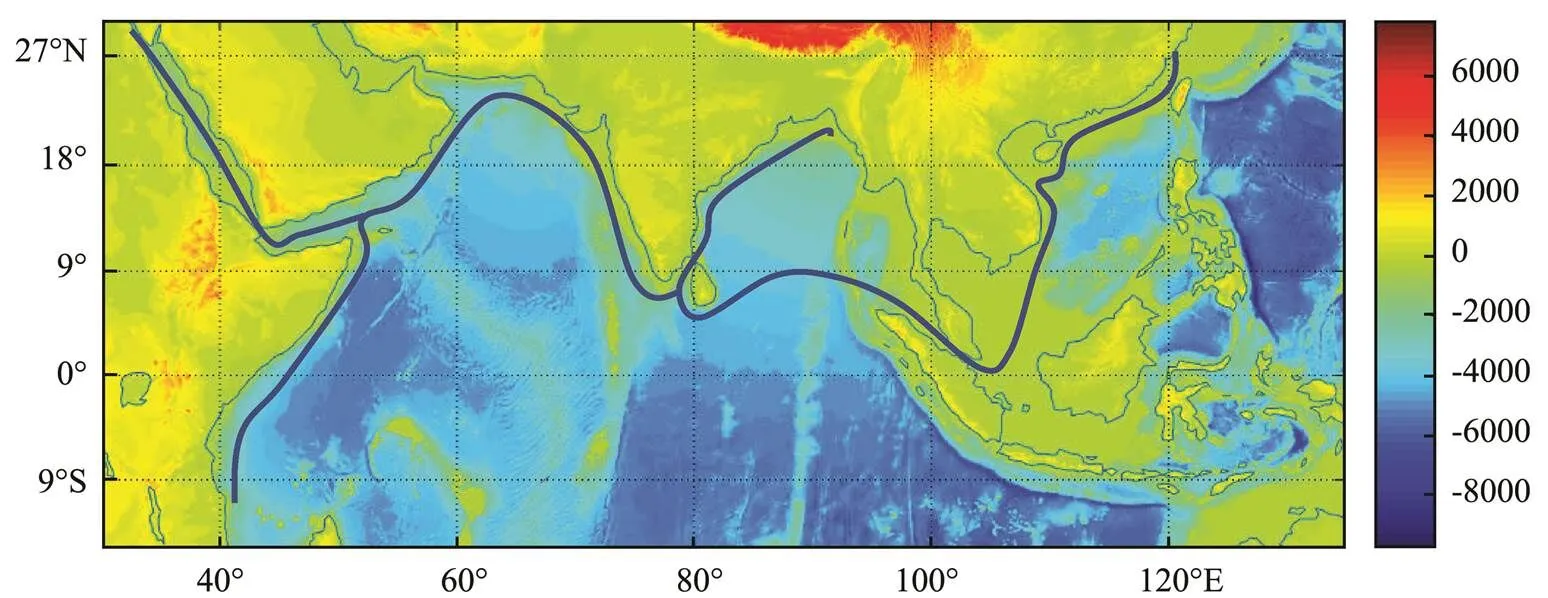
Fig.3 Research area of the marine environmental risk assessment. The shading represents elevation, and the solid line represents the western route of the Marine Silk Road.

Table 1 Risk identification of marine environment
On the basis of risk identification, meteorological and oceanic factors that pose potential threats to ship navigation, infrastructure, and personnel safety are extracted to establish the risk assessment system. Considering the complexity of network structure, we select six representative assessment indicators by consulting previous studies (Fang, 2007; Li, 2012). These indicators have a remarkable effect on maritime activities; that is, wind speed, wave height, flow velocity, and visibility pose a serious threat to navigation safety. Wave height and sea surface height can bring harm to coastal constructions. Sea surface temperature may cause the malfunction of devices in ships. The instruction of indicators and data sources are described in Table 2.

Table 2 Assessment indicator and data source
4.2 Data Process
Each indicator has different spatial and temporal resolutions. To facilitate BN modeling, visualization, and comparative analysis of results, regular data processing is first conducted. Data of each indicator from 1990 to 2014 are read, and the bilinear interpolation method (Zhou and Jing, 2004; Zheng, 2013) is used to interpolate the data to the regular latitude–longitude grid of 0.25˚×0.25˚ to unify the resolution. Then, the monthly mean values of each indicator for 25 years are respectively calculated to generate multiyear monthly mean data ([421×183]×12months×6indicators).
BN is suitable for modeling with discrete data, but the indicator data are all continuous; thus, the data need to be discretized before BN learning to determine the level of each indicator, namely, the states taken by network nodes. The traditional discrete method is equal to interval division, which is a rigid division that does not consider the fuzziness and randomness of indicators. The Cloud model, which is based on probability theory and fuzzy mathematics, have advantages in uncertain knowledge representation. The adaptive Gaussian cloud transform algorithm (AGCT, theory introduction is presented in the Appendix) is adopt- ed to discretize indicator data (Liu, 2015). The specific steps of the AGCT algorithm are presented in Table 3.

Table 3 AGCT algorithm flow
On the basis of the regular monthly mean data, the cloud generator of each indicator is designed by the AGCT algorithm and is used for discretizing data automatically. Wind speed, wave height, and sea surface height anomaly are divided into three states (, level). Flow velocity, sea surface temperature, and visibility are divided into two states. Fig.4 shows the standard cloud map of indicator level after indicator division; the discrete expression of indicators is shown in Table 4, where the higher the value of discretization is, the higher the risk level is.
InFig.4,eachcloudrepresentsalevel.Theoriginalvalue of one indicator is input into the corresponding cloud model, and the degree of membership of each level can be output. Then, data can be discretized in accordance with the max-subjection principle. Lastly, the discrete data ([421×183]×12) of each indicator used for BN learning are obtained, as shown in Table 5.
4.3 Weighted BN Learning
The learning process includes structure construction and parameter learning. To construct the network structure is to determine child nodes, parent nodes, and the structural arcs between them. The indicators are selected as the child nodes, and the parent node is the evaluation target–marine environmental risk, which is denoted as, whose node states are {low risk, medium risk, high risk}. Risk assessment discusses the effect of assessment indicators on the marine environment; thus, the causal relationships between the parent node and child nodes are established in accordance with expert knowledge:
Then, the two-layer BN structure is manually built, as shown in Fig.5. With information of environmental variables, the results can be obtained by probabilistic reasoning with the network structure.
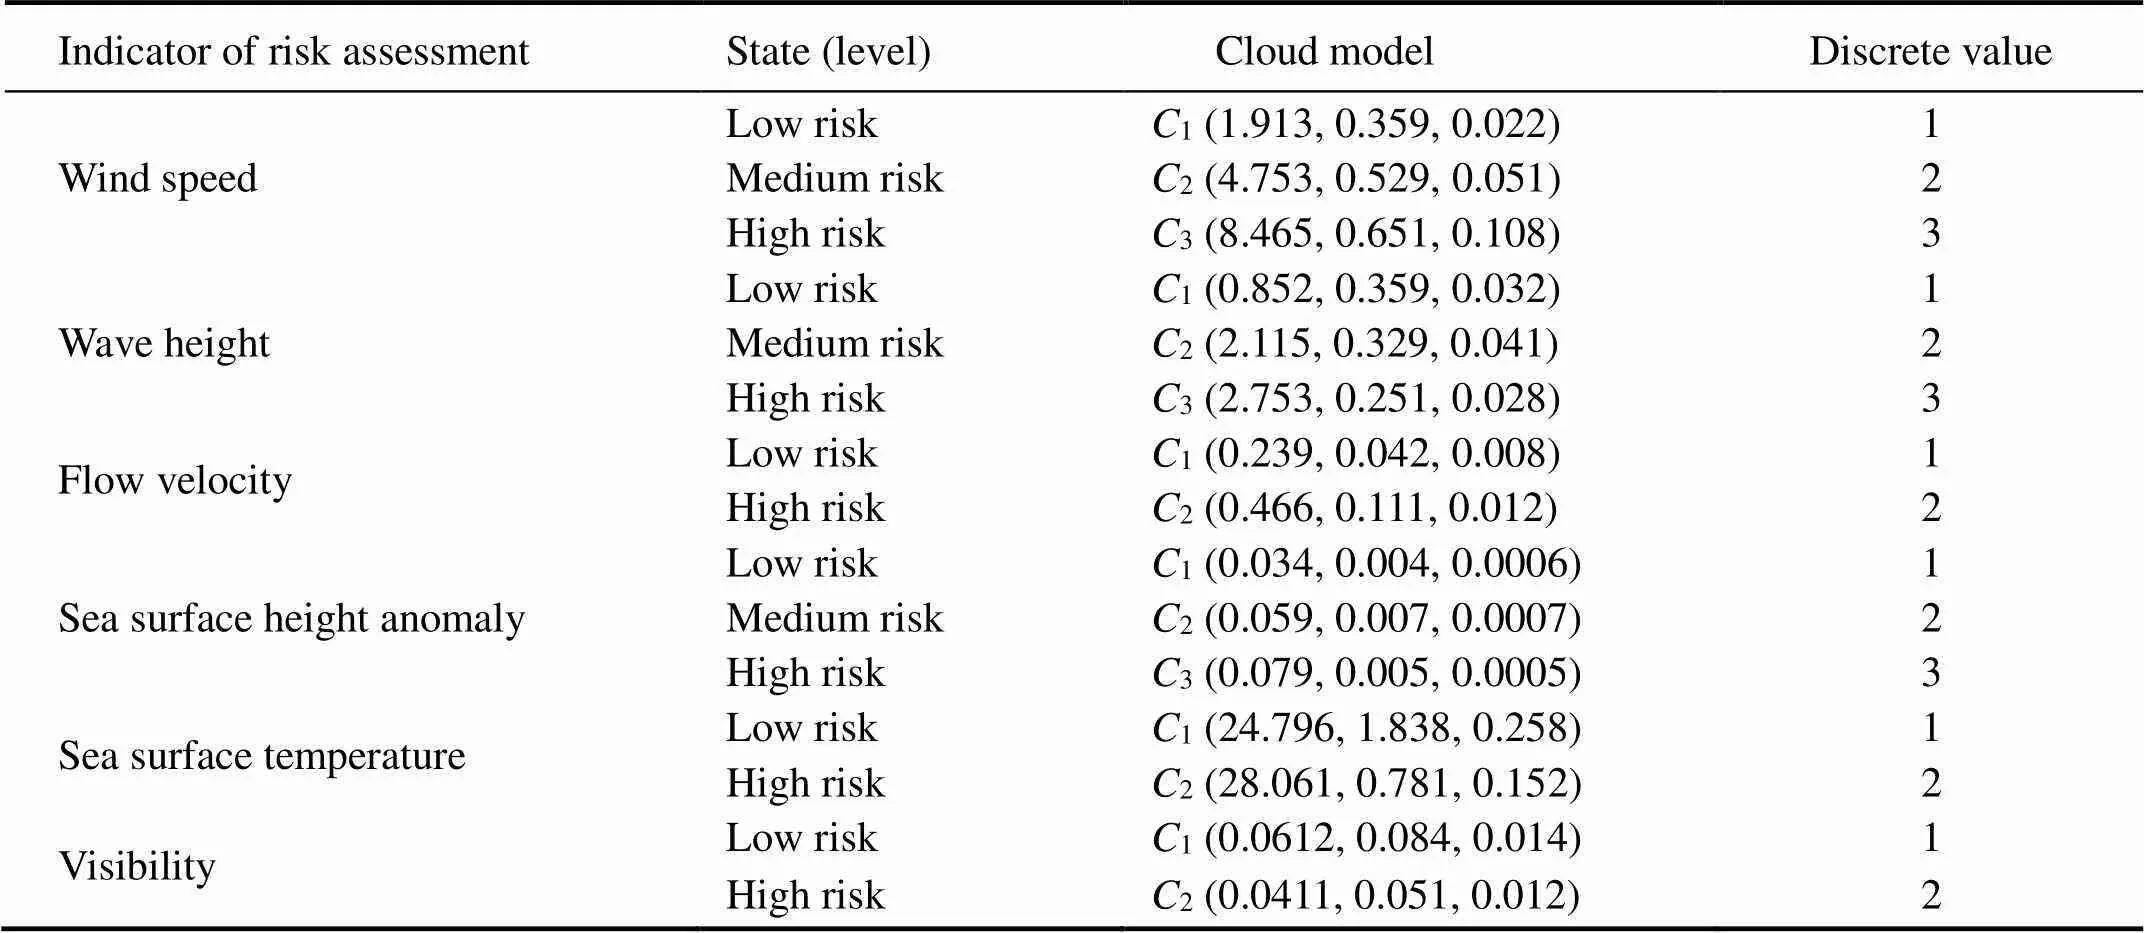
Table 4 Discrete expression of indicators with the cloud model

Table 5 Discrete data in JAN

Fig.5 BN structure of marine environmental indicators.
After the network structure is constructed, parameter learning is conducted to determine the conditional probability distribution of nodes. In this study, the Monte Carlo algorithm and the EM algorithm (Zhou, 2016) are combined to learn the conditional probability distribution. The algorithm principle of both is introduced as follows: We use the Monte Carlo algorithm to conduct 300 random number experiments to generate the conditional probability of each child node as the initial conditional probability of the EM algorithm. Then, on the basis of the discrete dataset, the EM algorithm is used to modify the conditional probability.
1) Monte Carlo algorithm
When the problem to be solved is the expected value of a random variable, the probability of the random event is estimated by a random number simulation experiment, or some numerical characteristics of the random variable are obtained.
2) EM algorithm
First, the probability distribution of each node is initialized. Then, the initial probability distribution is modified in accordance with training data to find the maximum likelihood estimate of each parameter.
E step: The distribution P(|,)of hidden variablesis inferred from the currentand observed variables, and the expectation of logarithm likelihood LL(|,)aboutis calculated.

M step: The maximized expectation of parameters is determined.

Next, the conditional probability distribution is weighted. In this study, the entropy weight method is used to calculate the weight of each indicator. The basic principle is to determine the weight in accordance with the variation of indicators (Zhang, 2010). The smaller the information entropy reflected by the indicator data, the greater the degree of variation and the greater the effect on the evaluation target,, the bigger the weight. On the basis of the regular monthly mean grid point data of each indi-cator in Section 4.2, the weights calculated by the entropy weight method are shown in Table 6.
In accordance with Eq. (3), the weighted conditional probability distribution is obtained by integrating the weight.
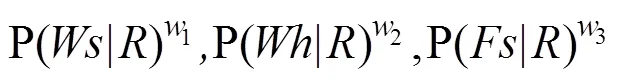

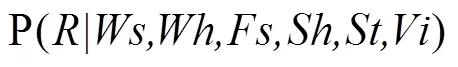
Table 7 shows the weighted conditional probability dis- tribution of,,. At this point, the weighted BN used for marine environmental risk assessment is completed.
(三)病理变化 对死亡羊只进行剖检,该羊消瘦、眼结膜苍白,显贫血症状,唇内及外阴口各有两个丘疹;心肝未见明显病变。肺微红、无弹性,有一处淤血,两侧肾上有大量坏死灶,前胃及四胃上有少许硬实的结节单个存在;肠系膜淋巴结微肿、发白,其余未见明显示病症状。

Table 6 Indicator weights
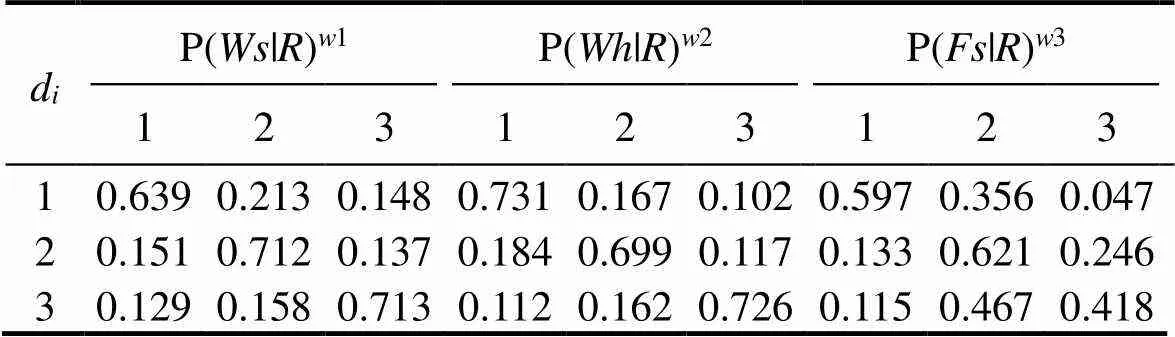
Table 7 Weighted conditional probability distributions of Ws, Wh, Fs
4.4 Probabilistic Reasoning and Assessment
To ensure the precision of probabilistic inference, we in- put prior information into the model after the following process: The monthly discrete data of each indicator are input into the cloud generator, and the discrete level is converted to prior probability distribution by the definite- ness-probability transformation formula, which is used as the soft evidence of child nodes for probabilistic reasoning, as shown in Table 8.
The prior information of each child node is input month by month, and the posterior probability distribution of the parent node (marine environmental risk) is calculated with the joint tree reasoning mechanism. The risk assessment results of January are shown in Table 9, and the high-risk probability zonation of each month is shown in Fig.6.
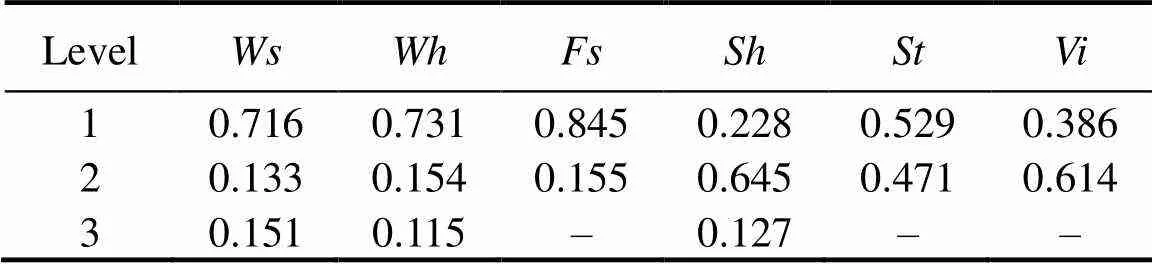
Table 8 Soft evidence of child nodes (Grid point 1, January)
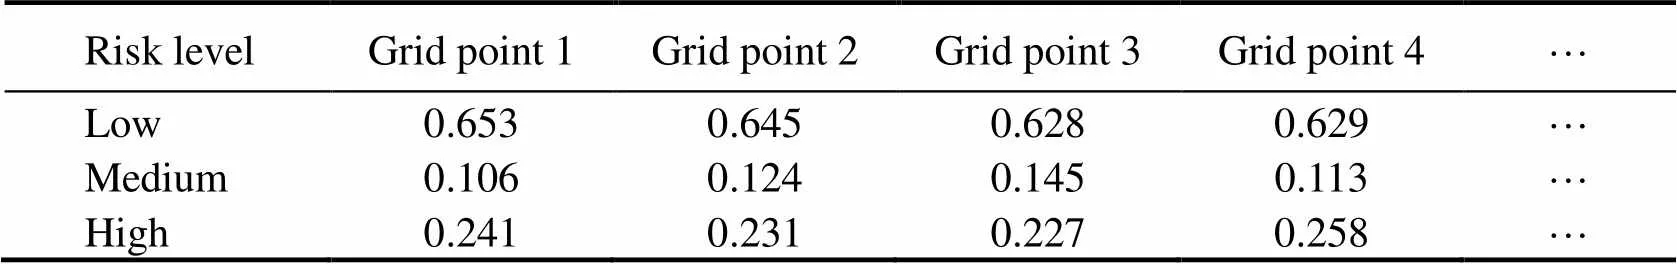
Table 9 Posterior probability distribution of marine environmental risk in January

Fig.6 High-risk probability zonation of the marine environment from Janaury to December. (a) Jan., (b) Feb., (c) Mar., (d) Apr., (e) May, (f) Jun., (g) Jul., (h) Aug., (i) Sep., (j) Oct., (k) Nov., (l) Dec.
As shown in Fig.6, in Janary, the high-risk probability of marine environment along the Maritime Silk Road is high in the South China Sea (>0.5), especially in the vicinity of the Luzon Strait; the high-risk probability is greater than 0.6. By contrast, the high-risk probability is generally low in the Indian Ocean (<0.1). In February to April, the high-risk probability decreases gradually in the South China Sea, but it remains low in the Indian Ocean. In May, the high-risk probability is low in the South China Sea and the Indian Ocean (<0.4), but it is high off the coast of the Arabian Peninsula (reaching up to 0.8). In July–August, the high-risk probability continues to decrease in the South China Sea but increases in the Arabian Sea (>0.8). In September, the spatial distribution of high-risk probability is similar to that of May. In October–December, the high-risk probability decreases gradually in the Indian Ocean (<0.2) but increases in the South China Sea (>0.7).
To present the risk assessment results comprehensively, NETICA software is used to visualize network reasoning. NETICA is a BN implementation platform, which uses the joint tree reasoning mechanism for probabilistic reasoning on the network. For an example of Grid point 1 in January, we input network structure, weighted conditional probability distributions, and prior evidence into the platform. The results of probabilistic reasoning are shown in Fig.7.
To verify the validity of the weighted BN-based assessment model, we compare it with the FCE, which is a widely used model. For an example of Grid point 1, we adopt the FCE to assess the marine environmental risk from January to December. The threat degree is [0.301, 0.299, 0.386, 0.495, 0.523, 0.804, 0.852, 0.816, 0.695, 0.423, 0.331, 0.298], and the comparison is shown in Fig.8.
As shown in Figs.7 and 8, the higher the probability of high risk, the greater the threat degree. Consistency is observed in the assessment results between weighted BN and FCE, thus justifying the rationality of our proposed model. However, the results of marine environmental risk assessment based on the weighted BN are rich, that is, they not only comprehensively describe the probability distribution of marine environmental risk at different levels but also clearly express the probability distribution of each assessment indicator at different levels, as shown in Fig.7. The degree of impact of different indicators on marine environmental risk can be judged directly. The assessment results visually describe the relationships between different marine environmental factors and the marine environmental risk and quantitatively express the uncertainty of marine environmental risk, which cannot be achieved by traditional assessment methods. By contrast, we only obtain a certain risk measure of marine environmental risk by the FCE.
To elaborate on the advantages of the weighted BN, we also compare it with the unweighted BN. For an example of Grid point 1, Fig.9 shows that the probabilities of different risk levels calculated with the unweighted BN are close; thus, identifying the risk level is difficult. In comparison, the assessment result obtained by weighted BN is in line with reality and is beneficial to decision-making.
5 Discussion and Conclusions

Fig.7 Probabilistic reasoning of marine environmental risk (Grid point 1, January).
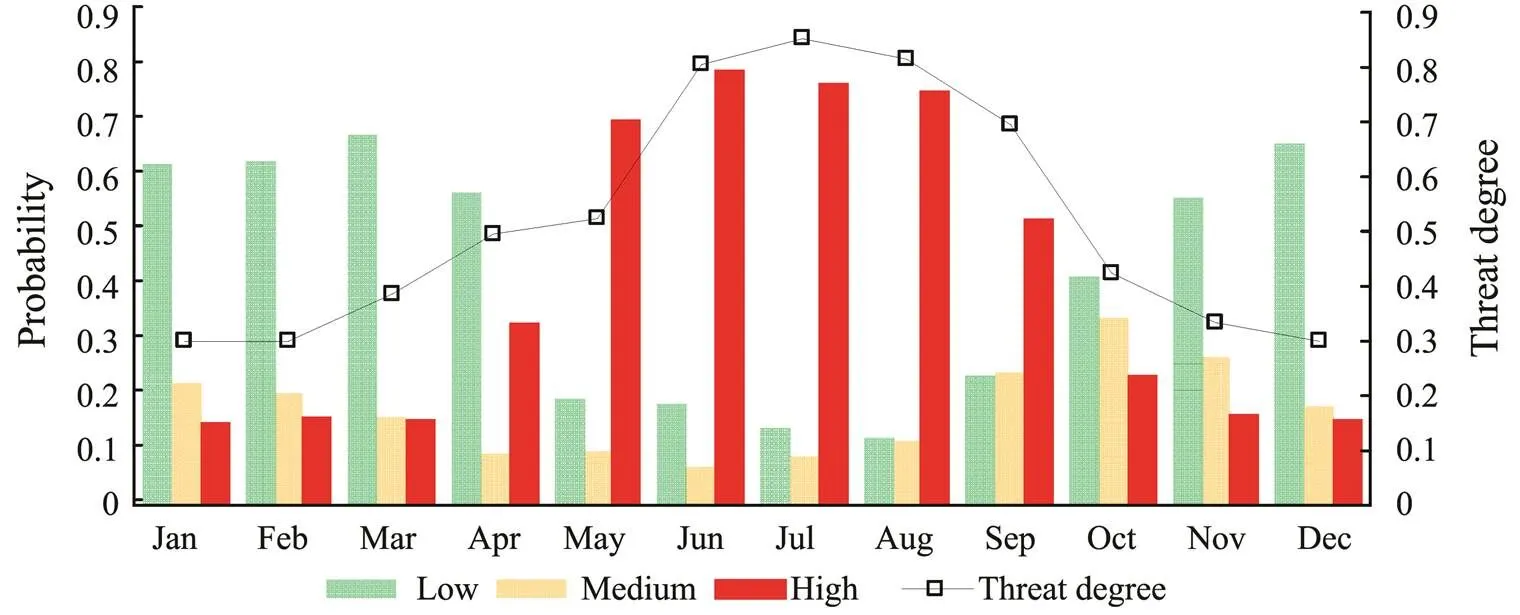
Fig.8 Comparison of the weighted BN and FCE (Grid point 1).

Fig.9 Comparison of the weighted BN and unweighted BN (Grid point 1).
However, the selection of assessment indicators is not comprehensive in marine environmental risk modeling, and the construction of BN structure based on expert knowledge is subjective. In the future, we will try to mine the influence relationships among assessment indicators from objective data to build a more reasonable network structure. In addition, a more detailed marine environmental risk assessment should be conducted for key nodes along the Chinese 21st Century Maritime Silk Road.
Acknowledgements
This study is supported by the Chinese National Natural Science Fundation (Nos. 41976188, 41775165), the Chinese National Natural Science Fundation of Jiangsu Province (No. BK20161464), and the Graduate Research and Innovation Project of Hunan Province (No. CX20200009).
Appendix
The cloud model is defined as follows: Supposeis a quantitative domain with exact values, andis the qualitative concept on. If the quantitative valueÎandis a stochastic realization of the qualitative concept, then the certainty offor:()Î[0, 1] is a random number with stable tendency,

Then, the distribution ofon the domainis called the cloud(,()).
The cloud can represent a concept with expectation, entropy, and superentropyas(,,).is the mathematical expectation of the cloud and the certain measure of the qualitative concept.is the size of the range of values that can be accepted by the qualitative concept in the domain space, that is, the uncertain measurement of the qualitative concept, reflecting the degree of discretization of the cloud.is the uncertain measure of entropy, which can reflect the degree of convergence of a qualitative concept, together with the entropy (Zhang, 2013).
Cloud models are achieved in various ways. Different clouds can be generated on the basis of different probability distributions, such as uniform cloud, Gaussian cloud, and power law cloud. The Gaussian cloud model based on the second-order Gaussian distribution is one of the most important and widely used cloud models and is universal in conceptual representation. Fig.A1 shows a Gaussian cloud model with=5,=3,=0.3, and the number of cloud droplets is 2000. This study adopts the Gaussian cloud model.
In cloud models, the conversion between the numerical features of the qualitative concept and quantitative data is achieved by the forward and reverse cloud generators. In this study, we use the forward Gaussian cloud generator shown in Fig.A2 to realize the mapping from qualitative concept to quantitative value.
The Gaussian mixture model (GMM) is an important method in probability statistics; the core is to convert any frequency distribution of actual problems into a stack of multiple Gaussian distributions (Liu, 2015). Gaussian cloud transformation (GCT), which combines the Gaussian cloud and the GMM, is a method to discretize continuous variables. Adaptive GCT (A-GCT) is an improvement over GCT. Without specifying the number of concepts in advance, the A-GCT starts from the actual data, generates multiple concepts, and adjusts these concepts with the degree of inclusion. Thus, data distribution is automatically divided into different concepts. A-GCT considers the clustering principle of ‘strong interclass relations and weak intraclass relations’ and provides a soft-grading method from quantitative data into multiple qualitative concepts.
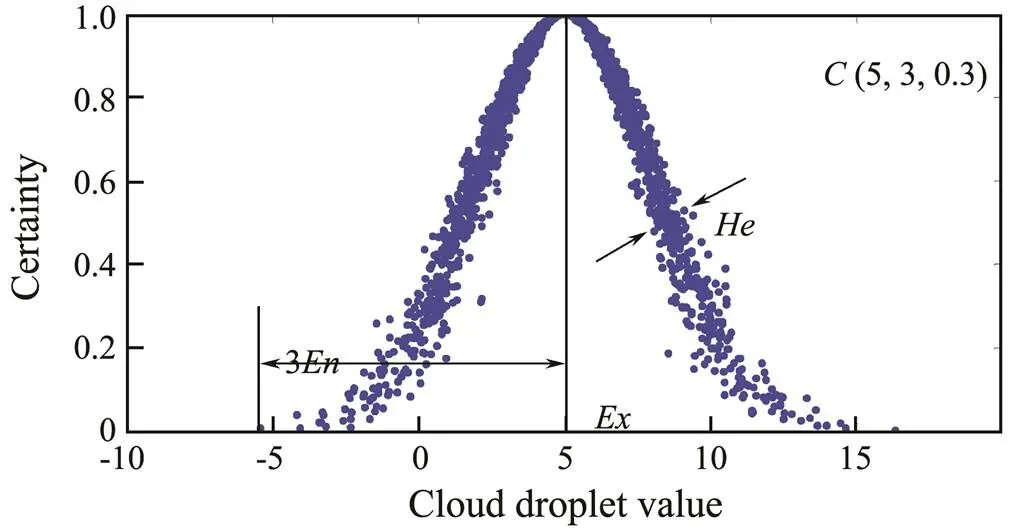
Fig.A1 Diagram of the Gaussian cloud model.
Fig.A2 Forward Gaussian cloud generator.
Aguilera, P. A., Fernández, A., and Reche, F., 2010. Hybrid Bayesian network classifiers: Application to species distribution models., 25 (12): 1630-1639.
Boutkhamouine, B., Roux, H., and Pérès, F., 2017. A Bayesian network approach for flash flood risk assessment.. Vienna, 147-165.
Dubois, J. M., 2012. Remote sensing for hazard monitoring and disaster assessment: Marine and coastal applications in the Mediterranean region., 9 (6): 62-67.
Fang, S. J., 2007.. China Ocean Press, Beijing, 126-134.
Feng, J., and Liu, Q., 2017. Pre-assessment for the loss caused by storm surge based on the SVM-BP neural network., 36 (4): 615-621.
Khatsü, P., and Westen, C., 2011. Urban multi-hazard risk analysis using GIS and remote sensing: A case study from Kohima Town, Nagaland, India.. Enschede, 96-107.
Li, C. M., and Luo, X. L., 2006. Application of analytic hierarchy process (AHP) in disaster impact assessment model of tropical cyclone., 22 (3): 223-228.
Li, M., and Liu, K. F., 2019. Causality-based attribute weightinginformation flow and genetic algorithm for naive Bayes classifier., 5 (7): 150630-150641.
Li, M., Hong, M., and Zhang, R., 2018a. Improved Bayesian network-based risk model and its application in disaster risk assessment., 9 (2): 237-248.
Li, M., Zhang, R., and Hong, M., 2018b. Marine disaster assessment and management based on weighted Bayesian network., 35 (1): 52-59.
Li, M., Zhang, R., and Liu, K. F., 2020. A new ensemble learning algorithm combined with causal analysis for Bayesian network structural learning., 12 (12): 2054.
Li, X., Hong, M., and Wang, B., 2012. Disaster assessment and risk zoning concerning the South China Sea and Indian Ocean safety., 6: 121-127.
Liu, Y. C., 2015. An adaptive multi-granularity concept extraction method–Gaussian cloud transformation., 51 (9): 1-8.
Pearl, J., 1995. From Bayesian networks to causal networks. In:. Coletti, G.,, eds., Plenum Press, New York, 206-302.
Qi, Q. H., and Cai, R. S., 2017. A Study on climate change and storm hazard risk of marine environment of the 21st Century Maritime Silk Road., 34 (5): 67-75.
Wang, S. C., Tang, H. Y., and Liu, X. H., 2007. Learning Bayesian networks in risk management., 22 (5): 569-572.
Wen, S. Y., and Zhao, D. Z., 2007. Research on the weight of red tide disaster risk assessment index based on AHP method., 22 (2): 9-14.
Wu, J., Zhu, X., and Zheng, S., 2013. Artificial immune system for attribute weighted Naive Bayes classification.. Singapore, 46-61.
Yang, L., and Li, Y., 2013. Design of comprehensive evaluation index system for marine disaster vulnerability., 32 (3): 133-137.
Yang, L. Z., and Zhang, R., 2016. Risk assessment of the human environment of four major asean countries for the 21st-Century Maritime Silk Road., 35 (6): 617-624.
Ye, T., Guo, W. P., and Shi, P. J., 2005. Risk analysis and integrated risk management of marine disaster systems in China since 1990., 14 (6): 65-70.
Zhang, E. Y., 2015. Port ship oil spill risk assessment based on fuzzy Bayesian network. Master thesis. Dalian Maritime University.
Zhang, R., 2012.. Beijing Normal University Press, Beijing, 312-336.
Zhang, S., Zhang, M., and Chi, G. T., 2010, The science and technology evaluation model based on entropy weight and empirical research during the 10th five-year of China., 7 (1): 34-42.
Zhang, Y. Y., 2013. Air target threat assessment based on cloud model theory. Master thesis. PLA Information Engineering University.
Zhao, Q. L., and Xu, S. Y., 2007. Research progress of storm surge disaster risk assessment in coastal cities., 26 (5): 32-40.
Zheng, C. W., and Li, X. Q., 2015. Marine environmental characteristics of the 21st-Century Maritime Silk Road: A statistical analysis of wind., 3 (8): 4-11.
Zheng, C. W., and Sun, W., 2016. 21st-Century Maritime Silk Road: Important routes, nodes and port characteristics., 33 (1): 4-13.
Zheng, C. W., Pan, J., and Li, J. X., 2013. Assessing the China sea wind energy and wave energy resources from 1988 to 2009., 65: 39-48.
Zheng, C. W., Wang, Q., and Li, C. Y., 2017. An overview of medium- to long-term predictions of global wave energy resources., 79: 1492-1502.
Zhou, X., and Jing, Z. L., 2004. Bilinear interpolation wavelet fusion method for remote sensing images., 38 (4): 547-550.
Zhou, Z. H., 2016.. Tsinghua University Press. Beijing, 368-375.
June 13, 2020;
January 05, 2021;
January 19, 2021
© Ocean University of China, Science Press and Springer-Verlag GmbH Germany 2021
. E-mail: zrpaper@163.com
(Edited by Xie Jun)
猜你喜欢
杂志排行

Journal of Ocean University of China的其它文章
- Case Study of a Short-Term Wave Energy Forecasting Scheme:North Indian Ocean
- Temporal and Spatial Characteristics of Wave Energy Resources in Sri Lankan Waters over the Past 30 Years
- Vibration Deformation Monitoring of Offshore Wind Turbines Based on GBIR
- Dependence of Estimating Whitecap Coverage on Currents and Swells
- The Variation of Microbial (Methanotroph) Communities in Marine Sediments Due to Aerobic Oxidation of Hydrocarbons
- 3-Aminopropyltriethoxysilane Complexation with Iron Ion Modified Anode in Marine Sediment Microbial Fuel Cells with Enhanced Electrochemical Performance