不同采收期黄参茎叶化学成分及生物活性变化
2021-06-17鲍诗晗何玉英马文娜王雪冰孙翔宇马婷婷
鲍诗晗,何玉英,王 纯,马文娜,王雪冰,孙翔宇,马婷婷,
(1.西北农林科技大学食品科学与工程学院,陕西杨凌 712100;2.西北农林科技大学葡萄酒学院,陕西杨凌 712100)
Sphallerocarpus gracilis(S. gracilis) is a medicinal and edible plant and has been used as functional food raw of late years in China[1]. It belongs to the Apiaceae family and has played an important role in traditional Chinese medicine and traditional Tibetan medicine for more than one thousand years, especially in Gansu Province, whereS. gracilisis nicknamed “little ginseng” in folk medicine[1-3]. It is also widely distributed in Mongolia,the former Soviet Union and the Far East[1].According to ancient writings including Shel Gong Shel Phreng in traditional Tibetan medicine and Compendium of Materia Medica in traditional Chinese medicine, the entireS. gracilisplant has a wide spectrum of pharmacological efficacy, including treating tetanus and ulcers, rheumatic arthritis[4], and has several health-promoting effects when used in traditional Chinese and Tibetan medicine, such as nourishing the blood and improving the level of vital energy, soothing the liver, strengthening the spleen,clearing and activating the channels and collaterals[5-6].Based on its broad bioactivities, it is a traditional health food in the countryside, while in recent years,it has also been used as raw material for industrial level functional foods, health products and drugs production, and these commercial products are very popular in China, especially in northwestern China[1,7].
Due to their increasing popularity, the entireS.gracilisplant has been extensively examined with regard to phytochemical composition and biological activity. However, in these studies, most of them were focused on the root part ofS. gracilis[1,3,6-8]as well as its seeds[2,4]. Studies regarding the aerial parts of the plant are very scarce; however, the aerial parts ofS.gracilisare extensively used in traditional Chinese and Tibetan folk medicine[1]. In addition, there are four harvest time (semiannually, spring/fall) of the aerial parts ofS. gracilisused for medicine in Chinese folk medicine and Tibetan folk medicine, which have different medical effects and purposes according to ancient records[5,9]and the special physiological characters ofS. gracilis[1]. Although some studies have focused on the aerial parts ofS. gracilisin recent years[1,9], the mechanism of this phenomenon, as well as the differences in chemical composition and biological activities among the different harvest time of the aerial parts ofS. gracilis, are still unknown and require further examination.
Meanwhile, there are so manyin vitroresearches focused on the bio-activities or phytochemical composition of bioactive phytochemicals neglected the changes of them occurring in digestion process of body[10]. The effect of bioactive compounds on health depends not only on the concentration in plants and the consumption of people, but also on their bioavailability[11]. Hence, there are more and more studies usingin vitrodigestion model as a low-cost and high-throughput tool to study gastrointestinal behavior of foods and drugs in recent years[12].In vivostudies including human and animal nutritional studies are always costly, limited by ethical concerns,and time consuming. Meanwhile, thein vitrodigestion model could quickly and cheaply screen a large sample set[12-14]. Also, thein vitrodigestion model had been proved with well relativity within vivostudies[10].
Therefore, in this study, the main bioactive nutrients, including trace and mineral elements, amino acids and polyphenols which might be contribute to the health effect of the stems and leaves ofS. gracilis(SLSG) was analyzed to compare the differences among the different harvest time. Additionally, the biological activities, including antioxidant ability,digestive enzyme inhibition ability and hepatic protection ability, of the different harvest time were also analyzed. Furthermore, the digestive characteristics of the nutritional components of SLSG harvested at different time were analyzed using simulated gastrointestinalin vitrodigestion model.With these results, it was hoped to increase our understanding of the differences in chemical composition and biological activities among SLSG harvested at different time and provide new information and scientific recommendations for the further exploitation of this resource.
1 Materials and methods
1.1 Materials and instruments
SLSG Gathered in Shandan county from Gansu province, China, with a altitude of 2700 m, latitude 38°77’N, longitude 101°08’E with four different harvest time on April, 14, 2016 (T1), October, 10,2016 (T2), April, 16, 2017 (T3) and October, 11,2017 (T4), and a minimum of 10 kg was harvested on each date to minimize the influence of the heterogeneity of the raw material. The plant materials were further identified as theSphallerocarpus gracilis, Apiaceae by the senior taxonomist Prof. Tian Chengrui from Shaanxi Normal University. Then, the SLSG were crushed (over 60 mesh) after freeze-dried,and stored in -80 ℃ for further analysis.
HPLC-grade methanol Fisher Co.; α-glucosidase(100 U), α-amylase from human saliva (100 U),luteolin-7-O-glucoside (L7G) Sigma Chemical Co.;BRL hepatocytes Institute of Biochemistry and Cell Biology, Shanghai Institutes for Biological Sciences;All diagnostic kits, including alanine aminotransferase (ALT), lactate dehydrogenase (LDH), and aspartate aminotransferase (AST) Nanjing Jiancheng Co.; All the other chemicals were analytical grade.
BS200S-W Elelectronic analytical balance Sartorius, Beijing; Christ Delta 1-24 LSC freezer dryer Martin Christ, Germany; LXJ-II Bhigh speed centrifuge, RE-52Rotary evaporator Anting,Shanghai; 722 visible spectrophotometer Shanghai Spectrum; Multiskan Go Spectrum Thermo; FW100 High speed universal plant pulverizer Shanghai Shupei; Optima 7000DV ICP-OES (inductively coupled plasma optical emission spectrometer) Perkin Elmer,Waltham, Massachusetts, USA; Merck LiChro-CART® 250-4 C18column (5 μm, 250 mm×4.6 mm)
Darmstadt, Germany; L-8900 amino acid analyser
Hitachi, Tokyo, Japan; 1260 HPLC chromatography system, in series with a 6460 triple quadrupole mass spectrometer Agilent, USA; other equipment and instrument Commonly used in the laboratory.
1.2 Experimental Methods
1.2.1 The simulated gastrointestinal (GI)in vitrodigestion The simulated gastrointestinal (GI)in vitrodigestion assay was performed according to previous reports[11-12]with slight amendment. Three sequential and independent digestion steps including mouth,stomach and small intestine digestion were contained to imitate thein vivoGI digestion in this model. The samples were examined after each digestion step;thus, there were 9 parallel sample sets included in mouth digestion step, 6 sample sets included in stomach digestion step and 3 sample sets in small intestine digestion step. The flow chart of the digestion experiment was shown as Fig.1.

Fig.1 The flow chart of the digestion experiment
1.2.1.1 Mouth digestion 10 g SLSG powder was added to a glass flask which contained 10 mL artificial saliva solution (10 mol/L NaH2PO4, 40 mol/L NaHCO3, 50 mol/L NaCl), then 1 mol/L NaOH was used to adjust the pH to 6.7~6.9. Fresh α-amylase preparation (100 μL) was added into the flask, then the flask was put into a shaking incubator and shaken for 10 min (37 ℃, 100×g) so as to simulate the mouth chew[15-16]. The longer time than the actual duration in mouth was aimed to reduce the variability among different samples[17-18]. Then, three sample groups were snap frozen using liquid nitrogen to stop the reaction immediately, then stored for each treatment.
1.2.1.2 Stomach digestion After the mouth digestion,20 mL simulated gastric fluid[19]was added into the mouth digestion resulting samples, and the pH was adjusted to 1.2 by HCl. Then the mixtures were transferred into a tube which was encased with silver paper, shaken at 100×g in 37 ℃ for 2 h to imitate the gastric digestion. Then, three sample groups were snap frozen to stop the reaction immediately, then stored for each treatment.
1.2.1.3 Small intestine digestion After stomach digestion, 10 mL simulated intestinal fluid[19]was added into the stomach digestion resulting samples,and the pH was adjusted to 7.5 by NaOH. Then, the specimens was put into a glass beaker which was sealed with parafilm and contained a closed dialysis bag with molecular weight cut-off 12 kDa, and was completely filled with sufficient NaHCO3at pH 7.5 and bubble-free, then shaken at 100×g in 37 ℃ for 2 h to imitate the simulate small intestine digestion. After 2 h, the inside part of the dialysis bag was separated and stored, which represented the ‘serum-available fraction’, and was the fraction available for absorption into the circulatory system by passive diffusion.Meanwhile, the outside part of the dialysis bag was separated and stored, which represented the ‘colonavailable fraction’, and was the material remained in the gastrointestinal tract, which would reach the colon.
1.2.1.4 Sample preparation for analysis All mouth digestion, stomach digestion and small intestine digestion samples were centrifuged at 13000×gfor 10 min, then filtered through 0.45 μm pore filters and stored at -80 ℃ for analysis.
1.2.2 Analysis of elements Thirteen trace elements,macroelements and heavy metal elements (K, Mg, Ca,Na, P, Fe, Zn, Cu, Se, Mn, Cd, Hg and As) were analyzed using ICP-OES after liquid ashing (4 mL HNO3+ 1 mL H2O2) of the samples in a microwave digestion system (Milestone, 1200 M). Diluted standard stock solutions (Agilent, Santa Clara, USA)at different concentrations were used to generate the standard curves for every element. The instrument drew the standard curve automatically, and the correlation coefficients of all standard curves were greater than 0.9996[20].
1.2.3 Free amino acids analysis The concentration of free amino acids was determined following the method described by previous report with some modifications. Briefly, 75 mg samples was placed in a 20 mL ampoule and mixed with 10 mL 6 mol/L HCl.After sealing the ampoule, the samples was hydrolyzed at 110 ℃ for 24 h under a vacuum. The hydrolysate was dried under nitrogen. The dried sample was dissolved in 3~5 mL sodium citrate buffer(pH2.2) to obtain an amino acid concentration of 50~250 nmol/mL, filtered and loaded on a amino acid analyzer for amino acid analysis. To determine the tryptophan content, the sample was hydrolyzed in 5mol/L NaOH containing 5% SnCl2for 20 h at (110±0.5)℃[21].
1.2.4 Determination of polyphenols
1.2.4.1 Total phenolics (TP) determination The TP content was detected using Folin-Ciocalteu colorimetric method, of which the results were shown as mg gallic acid equivalents (GAE)/100 g dried weight (DW) (mg GAE/100 g DW)[22-23]. Samples was extracted three times (each extraction for 30 min)using 700 mL of 75% ethanol (v/v) with ultrasonication at 70 ℃. Absorbances were measured at 765 nm. Gallic acid standard solutions were prepared at a concentration ranging from 0 to 1000 mg/L. The standard curve was Y=0.1159X+0.0045(R2=0.9990).
1.2.4.2 Phenolic compounds composition determination The SLSG phenolic composition was analyzed based on our previous study using HPLC-MS[1].Separation was performed using a reversed phase C18column protected by a guard column composed of the same material. The injection volume was 10 μL. The mobile phase consisted of solvent A (methanol containing 0.3% glacial acetic acid) and solvent B(glacial acetic acid/methanol/H2O, 0.3/10/89.7,v/v/v) using the following gradient elution program for separation: 0~10 min, 30% solvent A and then 10~60 min, 30%~44% solvent A. The detecting wavelength was set at 280 nm. The duration of a single run was 60 min. The mobile phase flow was split before reaching the MS instrument to produce an effective flow of 0.4 mL/min. The MS instrument was operated in scanning mode, scanning m/z 50~1000.The mass spectra were acquired in the negative mode using a source voltage of 4.0 kV, a capillary temperature of 350 ℃, and a capillary voltage of -85.5 V. Nitrogen was used as the drying gas, supplied at 8 L/min and 350 ℃. As the lack of standard compounds, A7O, A7OI-1 and A7OI-2 contents were quantified by external standard method, the results were showed as mg L7G/g DW.
1.2.5 Determination of antioxidant capacity The antioxidant capacities of SLSG were determination by four different methods including ORAC, DPPH,FRAP, and ABTS based on previous reports[20,23]with some modifications. Results were expressed as trolox equivalent antioxidant capacity, which were shown as μmol/L Trolox/100 g FW. Trolox standard solutions were prepared at a concentration ranging from 0 to 1200 mol/L.
For DPPH method, 0.1 mL of samples was added to 3.9 mL of a 6×10⁻⁵mol/L solution of DPPH in methanol. A control sample containing the same volume of solvent in place of extract was used to measure the maximum DPPH absorbance. After the reaction was allowed to take place in the dark for 20 min, the absorbance at 515 nm was recorded to determine the concentration of remaining DPPH.
For ABTS method, ABTS radical cation(ABTS+·)was produced by reacting 7 mol/L ABTS solution with 2.45 mol/L potassium persulphate aqueous solution and allowing the mixture to stand in the dark at room temperature for 12~16 h before use. The ABTS+· solution was diluted with ethanol to an absorbance of 0.70±0.02 at 732 nm. After addition of 100 μL of samples to 3.9 mL of diluted ABTS+·solution, absorbance was measured at exactly 8 min.
For ORAC method, AAPH was dissolved in 10 mL of 75 mol/L phosphate buffer (pH7.4) to a final concentration of 153 mol/L and made fresh daily. A fluorescein stock solution (4×10⁻³mmol/L) was made in 75 mol/L phosphate buffer (pH7.4) and stored. The stock solution was diluted 1:1000 with phosphate buffer. To all experimental wells, 150 μL of working sodium fluoresce in solution were added. In addition,blank wells received 25 μL of 75 mol/L phosphate buffer (pH7.4), while standards received 25 μL of trolox dilution and samples received 25 μL of samples. A Multiskan GO microplate reader with injectors was used with a 485 nm excitation filter and a 535 nm emission filter. Reactions were initiated by the addition of 25 μL of AAPH solution.
For FRAP method, the stock solutions included 300 mol/L acetate buffer (3.1 g C2H3NaO2· 3H2O and 16 mL C2H4O2), pH3.6, 10 mol/L TPTZ solution in 40 mol/L HCl, and 20 mol/L FeCl3· 6H2O solution. The flesh working solution was prepared by mixing 25 mL acetate buffer, 2.5 mL TPTZ solution,and 2.5 mL FeCl3· 6H2O solution. 20 μL samples in 1 mL distilled water was allowed to react with 4 mL of the FRAP solution for 10 min at 37 ℃. Readings of the colored product were then taken at 595 nm.
1.2.6 Determination of the inhibitory effects of αglucosidase and α-amylase The determination methods of the inhibitory effects of α-glucosidase and α-amylase were based on a previous report[1]with some modifications, using the following equation to calculate the inhibitory activity (I).

Note: I, the inhibitory activity; Asample, the absorbancy of samples; Abackground, the absorbancy of background; Acontrol, the absorbancy of control.
1.2.7 Determination of thein vitrohepatoprotective effect
1.2.7.1 Cell viability 100 μL BRL hepatocytes suspension (2.5×10⁴/mL) was added to each well of a 96-well plate. Then 100 μL SLSG dialysate digestive juice (representing the serum-available fraction) after the small intestine digestion was added after incubation for 12 h. Meanwhile, 100 μL dulbecco's modified eagle medium(DMEM) was added into the control group and the CCl4-treated group. After another 12 h incubation, 50 μL PBS was added into the control group, while 50 μL CCl4(50 mol/L) was added for the other groups to induce cellular injury.Then, the cell viability rate was detected 6 h later using a microculture tetrazolium assay[2]. The results were showed as percent cell viability using the following equation.

Note: ODsample, the optical density of samples;ODblank, the optical density of blank; ODnormal, the optical density of normal.
1.2.7.2 The AST, ALT and LDH activities in supernatants 500 μL BRL hepatocytes suspension(2.5 × 10⁴/mL) was added to each well of a 96-well plate. Then 500 μL SLSG dialysate digestive juice(representing the serum-available fraction) after the small intestine digestion was added after incubation for 12 h. Meanwhile, 500 μL DMEM was added into the control group and the CCl4-treated group. After another 12 h incubation, adding 250 μL PBS into the control group, while 250 μL CCl4(50 mol/L) for the other groups to induce cellular injury. Then, the AST,ALT and LDH activities was detected using kit after 6 h[1].
1.3 Statistical analysis
The experimental data were expressed as mean±standard deviation (SD) in triplicates. The differences between the means were analyzed using Duncan’s t-tests and theP-values<0.05 was considered as significant. All data analysis was done using DPS software (version 7.05). All figures were done using the Excel program.
2 Results and discussion
2.1 Comparison of elements among SLSG with different harvest time under in vitro GI digestion
Thirteen elements results were shown in Fig.2, it could be seen that there were great variability among these minerals across the harvest time.
2.1.1 Assayed macroelements Among the five assayed macroelements (K, Mg, Ca, Na and P), K was the most abundant of all the elements in raw SLSG(Fig.2A), similar to Lu et al[24]report for the traditional Chinese medicinal herbL. lucidusTurcz and Koczka et al[25]for blackberry. Among the four harvest time, T2 showed the highest K content(442.40 mg/100 g DW) in raw SLSG, followed by T4,and T3 and T1, which showed lower K contents. This might be because most of the elemental contents were known to slightly increase as the plant grew[25], and T4 and T2 were in autumn, while T3 and T1 were in spring. Additionally, the second year had a higher K content than the first year (T3>T1 and T4>T2),although there was no significant difference between the seasons of the two years. After the oral digestion,the SLSG samples from all four harvest time showed a similar K release percentage(22%), which was the ratio of K in the oral digestive juice to the total K content in SLSG. After the stomach digestion process,T2 and T4 showed a significantly higher K release percentage (81% and 81%) than T1 and T3(76% and 78%). In the serum fraction, similar trends following the stomach digestion were observed: T2 and T4 had a K release percentage of 74% and 75%, while T1 and T3 had a K release percentage of approximately 68%~69%. These percentages were much higher than a previous report in juçara fruits observing a K bioaccessible fractions of 40% in the same digestion phase[26], which might be due to the difference in materials. Additionally, the average release percentage in the colon fraction was approximately 12%~14%. After the small intestine digestion, the SLSG samples would then be transported to the colon, where a diverse microbial ecosystems existed.Nutrients from the small intestine including K, could be the nutrition medium for the diverse microbial ecosystems in colon and influence the ecosystem of microorganisms. Alternatively, very little nutrient substances could continue to be to be absorbed into the serum[27].
With regard to Mg and Ca, Mg showed a similar content at all four harvest time (Fig.2B), which was different from K. However, Ca showed a similar trend as K with higher levels in autumn than in spring and higher levels in the second year than in the first year(Fig.2C). However, Ca showed a similar release percentage in the oral (16%~17%), stomach (86%~88%), serum (60%~62%) and colon fractions(15%~17%) among the different harvest time, while Mg showed a higher release percentage in the autumn(T2 and T4) samples than those collected in the spring samples in the analyses of all thein vitroGI digestion fractions. This might mainly due to the different dissolution rates which was resulted from the different binding forms for different elements[26]. The T2 and T4 samples showed trends for Na and P(Fig.2 I) that were similar to the trends in the variation of K and Ca. However, Na and P bioaccessibility were undetectable in this experimental system, as there were too higher Na and P contents in the blank digestion solutions[26,28].
2.1.2 Trace elements With respect to the four trace elements (Fe, Zn, Cu and Se), Fe (Fig.2D) showed an opposite trend from K, Ca, N and P, with the autumn samples containing less Fe than the spring samples.However, Zn, Cu and Se (Fig.2E~G) showed similar trends with K, Ca, N and P. Regarding the digestive characteristics, all four trace elements showed a higher release percentage in the autumn samples (T2and T4) than in the spring samples in all thein vitroGI digestion processes, including Fe, which had a lower content in autumn. In more detail, Cu and Se showed release percentages in the serum fraction of approximately 58%~71% and 53%~61%, respectively, while Fe and Zn showed release percentages in the serum fraction of approximately 64%~76% and 61%~75%, respectively. Typically, due to the low concentrations of protein in herbs and foods, such as fruits, the bioaccessibility of Fe and Zn in them was always low[29]. SLSG showed a higher Fe and Zn release percentages than other foods, such as groats,rice, leguminous grains and nuts, mainly due to the higher protein contents (15.89%)[30], which could raise the bioaccessibility of Fe and Zn by reducing and chelating iron. This was in consistent with Schulz et al[26]report in juçara fruit pulp which also had high protein content and also showed a high bioavailability of Zn (approximately 35.8%~69.2%) and Fe(approximately 7.6%~29.5%).
In addition, in recent years, Se had become an extremely nutritional substance[31-32]since it was firstly reported that Se might be an essential element under right concentration in 1957[33]. Meanwhile,supplements had been recommended around the world to increase daily selenium intake[34].Importantly, a highly Se content was showed, ranging from 17.87~39.87 μg/100 g DW in SLSG, and a high release percentage in the serum fraction was also observed (53%~61%). Hence, the consumption of SLSG and its products would be a good source for Se intake to satisfy the Chinese recommended daily Se intake (60 μg/d)[35].

Fig.2 Changes in the mineral elements of S. gracilis stems and leaves with different harvest time during in vitro GI digestion
2.1.3 Heavy metal elements With regard to the four heavy metal elements assayed (Mn, Cd, Hg and As),there were no Cd, Hg and As existed in all samples,meanwhile Mn was detected (Fig.2H), which belonged to the normal food composition content of 0.2~20 mg/kg in the <Chinese Food Composition Table 2002>. The absence of these three heavy metals indicated that the investigated samples were free of these three toxic metal elements. The trend in Mn levels among the four harvest time was similar to the trends in the variation of the macroelements K, Ca, N,and P as well as the trace elements Zn, Cu and Se,with the autumn samples containing a higher Mn content than the spring samples. Additionally, the second year samples showed significantly higher Mn contents than the first year samples(P<0.05). Mn showed a much lower oral release percentage than the other elements (only 7%~10%). In addition, the Mn release percentage in the serum fraction was also low(30%~45% for T1~T3 and T4 for 53%). Schulz et al[26]reported that Mn had an extensive range of bioavailability, which ranged from 17.40% to 36.40%and was also much lower than other elements, such as K, Mg, and Zn. However, Cai et al[36]reported that Mn had a bioaccessibility range of 39.50%~98.00%.This difference might be due to the existence of gut microbiota in theirin vitroGI digestion model, which had a great influence on nutrient substance bioavailability[37].
2.2 Comparison of free amino acids among SLSG samples harvested at different time following in vitro GI digestion
Amino acids were one of the most important bioactive nutrients that greatly contribute to the biological activities ofS. gracilis[38]. The amino acid composition of SLSG harvested from T1 to T4 was presented in Table 1 and Table 2. Almost all free amino acids, including 8 essential and 9 nonessential amino acids (except for Tyr and His), showed a similar trends across the four harvest time.Specifically, the autumn samples showed higher contents of these amino acids than the spring samples,and the samples collected in the second year showed significantly higher amino acid contents than the samples collected in the first year. These results were similar to a previous report that amino acid content increased with growth[24]. However, Tyr and His showed no significant difference among T1~T4. Gao et al[38]also reported a similar phenomenon inS.gracilisroot amino acid composition across different harvest time. In some amino acids, the difference was large; The Lys, Phe, Thr, Val, etc., content was twofold higher in T4 than in T1, while Tyr and His showed no notable difference among the different harvest time. Among all amino acids, three nonessential amino acids, Asp, Ala and Glu, were the main amino acids which were much more highly abundant than the other amino acids; which was somewhat different from the result inS. gracilisroot,of which Leu, Glu, Lys and Asp were the mainly amino acids[38]. This might be because different parts of the plant had different trophic component compositions[39]. The T4 samples had the topmost total essential amino acids (TEA) content and total amino acids (TAA) content, then T2, T3 and T1,which was similar with Lu et al[24]report, in which individual amino acids showed a similar changed trend with TAA among different harvest time.
During thein vitroGI digestion, the individual amino acids were impacted in various ways. In the initial oral digestion, Trp, Gly, Pro and Glu showed a very low release percentage (approximately 6%~11%), while Phe, Met, Thr, Leu, Ala and Arg showed a much higher release percentage(approximately 30%~54%). The release percentages of the other amino acids were in the middle(17%~28%). After the stomach digestion process, all amino acids showed a higher release percentages than after the oral digestion, especially Met, Phe(approximately 74%~77%), and Leu, which might be due to pepsin preferentially cleaving the C-terminus of Phe, Leu and Met[40]. In the serum fraction, all amino acid release percentages were higher than in the stomach digestion (except Phe), which was different from the results of the elements (Fig.2). This might be because during stomach digestion, pepsin broke down protein and peptides partly into amino acids and partly into small fragments; however, after small intestine digestion, all these pancreatin further broke down these small fragments into amino acids[40]. Among the four harvest time, the T1~T4 samples showed similar digestive characteristics regarding amino acids. Specifically, Trp, Gly, and Pro showed a much lower release percentage in all thein vitroGI digestion steps (resulting in approximately 13%, 13% and 10%, respectively), which was similar to You et al[40]. In addition, the ratio between TEA/TAA also changed during the digestion process.In raw SLSG, the TEA/TAA ratio ranged from 25.29% (T1) to 29.44% (T2); However, this ratio increased to approximately 32% after the oral digestion process, increased to approximately 40%during the stomach digestion process, and then decreased to 31.66% (T1)~38.58% (T2) in the serum fraction. These results indicated that the essential amino acids in SLSG had a better digestibility than the nonessential amino acids in SLSG.

Table 1 The essential amino acid content in the SLSG samples harvested at different time during in vitro GI digestion (g/100 g DW)
2.3 Comparison of polyphenols among the SLSG samples harvested at different time following in vitro GI digestion
2.3.1 TP Previous reports showed thatS. gracilis[2],especially SLSG, was rich in polyphenols[1,5]; hence,the TP contents were quantified in our study. As Fig.3A, T4 showed the highest TP content (15.14 mg GAE/100 g DW), followed by T2 (12.31 mg GAE/100 g DW), T3 (10.09 mg GAE/100 g DW),and then T1 (8.67 mg GAE/100 g DW), which was similar to free amino acids. Specifically, T4 showed a nearly twice the TP content of T1. Lu et al[24]also reported a similar increasing trend in TP with plant growth inL. lucidusTurcz. root. In addition, as T4 and T2 were in autumn, the low-temperature stress of them might also increase the synthesis and activity of PAL, which were the key enzyme for the phenolic metabolism[41], resulting in an increase in TP content.Furthermore, previous studies showed that TP was 3.19 mg and 0.35~0.71 mg GAE/100 g DW in seeds and roots[2,38]ofS. gracilis, respectively. These data indicated that SLSG contained the most of the polyphenols inS. gracilisplants.
Lingua et al[42]observed that 31% of the TP in wine was found in the serum fraction, which was remarkably lower than the percentage shown in this research. What’s more, a nearly 99% release percentage of TP was observed forLavandula stoechasL. ssp.stoechasby Celep et al[10], which was much higher than the percentage shown in this research. During thein vitroGI digestion, the four harvest time showed similar release percentages. Specifically, the oral release percentage was approximately 29%, the stomach release percentage ranged from 80%~83%, the serum fraction release percentage ranged from 48%~55%,and in the colon fraction ranged from 10%~13%. This might mainly due to the different raw materials, as well as the different simulated gastrointestinalin vitrodigestion systems used[12,26].

Table 2 The nonessential amino acid content in SLSG samples harvested at different times during in vitro GI digestion (g/100 g DW)
2.3.2 Individual phenolic compounds As shown in Fig.3B and Table 3, via the peak retention times (Rt)and comparing the fragmentation profiles to the standard compounds or published data, 4 individual phenolic substances were identified in SLSG, which was similar with our previous report[1]. HPLC-MS analysis revealed that peak 1 contained a molecular ion [M-H]-at m/z 447, and the MS2event yielded a fragment ion at m/z 285, the typical mass observed in the negative mode for luteolin-7-O-glucoside(L7G)[2]; an authentic standard of L7G was injected,and the retention time, UV spectra and MS spectra matched those of peak 1. Therefore, the compound in peak 1 was identified as L7G. Minor peaks 2, 3 and 4 had the same molecular ions [M-H]-at m/z 489, and the associated MS2events yielded a fragment at m/z 285, which accorded with previous publications[43-44],was 42 amu larger than that of acacetin 7-Ogalactoside (A7O), suggesting that these peaks represented acetyl derivatives. Therefore, the compounds in peaks 2, 3 and 4 were tentatively identified as A7O; these compounds were isomers.Hence, peak 2 was identified as A7O, while peak 3 and 4 was identified as A7O isomer-1 (A7OI-1) and A7O isomer-2 (A7OI-2), respectively. At all four harvesting time, L7G was the main phenolic compound in SLSG (ranging from 2.01 in T1 to 6.49 mg/g DW in T4), followed by A7O, A7OI-1 and A7OI-2. Additionally, the major phenolic compounds inS. gracilisroots and seeds werep-coumaric acid,chlorogenic acid, caffeic acid, and ferulic acid[38], and chlorogenic acid, L7G and dicaffeoylquinic acid glucoside[2], respectively. This phenomenon indicated that different parts of the plant showed different nutrient composition including polyphenols, which was mainly due to the metabolic pathways’ differences among different parts in plant[39]. Among the four harvesting time, the individual phenolic compounds increased with plant growth, which was the same trend as TP(Fig.3A).
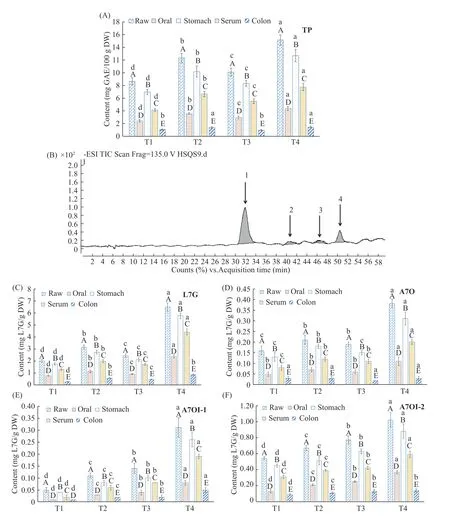
Fig.3 Changes in the polyphenols of S. gracilis stems and leaves with different harvest time during in vitro GI digestion
The digestive characteristics of these four individual phenolic compounds among the four harvest time were similar (Fig.3C~F). The oral release percentage of approximately 20%~38% was observed,and in the stomach, the release percentage ranged from 71%~89%. In the serum, the release percentage ranged from 40%~69%, and in the colon, the release percentage was approximately 8%~20%. L7G showed the highest release percentage, followed by A7O and A7OI-2, while A7OI-1 showed the lowest release percentage.

Table 3 Mass spectral data and contents of the phenolic compounds identified in the SLSG
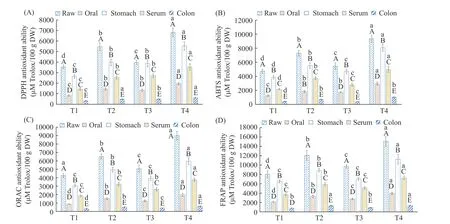
Fig.4 Changes in the antioxidant ability of S. gracilis stems and leaves with different harvest time during in vitro GI digestion
2.4 Comparison of antioxidant capacity among SLSG samples harvested at different time
The positive effects of herbs on human health were always considered to be primarily contributed by the antioxidant substances and the associated antioxidant activities of herbs[10]. Thus, the antioxidant activities of SLSG samples harvested at different time were evaluated, using four methods based on previous reports[20]. In this study, T4 showed the topmost antioxidant activities in all four methods(Fig.4), then T2, T3, and T1. This trend was similar to the levels of polyphenols(Fig.3) and amino acids(Table 1) across the harvest time, mainly because polyphenols[38]and amino acids[40]were the main contributors to the antioxidant activities of herbs.
After thein vitroGI digestion, firstly, no changes occurred among the four harvest time variation trend. During the oral digestion process, the antioxidant capacities were approximately 21%~32%of the original samples. After the stomach digestion process, a larger decrease in the antioxidant capacity relative to the original samples was observed in the ABTS assay (Fig.4B) than in the ORAC assay(Fig.4C) due to differences in the methods[23]. In serum fraction (Fig.4A), the antioxidant capacities of all samples dropped down compared with those in the stomach fraction, mainly because the polyphenols decreased. While the antioxidant capacities of the colon fractions were approximately only 10% of original raws.
2.5 The inhibitory effects of SLSG harvested at different time on α-amylase and α-glucosidase
Through controlling starch breakdown and intestinal glucose absorption by polyphenols, herbs which were rich in polyphenols could manage postprandial hyperglycaemia for type two diabetes in a certain extent[5,45]. SLSG showed a low inhibitory effect onα-amylase, ranging from 3.31% to 4.89%inhibition (Fig.5A), and a very high inhibitory effect onα-glucosidase, ranging from 68.18% to 84.13%inhibition (Fig.5B). This difference might be mainly because of the different interaction mechanisms between SLSG andα-amylase,α-glucosidase[5]. Kwon et al[45]also observed a similar result in wines. Among the four different harvest time, a trend similar to the polyphenols was observed: T4>T2>T3>T1.
During thein vitroGI digestion process, the trends in the variation of the four harvest time samples were also similar. In the oral digestion fraction, approximately 1.12%~1.67% and 13.12%~19.28% inhibition for α-amylase and α-glucosidase,respectively, were observed, which were approximately 33% of the original SLGG inhibition ofα-amylase and 20% of the original SLSG inhibition of α-glucosidase. Then, the inhibition of α-amylase and α-glucosidase greatly increased to 2.89%~4.12%and 58.09%~76.58% in stomach digestion fractions,respectively, which was approximately 85% of the original SLSG inhibition ratios. Then, in the serumavailable fraction, approximately 1.79%~2.38% and 41.09%~58.09% inhibition forα-amylase andαglucosidase were observed; in the colon fractions, the inhibition forα-amylase andα-glucosidase was approximately 0.67%~1.48% and 8.09%~13.28%,respectively.
2.6 The hepatoprotective effect in vitro of SLSG harvested at different time
2.6.1 Cell viability The hepatoprotective effects of SLSG harvested at different time were also evaluatedin vitroby using CCl4to induce injury in BRL hepatocytes. As shown in Fig.6A, after CCl4treatment, the cell viability significantly decreased(30.78%) compared with the normal group (91.33%).In addition, SLSG could markedly increase the percentage of cell viability(P<0.05), with T4 showing the highest increase (63.09%), followed by T2(55.09%), T3 (49.07%) and T1 (44.18%). This increasing trend was similar to the polyphenol trend(Fig.3), which indicated that the hepatoprotective effects of SLSG were mainly contributed by the polyphenols[1-2]. A previous report also observed this phenomenon of a clear dose-dependent effect of polyphenol concentration on cell viability[1].
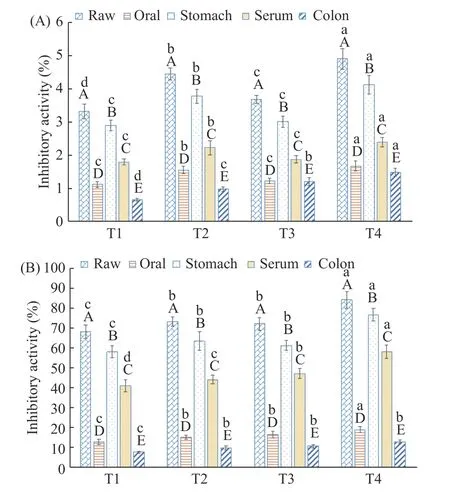
Fig.5 Changes in the inhibitory effects of S. gracilis stems and leaves harvested at different time on α-amylase and αglucosidase during in vitro GI digestion
2.6.2 The AST, ALT and LDH activities LDH level was an effective indicator of apoptosis[46-47], while ALT and AST levels were important hepatic injury indicators[48]. Hence, in addition to cell viability, the AST, ALT and LDH levels were also determined(Fig.6B). After CCl4treatment, the AST (increased by 410%), ALT (increased by 326%) and LDH(increased by 306%) activities significantly increased compared with the normal group. When using SLSG treatment with CCl4injury, all AST, ALT and LDH activities decreased. In addition, there was a marked decreasing trend with harvest time, with T4>T2>T3>T1, which might be the cause of the increased cell viability (Fig.6A) due to improving free radical scavenging, promoting the liver cells’ antioxidant ability and controlling lipid peroxidation[49]. Previous report had proved the hepatoprotective effects of polyphenols[49].The aforementioned hepatoprotective effects, the higher phenolic content, and the significant antioxidant activity of SLSG indicated that SLSG could decrease the level of CCl4-induced BRL hepatocyte damage, as well as protect the liver from CCl4-induced damage.

Fig.6 The hepatoprotective effect in vitro of S. gracilis stems and leaves harvested at different time during in vitro GI digestion.
3 Conclusion
In conclusion, the chemical composition and biological activities of SLSG varied remarkably with harvest time. Harvesting in autumn (T4 and T2)showed higher levels of most nutrients than did harvesting in spring (T3 and T1) (except Mg, Fe, Tyr and His), and the samples harvested in the second year showed higher contents than those harvested in the first year. Throughout thein vitroGI digestion,SLSG showed a good release percentage of most elements (except Mn≤77%). In addition, the release rate of amino acids was little lower than those of most elements, especially Trp, Gly, Pro and Glu, which showed a very low release percentage (approximately 5.82%~11.29%). Regarding polyphenols, L7G and A7O were the main phenolic substances in SLSG, and 48%~55% of TP and 40%~70% of the individual phenolic substances were observed in the serum fraction. SLSG showed a strong antioxidant ability, αglucosidase inhibitory effects and hepatoprotective effectin vitro, and showed a low inhibitory effect on α-amylase. The trends in the variation of these biological activities among the four harvest time were similar to those of polyphenols and amino acids,mainly because the polyphenols and amino acids were the main contributors to those activities. The data from the present study demonstrated that the harvesting time T4 showed better results on most indexes. This was the first research which focused on the variations in the chemical composition and biological activities of SLSG across different harvest time under simulated gastrointestinalinvitrodigestion. With these results, it was hoped to provide some scientific basis for the further development and utilization of SLSG resources. What’s more, further researches are still needed to verify the differences in other bioactive compounds and biological activities across different harvest time,so as to provide basis for the selection of SLSG harvest time and further industrial development and utilization.
