Low thermal expansion and broad band photoluminescence of Zr0.1Al1.9Mo2.9V0.1O12∗
2021-03-19JunPingWang王俊平QingDongChen陈庆东LiGangChen陈立刚YanJunJi纪延俊YouWenLiu刘友文andErJunLiang梁二军
Jun-Ping Wang(王俊平), Qing-Dong Chen(陈庆东), Li-Gang Chen(陈立刚),Yan-Jun Ji(纪延俊), You-Wen Liu(刘友文), and Er-Jun Liang(梁二军)
1Shandong Engineering Research Center of Aeronautical Materials and Devices;Key Laboratory of Aeronautical Optoelectronic Materials and Devices,College of Aeronautical Engineering,Binzhou University,Binzhou 256603,China
2College of Science,Nanjing University of Aeronautics and Astronautics,Nanjing 210016,China
3School of Physical Science&Engineering and Key Laboratory of Materials Physics of Ministry of Education,Zhengzhou University,Zhengzhou 450052,China
Keywords: low thermal expansion,phase transition,x-ray diffraction(XRD),Raman spectrum,luminescence
1. Introduction
The volume of material with positive expansion in nature expands with the increase of temperature. However,this property often leads to failure phenomena such as fatigue and fracture of materials,aging and falling off,and then limits its application in the fields of photoelectric communication, precision machinery,and other precision equipment materials. On the other hand, some materials have opposite properties: expanding when cooled and contracting when heated, and they are named negative thermal expansion materials (NTE). The finding of isotropic negative thermal expansion (NTE) material ZrW2O8(0.3 K-1050 K) in a large temperature range illuminates the way to regulate the expansion coefficient of engineering materials.[1]The negative expansion material has attracted more and more attention due to its special scientific research and application value. At present, the negative expansion materials are the AM2O7series represented by ZrV2O7,[2]the series of magnetic materials represented by Mn3GaN,[3]the A(CN)2series represented by Zn(CN)2,[4]the zeolite series represented by siderolite,[5]the two-dimensional graphite as the representative of graphite.[6]In 1997, a rareearth tungstate or molybdate negative thermal expansion material with A2M3O12(A denotes a valence transition metal,M refers to Mo or W) was reported as chemical general formula and negative thermal expansion materials of vanadate series.[7-10]Among the negative thermal expansion materials with frame structure, A2M3O12series materials are the most stable and widely studied materials. However, the application of A2M3O12series is restricted by two main problems:hygroscopicity and phase transformation.[11-15]In order to solve these two problems, substitutions of tervalent transition elements for A of A2M3O12were performed.[16-27]On the basis of the A2M3O12materials, the trivalent elements at site A were replaced by tetravalent elements and the hexavalent ions at site M were partly replaced by pentavalent ions in order to maintain the valence balance. After the elements at sites A and M in A2M3O12were replaced with the ions with the same or different valences,the expansion coefficient was significantly changed and the phase transition temperature decreased.[28-30]The ZrScMo2VO12,[29]HfScMo2VO12,[31]and HfScW2PO12[32]were designed and they exhibited not only NTE in a relatively wide temperature range but also intense broad-band photoluminescence(PL)covering the visible range. In this study a novel material Zr0.1Al1.9Mo2.9V0.1O12is prepared by the solid-phase sintering process and is crystallized into a monoclinic structure group of P21/a (No. 14)at room temperature (RT). The material shows the better low thermal expansion (LTE) property and the strong broad-band luminescence in almost the whole visible region. Its LTE and white light properties in a wide temperature range suggeste its potential applications in light-emitting diode(LED)and other optoelectronic devices.
2. Experimental procedure
The Zr0.1Al1.9Mo2.9V0.1O12was prepared by the solidphase sintering process with ZrO2(in purity 99%), Al2O3(99%), MoO3(99%), and V2O5(99%) according to the molar ratios of elements. The raw materials were first mixed and ground for 2 h and then pressed into pieces with a thickness of about 10 mm and a diameter of 3 mm-10 mm. After the high-temperature furnace was heated to 973 K, the samples were plased into the furnace, heated for 5 h, and then cooled to RT in the furnace. The samples were sintered twice under the same conditions to obtain target products.
3. Results
3.1. Crystal structure analysis
The crystal structure and lattice constants were obtained from the refinements of x-ray diffraction (XRD) patterns with the Rietveld method (Fig.1). The result shows that Zr0.1Al1.9Mo2.9V0.1O12possesses a monoclinic structure with space group P21/a (ICSD 01-084-1652) at RT. The refined cell parameters of Zr0.1Al1.9Mo2.9V0.1O12are as follows: a=15.386 ˚A,b=9.042 ˚A,c=17.875 ˚A,V =1014.322 ˚A3,α=90◦,β =125.457◦,γ=90◦,Rexp=2.82%,and Rwp=8.24%,Rp=5.88%.
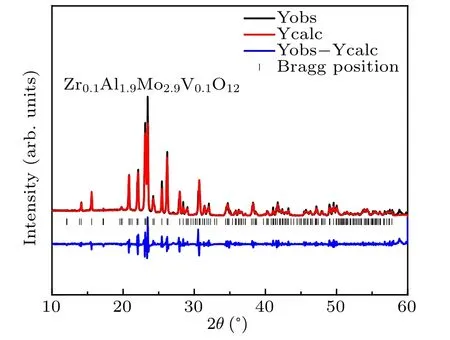
Fig.1. The results of the Rietveld analysis of the XRD pattern forZr0.1Al1.9Mo2.9V0.1O12.
Figure 2 shows the Raman spectra of Al2Mo3O12and Zr0.1Al1.9Mo2.9V0.1O12at RT. From the figure we can see the variations of Raman vibration modes with the doping of Zr4+ions and V5+ions. The Raman peaks at 1050 cm−1-900 cm−1are ascribed to the internal symmetric stretching vibration (ν1) of the MoO4or VO4tetrahedron. The Raman peaks at 900 cm−1-750 cm−1are attributed to the asymmetric stretching vibration(ν3)of the MoO4or VO4tetrahedron.The Raman peaks at 400 cm−1-320 cm−1are arise from the bending vibrations (ν2and ν4) of the MoO4or VO4tetrahedron, and those peaks below 300 cm−1are stemed from the translational and librational motions of the AlO6or ZrO6polyhedron.[33-35]There are obvious changes in the Raman spectra of Zr0.1Al1.9Mo2.9V0.1O12that the Raman peaks at 662 cm−1and 975.91 cm−1disappear, but the new Raman peaks at 747 cm−1and 947.7 cm−1appear. The Zr4+/V5+ion substitution promotes the lattice and asymmetric stretching vibrations of Al2Mo3O12,and the thermal change in Mo-O distance in the lattice,results in the shift of the Raman peak.

Fig.2. Raman spectra of(a)Zr0.1Al1.9Mo2.9V0.1O12 and(b)Al2Mo3O12.

Fig.3. Temperature-dependent Raman spectra of Zr0.1Al1.9Mo2.9V0.1O12 from(a)50 cm−1 to 200 cm−1 and(b)200 cm−1 to 1200 cm−1.
The Raman spectra can be used to sensitively distinguish the structural changes of A2M3O12from monoclinic phase to orthorhombic phase. For analyzing the structure of Zr0.1Al1.9Mo2.9V0.1O12at low temperature and determining its phase transition temperature, we measure the Raman spectra of Zr0.1Al1.9Mo2.9VO12from 298 K to 493 K. It can be seen that the Raman spectra of Zr0.1Al1.9Mo2.9VO12are basically unchanged from 298 K to 453 K from Fig.3.When the temperature reaches 463 K, the Raman spectrum peak at 1025 cm−1which is the characteristic Raman peak of monoclinic structure, disappears. The Raman peak at 380 cm−1gradually splits into two peaks at 370 cm−1and 382 cm−1. These changes further indicate that the monoclinic structure of Zr0.1Al1.9Mo2.9V0.1O12is maintained until the temperature increases to at least 463 K. The crystal of Zr0.1Al1.9Mo2.9V0.1O12changes from monoclinic to orthorhombic structure phase at about 463 K.
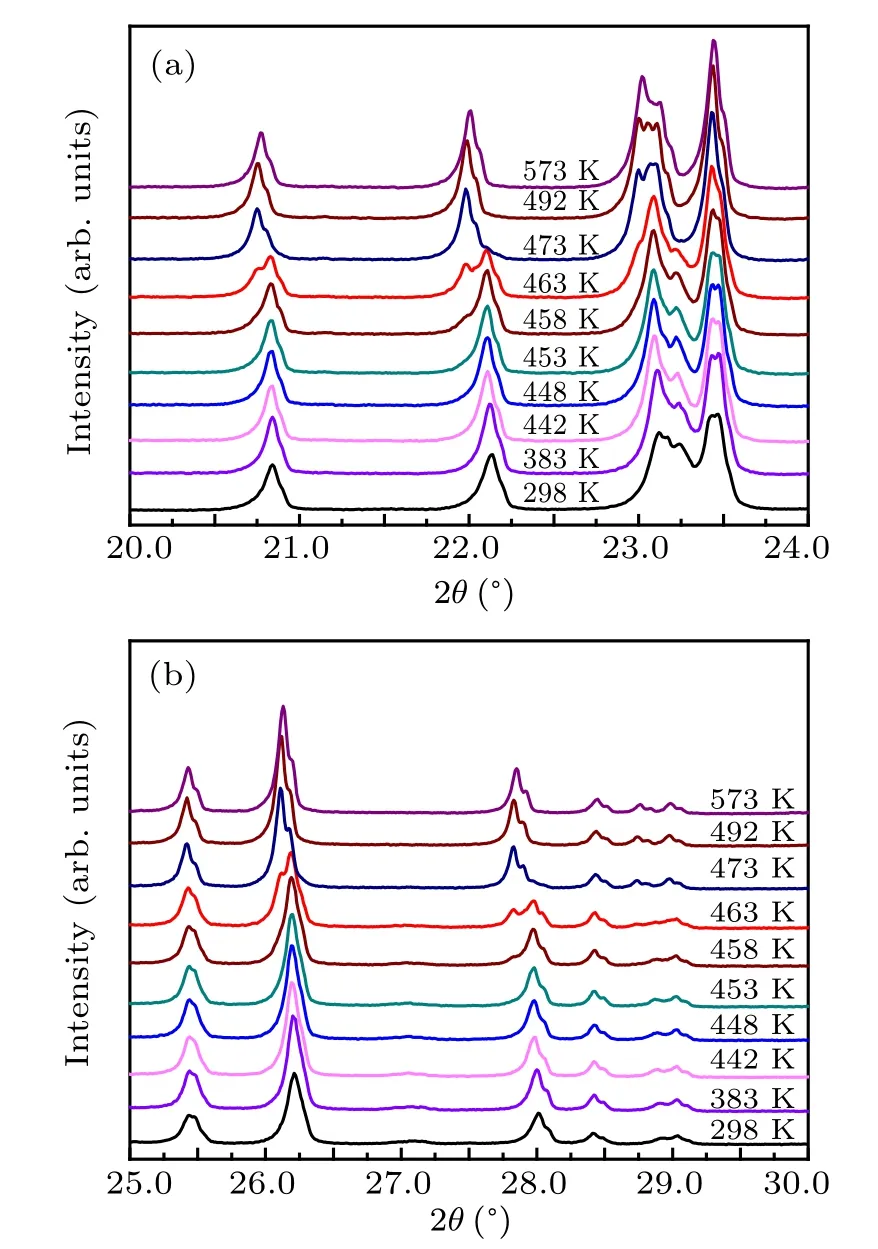
Fig.4. (a) XRD patterns of Zr0.1Al1.9Mo2.9V0.1O12 at different temperatures,and(b)their partial magnification.
The variable temperature XRD measurements of sample at different temperatures are used to explore the LTE property and structural transformation of Zr0.1Al1.9Mo2.9V0.1O12.The experimental results are shown in Fig.4. The diffraction peak near 25◦is considered as the characteristic diffraction peak of Zr0.1Al1.9Mo2.9V0.1O12with a monoclinic structure.With the increase in temperature, the intensity of the diffraction peak near 25◦decreases gradually until it disappears completely when the temperature goes up to at least 463 K,which is shown in Fig.4(b). It can also be seen that the diffraction peaks at 22.11◦and 27.96◦are significantly changed at 463 K. These results further show that the lattice constant of Zr0.1Al1.9Mo2.9V0.1O12material changes at 463 K.The result is consistent with the dilatometer and high-temperature Raman spectrum results, indicating that the Zr0.1Al1.9Mo2.9V0.1O12exhibits the orthorhombic phase at 463 K.

Fig.5. Variations of lattice constants and cell volume with temperature of Zr0.1Al1.9Mo2.9V0.1O12 at temperature ranging from RT to 600 K.
Lattice constants and volumes of Zr0.1Al1.9Mo2.9V0.1O12under different temperatures are calculated based on Rietveld analysis(Fig.5).The tested temperature in a ranged of 300 K-463 K (phase transition temperature) and 463 K-673 K. The thermal expansion coefficients of a,b,and c axes from 300 K to 463 K are calculated to be αa= −2.16×10⁻⁵K−1,αb= 1.78×10⁻⁵K−1, and αc= −1.06×10⁻⁵K−1, respectively. The volume thermal expansion coefficient αV=2.77×10⁻⁵K−1and the linear thermal expansion coefficient αl=αV/3=9.23×10−6K−1from 300 K to 463 K.When the temperature increases to 463 K, the Zr0.1Al1.9Mo2.9V0.1O12changes from monoclinic phase to orthorhombic phase. The coefficient of thermal expansion (CTE) of Zr0.1Al1.9Mo2.9V0.1O12from 463 K to 600 K are calculated to be αa=8.73×10⁻⁶K−1,αb=−6.06×10⁻⁶K−1,αc=−1.53×10⁻⁶K−1,αV=4.89×10⁻⁶K−1, and αl=αV/3=1.63×10−6K−1,respectively. The Zr0.1Al1.9Mo2.9V0.1O12has good LTE performance from 463 K to 600 K.
The Zr0.1Al1.9Mo2.9V0.1O12can be considered as a deformation of Al2Mo3O12by replacing Al3+with Zr4+and replacing Mo6+with V5+in order to maintain charge balance. The orthorhombic Zr0.1Al1.9Mo2.9V0.1O12is a frame work structure with corner-shared ZrO6/AlO6octahedron and VO4/MoO4tetrahedron. Each ZrO6/AlO6octahedron shares all the angles with six VO4/MoO4tetrahedrons and each VO4/MoO4tetrahedron shares all the angles with four ZrO6/AlO6octahedrons. The negative thermal expansion of orthorhombic structure is caused by bending the M-O-A bond.The transverse vibration of bridge oxygen atom leads the MO-A chain to be bent. The phase transition temperature and thermal expansion property of Zr0.1Al1.9Mo2.9V0.1O12are related to the electronegativity of cations. The electronegativity of Zr4+(1.33 Pauling) is lower than that of Al3+(1.61 Pauling), and the electronegativity of V5+(1.63 Pauling)is lower than that of Mo6+(1.8 Pauling). The zero thermal expansion(ZTE) and variation of CTE are attributed to the difference in electronegativity between Zr4+/V5+and Al3+/Mo6+. Once Zr4+/V5+replaced Al3+/Mo6+ions in the lattice,the balance among the surrounding six MoO4tetrahedron electron clouds is broken. The effective negative charge of oxygen anionincreases,thus resulting in the increase in oxygen-oxygen repulsion. So the attraction to the surrounding MoO4(VO4)tetrahedron is weak and the Mo-O bond is strengthened to form a harder polyhedron. The bending degree of the Al-O-Mo(V)or Al(Zr)-O-Mo bond is less than that of the Al-O-Mo bond,thus Zr0.1Al1.9Mo2.9V0.1O12exhibits the better LTE property.
3.2. Thermal expansion characteristic
The LTE property of Zr0.1Al1.9Mo2.9V0.1O12is studied by dilatometer. Figure 6 shows the variation of the relative length of Zr0.1Al1.9Mo2.9V0.1O12cylinder with temperature from 298 K to 700 K. The phase transition temperature of Zr0.1Al1.9Mo2.9V0.1O12is about 463 K. The CTE of Zr0.1Al1.9Mo2.9V0.1O12is obtained to be 2.17×10⁻⁶K−1from 463 K to 781 K and exhibits the LTE property. The results are well consistent with the XRD measurements at different temperatures.The variation of the relative length measured by a dilatometer could sensitively reflect the phase transformation and the release process of crystal water. The very smooth linear thermal expansion curve in Fig.6 shows that the material has no hygroscopicity from 298 K to 700 K.
The linear expansion coefficient calculated by the XRD patterns at different temperatures is slightly larger than that directly measured with the dilatometer. The CTE calculated with the XRD patterns at different temperatures reflects the intrinsic thermal expansion of crystal cells, whereas the dilatometer measures the macroscopic expansion coefficient of the bulk sample. The microstructure has a certain influence on the thermal expansion of block material. The linear CTE calculated with the variable temperature XRD patterns is slightly larger than that measured with the dilatometer, indicating that the external effect has the negative contribution to the linear CTE.
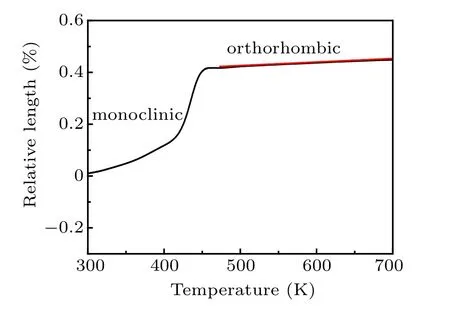
Fig.6. The variation of the relative length with temperatures of Zr0.1Al1.9Mo2.9V0.1O12.
In order to explore the hydroscopicity of the material,the thermal analysis test is carried out for Zr0.1Al1.9Mo2.9V0.1O12.Figure 7 shows the thermo gravimetry (TG)/digital security controls (DSC) curve from RT to 873 K. It can be seen that the TG curve of the sample and the weight of the sample have no change basically in a temperature range from about 300 K to 873 K. The results further illustrate that the Zr0.1Al1.9Mo2.9V0.1O12has no water absorption. There is an exothermic peak at 463.33 K, which indicates that the Zr0.1Al1.9Mo2.9V0.1O12changes from monoclinic phase to orthorhombic phase at 463.33 K, which is consistent with the previous result of the XRD and the Raman analysis at different temperatures.

Fig.7. The curve of the DSC and heat flow versus temperatures of Zr0.1Al1.9Mo2.9V0.1O12 in a temperature range from RT to 873 K.
Figure 8(a)shows the image of scanning electron microscope (SEM) of Zr0.1Al1.9Mo2.9V0.1O12. Figures 8(b)-8(d)display the energy dispersive spectrometer (EDS) spectra at the corresponding locations.Most of samples are composed of polyhedrons with good crystallinity(Fig.8(a)). Table 1 shows the content of Al,Zr,Mo,V,and O elements(%). From Fig.8 and Table 1, it can be seen that the Zr0.1Al1.9Mo2.9V0.1O12contains only five elements of Al,Zr,Mo,V,and O and there are no other impurity elements. The element ratio in the sample is close to the molar ratio of elements in the compound Zr0.1Al1.9Mo2.9V0.1O12.
The density of Zr0.1Al1.9Mo2.9V0.1O12is measured by the Archimedes drainage method. The density of Zr0.1Al1.9Mo2.9V0.1O12synthesized by solid-state sintering is 3.52 g/cm3and its theoretical density is 3.24 g/cm3. The compactness of the composite can increase and reach 92.05%.Comparing with the above XRD analysis, it can be seen that Zr0.1Al1.9Mo2.9V0.1O12has high purity and density.
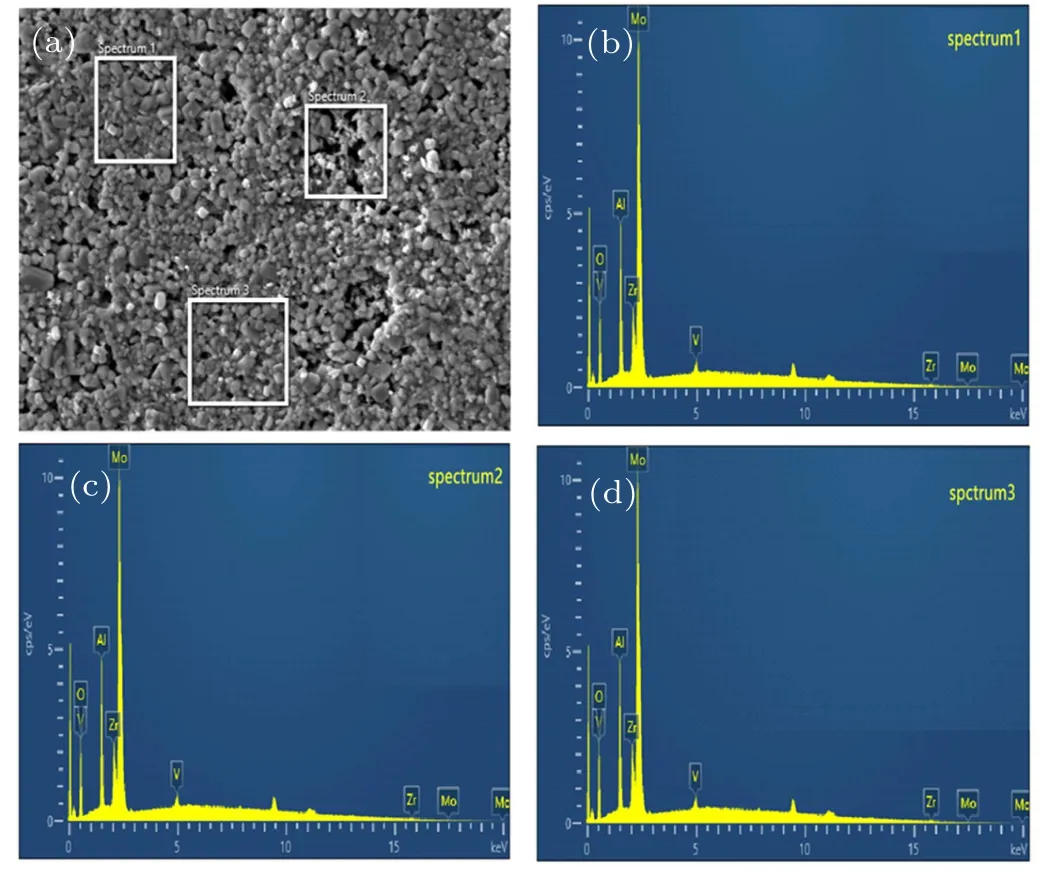
Fig.8. (a)SEM image and((b)-(d))energy dispersive spectrometer results of Zr0.1Al1.9Mo2.9V0.1O12.
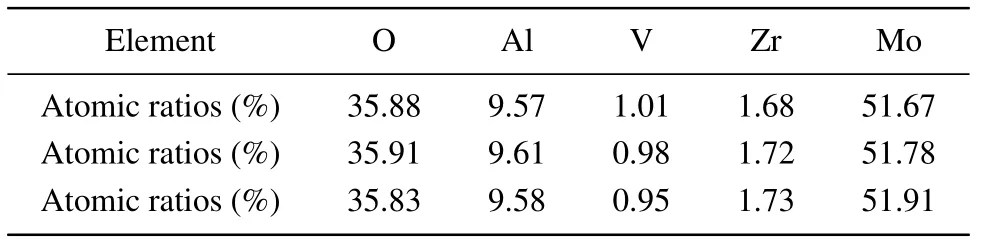
Table 1. Atomic ratios of O, Al, V, Zr, and Mo at three positions in Zr0.1Al1.9Mo2.9V0.1O12 (%).
3.3. Luminescence mechanism of Zr0.1Al1.9Mo2.9V0.1O12
Figure 9 shows the UV visible absorption spectra of Zr0.1Al1.9Mo2.9V0.1O12at RT and corresponding calculated bandgap. The peak value of the UV absorption spectrum around 280 nm and the optical bandgap can be estimated with the UV absorption spectrum according to Tauc equation as follows:[36]

where α is the absorption coefficient, h is the Planck constant, and A is the proportional constant. The bandgap of the material can be calculated from Fig.9(b). The band gap of Zr0.1Al1.9Mo2.9V0.1O12at RT is calculated to be 2.75 eV.

Fig.9. (a) UV-vis absorption spectrum at RT, and (b) band gap estimation from absorption spectrum of Zr0.1Al1.9Mo2.9V0.1O12.
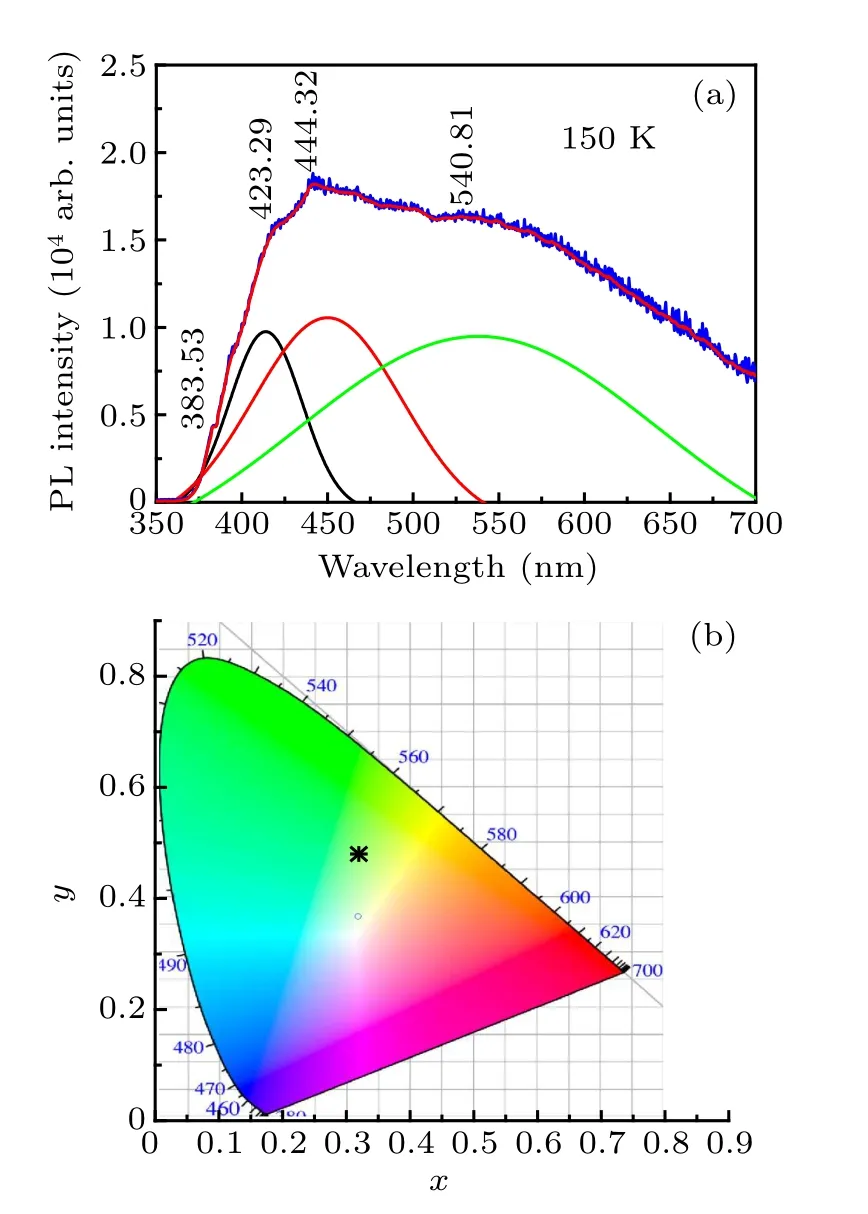
Fig.10.(a)PL spectra of Zr0.1Al1.9Mo2.9V0.1O12 with 295-nm excitation at 150 K(PL spectrum deconvolution into two narrow and one broad bands),and (b) commission Internationale de I’Eclairage (CIE) chromaticity coordinates of PL.
The PL spectra of Zr0.1Al1.9Mo2.9V0.3O12are investigated by photoluminescence spectra under the excitation of 295 nm at 150 K (Fig.10). The PL spectrum could be deconvoluted into three narrow bands and one broad band. The narrow emission peaks are located at 383.53 nm, 423.29 nm,and 444.32 nm, while the other wide emission peak is located at 540.81 nm. The material emits strong pale green light and the clear visible light, which can be observed with naked eyes. The Zr0.1Al1.9Mo2.9V0.3O12exhibits very strong wide band luminescence characteristic from 370 nm to 650 nm covering almost the whole visible light region.In order to visually observe the luminescence performance of Zr0.1Al1.9Mo2.9V0.1O12at RT, we draw the color coordinates under different doping conditions. As can be seen from Fig.10(b) that the Commission Internationale de I’Eclairage(CIE)chromaticity coordinates of Zr0.1Al1.9Mo2.9V0.1O12are located in the green region.
Figure 11 shows that the three narrow luminous peaks basically remaining unchanged and the wide spectrum at 540.81 nm has a significant blue shift with the increase in temperature. This is because the interaction between donor and acceptor pair of monoclinic phase truns to relate to the distance between them with the decrease of temperature.Because the donor acceptor pairs have different distances,there appear different interaction intensities between donors and acceptors located in the center of polyhedron in the lattice,which may be the reason for the broadening of fluorescence peak. The very strong photoluminescence spectrum of the material is the intrinsic luminescence of the material itself, which implies that there is a direct band gap in the material.

Fig.11. (a)PL spectra of Zr0.1Al1.9Mo2.9V0.1O12 at different temperatures and(b)position of PL peak varying with temperature.
The PL spectra of ZrxAl2−xMo3−xVxO12(x=0.0, 0.1,0.2, 0.3, and 0.4) are investigated under the excitation of 295 nm (Fig.12). The ZrxAl2−xMo3−xVxO12(x=0.0, 0.1,0.2, 0.3, and 0.4) exhibit strong broad-band luminescence characteristics. The luminescence wavelengths range from 370 nm to 650 nm, covering almost the whole visible region.A wide green emission band occurs at 530 nm,and the luminescence intensity becomes stronger with the increase in doping amount.
Previous studies have found that the luminescence of A2M3O12series material was very weak. The optical properties of the material are improved by doping Zr4+and V5+ions, and the materials emit strong light over a wide temperature range. The abundant physical energy of the material Zr0.1Al1.9Mo2.9V0.1O12is ascribed to its special structure. The strong multi-band luminescence is attributed to the co-doping effect of n-type and p-type based on Al2Mo3O12.One Al3+ion in Al2Mo3O12is replaced by one Zr4+ion,and Mo6+ion is replaced by a V5+ion to maintain the balance of charge. This substitution triggers the functions of n-type and p-type co-doping in semiconductors. The n-type doping and p-type doping generate donor state(D)and acceptor state(A) between valence band (VB) and conduction band (CB),respectively. It can be inferred that the fluorescence peak at 383.53 nm corresponds to the band side transition from CB to VB, the fluorescence peak at 423.29 nm and 444.32 nm correspond to the transition from CB to acceptor level (EA) and from donor level(ED)to VB,respectively,and the wide emission peak near the wide band at 540.81 nm which is dependent on the change of temperature, can be mainly attributed to the energy level transition of donor acceptor pair(DAP).

Fig.12. PL spectra of ZrxAl2−xMo3−xVxO12 (x=0,0.1,0.2,0.3,and 0.4)under 295-nm excitation.
The interaction between donor acceptor pairs is related to the size of their spacing, because there are donor acceptor pairs with different spacings, they are located in different polyhedral centers in the lattice. There are different intensities between the donor and the acceptor, which might be the reason for broadening the fluorescence peak. The distance between donor and acceptor changes with temperatures.According to the basic characteristics of donor acceptor pair luminescence, the shift of DAP peaks with temperature rising can be explained by the following equation:

Equation(2)shows that different DAP has a different distance,and the energy of photon emitted is also different. In Eq.(2),Egis the band gap of semiconductor,EDand EAare the binding energies of donor and acceptor respectively,εris the static field dielectric coefficient of crystal, and r is the distance between donor and acceptor. With the decrease of temperature,Zr0.1Al1.9Mo2.9V0.1O12has a monoclinc structure at low temperature,and the material exhibits positive thermal expansion characteristics. With the decrease of temperature,the distance between donor and recipient becomes smaller, and the luminous energy moves towards the direction of high energy, so the luminous peak at 540.81 nm is blue-shifted.
4. Conclusions
A new kind of novel material Zr0.1Al1.9Mo2.9V0.1O12is synthesized by the traditional high temperature solid synthesis method. This material shows an excellent LTE property in a wide temperature range and has strong broad band luminescence covering almost the whole visible region. Structure analysis shows that Zr0.1Al1.9Mo2.9V0.1O12is crystallized into a monoclinic structure group of P21/a (No. 14) at RT and changes from monoclinic phase to orthorhombic phase belonging to the group of Pbcn (No. 60) at 463 K. The Al3+and Mo6+are replaced in Al2Mo3O12,respectively, by Zr4+and V5+,resulting in Zr0.1Al1.9Mo2.9V0.1O12that exhibits the lower anisotropy in orthorhombic phase and shows an LTE over a wide temperature range. Its excellent LTE and pale green light properties in a wide temperature range indicate its potential applications in LED and other optoelectronic devices. Meanwhile, this co-doping effect generates the unique electronic property and lays the foundation for further studying its special optical and electrical properties.
杂志排行

Chinese Physics B的其它文章
- Transport property of inhomogeneous strained graphene∗
- Beam steering characteristics in high-power quantum-cascade lasers emitting at ~4.6µm∗
- Multi-scale molecular dynamics simulations and applications on mechanosensitive proteins of integrins∗
- Enhanced spin-orbit torque efficiency in Pt100−xNix alloy based magnetic bilayer∗
- Soliton interactions and asymptotic state analysis in a discrete nonlocal nonlinear self-dual network equation of reverse-space type∗
- Discontinuous event-trigger scheme for global stabilization of state-dependent switching neural networks with communication delay∗