Experimental Investigation of Wave Load and Run-up on the Composite Bucket Foundation Influenced by Regular Waves
2021-03-06YUTongshunZHAOZishuaiSHIZhongyuandXUYu
YU Tongshun,ZHAO Zishuai, SHI Zhongyu, and XU Yu, 2)
Experimental Investigation of Wave Load and Run-up on the Composite Bucket Foundation Influenced by Regular Waves
YU Tongshun1), 2), 3), *,ZHAO Zishuai1), SHI Zhongyu1), and XU Yu1), 2)
1)College of Engineering, Ocean University of China, Qingdao 266100, China 2)Shandong Provincial Key Laboratory of Ocean Engineering, Qingdao 266100, China 3)State Key Laboratory of Hydraulic Engineering Simulation and Safety, Tianjin University, Tianjin 300072, China
In the design of wind turbine foundations for offshore wind farms, the wave load and run-up slamming on the supporting structure are the quantities that need to be considered. Because of a special arc transition, the interaction between the wave field and the composite bucket foundation (CBF) becomes complicated. In this study, the hydrodynamic characteristics, including wave pressure, load, upwelling, and run-up, around the arc transition of a CBF influenced by regular waves are investigated through physical tests at Shandong Provincial Key Laboratory of Ocean Engineering, Ocean University of China. The distributions of the wave pressures and upwelling ratios around the CBF are described, and the relationship between the wave load and the wave parameters is discussed. New formulae based on the velocity stagnation head theory with linear wave theory and the second-order Stokes wave theory for wave kinematics are proposed to estimate the wave run-up. Moreover, the multiple regression method with nonlinear technology is employed to deduce an empirical formula for predicting run-up heights. Results show that the non-dimensional wave load increases with the increase in the values of the wave scattering parameter and relative wave height. The wave upwelling height is high in front of the CBF and has the lowest value at an angle of 135˚ with the incoming wave direction. The performance of the new formulae proposed in this study is compared using statistical indices to demonstrate that a good fit is obtained by the multiple regression method and the analytical model based on the velocity stagnation head theory is underdeveloped.
physical experiment; composite bucket foundation; wave load; wave run-up; regular waves
1 Introduction
Offshore wind energy has considerable potential for sus- tainable development (Pérez-Collazo, 2015). In the design of offshore wind farms, the foundations and supporting structures are usually considered a priority. In offshore wind farms developed in the past decade in China, monopile, gravity-based, and jacket foundations, and so on,have been utilized for soft clay, silty clay, fine sand, or sandy silt soils (Zhang, 2016). Researchers have focused on the wave loads on ocean structures, which can overturn the supporting structure and result in economic loss. Recently, wave run-up along the structure has become a key concern. The accuracy of the estimation of wave run-up may be beneficial for avoiding serious wave impacts on platforms and boat landing facilities, even in harsh environments.
Recently, a new type of offshore foundation,, thewide and shallow composite bucket foundation (CBF), has been proposed for soft clay by Lian(2011, 2012) because of its advantages of lower construction cost and shorter construction period than traditional bucket foundations (see Fig.1). CBFs have been successfully installed at the offshore wind farms in Qidong City, Xiangshui City,and Dafeng City in China. Previous literature on CBFs was mainly concerned with installation techniques (Zhang, 2016), local scour (Yu, 2016, 2019), and the theoretical analysis of the velocity potential function undershort-crested waves (Wang, 2018). However, a unique supporting structure in the form of a large-scale arc transition may lead to hydrodynamic characteristics around the foundation that differ from those of traditional types of foundations. Therefore, it is imperative to investigatethe wave load and run-up heights on the CBFs by means of physical tests and conduct investigations referring to the methods for other types of foundations, such as the single-pile foundation.
To investigate wave load and run-up when designing coastal and offshore structures, laboratory experiments have been the main method for examining the hydrodynamic characteristics (Niedzwecki and Duggal, 1992; Shan, 2011; Li, 2012, 2014). Moreover, numerical methods have been used to build wave patterns for analyzing wave forces and other hydrodynamic characteristics (Stockdon, 2014; Zhang and Teng, 2017). Niedz- wecki and Duggal (1992) performed a small-scale physi-cal experiment to investigate wave run-up and forces on cylinders influenced by regular and random waves. The results of their study showed that the increasing trend of the maximum in-line force as a function of the scattering parameter declined above a scattering parameter value of approximately 0.75. Roy and Ghosh (2006) experimentally investigated the wave force on three types of submerged circular thin plates in shallow water using the linear wave theory. They determined that the total non-dimensional horizontal wave force increased with the dimensionless wave amplitude, and the wave amplitude was normalized by the water depth. In the study of Xiao and Huang (2008), one part of the test problem regarding wave forces on a vertical wall for a solitary wave was discussed. Wang and Sun (2010) presented a novel floating breakwater and examined the force influenced by linear waves in the wave flume. Shan(2011) conducted an experimental investigation of wave run-up on columns and discussed the influence of the wave steepness parameter on wave run-up. Li(2014) experimentally investigated the interactions between multidirectional focused waves and a vertical circular cylinder. It was found that the non-dimensionalhorizontal wave forces increased with the increase in wave scattering and decreased with the increase in wave steepness.
Lin(2017) conducted a numerical simulation of wave run-up heights and loads on three types of wind turbine foundations,, monopile, gravity-based, and tripod supporting structures, influenced by nonlinear waves. Using the Ansys Fluent® computational software, they foundthat the maximum wave force on the foundation decreased with the increase in wave steepness. However, the maximum wave run-up increased with the increase in wave steepness for each structure. Their simulation of the three types of foundations showed that the maximum wave run-up was influenced significantly by the type of foundation. Wang(2018) proposed analytical solutions for the wave pressure, run-up, and force on a CBF influenced by short-crested, cnoidal, and solitary waves. They foundthat the distribution of the short-crested wave run-up on a CBF is quite different from that of the plane incident wave run-up, which is affected by the wave phase. However, the analytical solutions for waveforces were observed to be beneficial only for short-crested waves in shallow water. In addition to offshore wind turbine foundations, wave loads and run-up on other types of ocean engineering structures were similarly investigated (Roy and Ghosh, 2006; Buccino, 2015; Ning, 2017).
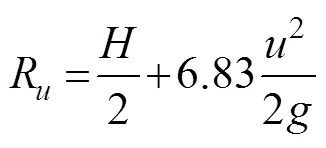
To estimate the wave run-up precisely, empirical and semiempirical formulae have been proposed by many researchers. One of the most typical theories is the velocity stagnation head theory pioneered by Hallermeier (1976). According to this theory, wave run-up along a structure can be expressed as kinetic energy that is converted into potential energy when the wave hits the structure and rises to a height of2/(2), whereis the horizontal water particle velocity andis the gravitational acceleration. The formula for wave run-upRon vertical piles can be expressed as follows:

wheremaxis the maximum wave crest elevation andis the adjustment coefficient. For long waves, Hallermeier (1976) pointed out thatshould be equal to 1. Niedzwecki and Duggal (1992) experimentally investigated wave run-up on vertical piles influenced by regular and irregular waves. On the basis of the velocity stagnation head theory, wave kinematics was calculated using the linear wave theory. The value ofwas calibrated, and a new formula was proposed, as follows:
In their later study, Niedzwecki and Huston (1992) obtained different results formaxandwhen a linear fit was employed. The corresponding formula was givenas follows:

De Vos(2007) performed experiments on wave run-up on cylindrical and cone-shaped foundations influenced by regular and irregular waves. To predict the wave run-up heights, the adjustment coefficientwas calibrated for irregular waves, with the wave kinematics calculated using the second-order Stokes wave theory. However, the adjustment coefficientwas set to 1 when applying the second-order Stokes wave theory to the wave kinematics of regular waves.
The research of Lykke Andersen and Frigaad (2006) showed that the adjustment coefficientis equal to 4 and 3 when the high and low wave steepness values are 0.02 and 0.035 in irregular waves, respectively. Lykke Andersen(2011) discussed the influence of dimensionless parameters by reanalyzing the data of De Vos(2007), which consist of the water depth to cylinder diameter ratios and relative wave height, on the adjustment coefficient. The influence of these dimensionless parameters on the adjustment coefficient was not as significant as expected. Myrhaug and Holmedal (2010) provided a practical me- thod for estimating the wave run-up height on a slender cylindrical foundation influenced by random waves. Considering the consistency in the application of the second-order Stokes wave theory, they foundthat the reconstructed formula was not improved significantly compared with the data measured by De Vos(2007).
Recently, Kazeminezhad and Etemad-Shahidi (2015) investigated wave run-up on vertical piles under regular and irregular waves by means ofa machine learning me- thod. In contrast to the velocity stagnation head theory, the relative wave height and wave steepness as the governing parameters were determined to estimate the relative wave run-up height. The predicted formulae were obtained using a combination of the M5 model tree (M5- MT) and the introduction of logarithms, as follows:


where0is the deepwater wavelength andis the water depth. Similarly, Bonakdar(2016) investigated wave run-up on a slender pile influenced by regular waves by conducting small-scale experiments. They proposed prediction formulae using M5MT and nonlinear regression techniques based on the parameters of relative wave height, relative water depth, and slenderness of the pile. Previous studies (Kazeminezhad and Etemad-Shahidi, 2015; Bonak- dar, 2016) have attempted to establish general rules and obtain empirical formulae based on the data set. However, the application of the M5MT algorithm does not involve a theoretical background.
Numerous studies have emphasized the interaction between the wave and the structure in connection with conventional ocean engineering, whereas only a few studies have paid attention to the CBF. There are no published studies on the systematic experimental investigation of wave load and run-up on a CBF. In the present study, wave force and run-up heights on a small-scale CBF model influenced by regular waves are investigated through laboratory experiments. The tests covered limited experimental programs in an intermediate water depth by employing the change of water depth. Notably, the range of hydrodynamic conditions is not as small as expected.
This study mainly focuses on two parts,, 1) the characteristics of wave pressure and force on the CBF model and 2) the wave upwelling and run-up height formulae. This paper is outlined as follows: In Section 2, the experimental setup, including the model configuration and deployed transducers and wave gauges, is introduced. Subsequently, the wave conditions and test procedures are stated. In Section 3, the results of wave pressure and force on the CBF model are analyzed. Moreover, a new formula for predicting wave run-up is deduced using multiple regression with nonlinear techniques. A comparison between the formulae based on the velocity stagnation head theory with linear wave theory and the formulae based on the second-order Stokes wave theory for wave kinematics is made. Finally, the key conclusions regarding a CBF influenced by regular waves are drawn in Section 4.
2 Experimental Setup and Measurements
2.1 Details of the Wave Flume and Model
The laboratory experiments were conducted in the wave flume of Shandong Provincial Key Laboratory of Ocean Engineering, Ocean University of China. The wave flume, with a length of 60.0m, a width of 3.0m, and a depth of 1.5m, was equipped with a wave-maker system on one side of the flume, which can generate periodic wave trains. On the other side of the flume, wave absorbers were installed to absorb the energy of incoming waves and avoid wave reflection.
In real-world applications, the circular concrete foundation of a CBF that supports the arc transition, which is 30m in diameter and 6m in height, is fully buried in the seabed soil. The arc transition of a CBF (Arc-CBF), which was subjected to wave force and height variations influenced by wave action, was investigated in the present study. Finally, the scale of the prototype structure of an arc transition model with a thickness of 14mm was selected to be 1:40 (Fig.1). The Arc-CBF, with a height of 0.375m and a radius of 0.520m, is made of nylon rod. The base and top diameters of the Arc-CBF (andt) are 0.500 and 0.120m, respectively. A sketch of the model is shown in Fig.2.

Fig.1 Prototype of a CBF.

Fig.2 Sketch and dimensions of the Arc-CBF.
2.2 Transducers for Wave Pressure and Force
To evaluate wave pressure on the Arc-CBF model, 30 piezoresistive pressure transducers were mounted perpendicular to the outer surface from the inner wall of the model, according to the scheme shown in Fig.3(a). The screw threads, with a diameter of 8mm and a length of 10mm, were distributed on the side of the CBF; hence, these pressure transducers were screwed into the preinstalled hole in the model shown in Fig.3(b). These pressure transducers were placed to measure the point pressure at 0˚, 36˚, 72˚, 108˚, 144˚, and 180˚ considering the symmetry of wave propagation. Note that each of these directions was fitted with five pressure transducers with a vertical distance of 0.06m between the centers of two transducers, and the lowest position of the transducer in each direction was 0.03m from the bottom of the Arc-CBF (see Fig.2). Fig.4 shows how these pressure transducers are labeled.
The total non-dimensional horizontal wave forceFwas obtained using a two-dimensional force sensor, which can simultaneously measure the concentrated force in two directions orthogonal to each other under the influence of wave action. In fact, the wave forceFiswas adopted for data analysis by using the average of half the difference between the wave crest and the adjacent wave trough in a wave force time series. Moreover, the number of wave force events calculated for the average was selected as 8. The-axis of the two-dimensional force sensor was mount- ed in the centerline at the top of the CBF (Fig.2).

Fig.3 Experimental setup of wave pressure transducers in the wave flume.

Fig.4 Plan view of the Arc-CBF and wave pressure transducer placements.
2.3 Wave Gauges and Description of Wave Run-up
To obtain wave height and period events during wave propagation, 32 wave gauges were located around the CBF to measure the wave surface in the experiments. These wave gauges were deployed in a series of 6, labeled Rows A, B, C, D, and E, at 0˚, 45˚, 90˚, 135˚, 180˚, and 315˚, respectively, as shown in Fig.5. The horizontal distances between the wave gauges and the top outer edge of the model are listed in Table 1. Similar to wave gauges A1
and A2, two other wave gauges deployed closest to the CBF cannot measure regular wave train data of the free surface elevation because of the structure of the Arc-CBF. The position of the two wave gauges closest to the CBF cannot be mounted to a sufficient depth, whereas the maximum wave height events can be measured by the two wave gauges closest to the CBF in each direction.
The wave run-up heights are defined as the green water,, level A as defined by Ramirez(2013), on the surface of the foundation model. The splash would not be considered in the present study for green water (thick layer). The marking tape was installed on the CBF wall at 0˚ to measure the maximum run-up data. Therefore, a video camera was used to identify wave run-up heights and splash during all of the laboratory tests. Taking Case 1 (=0.25m,=0.06m,=1s) as an example, the side view image of a process including wave run-up and run-down between one wave train and the CBF model is presented in Fig.6.
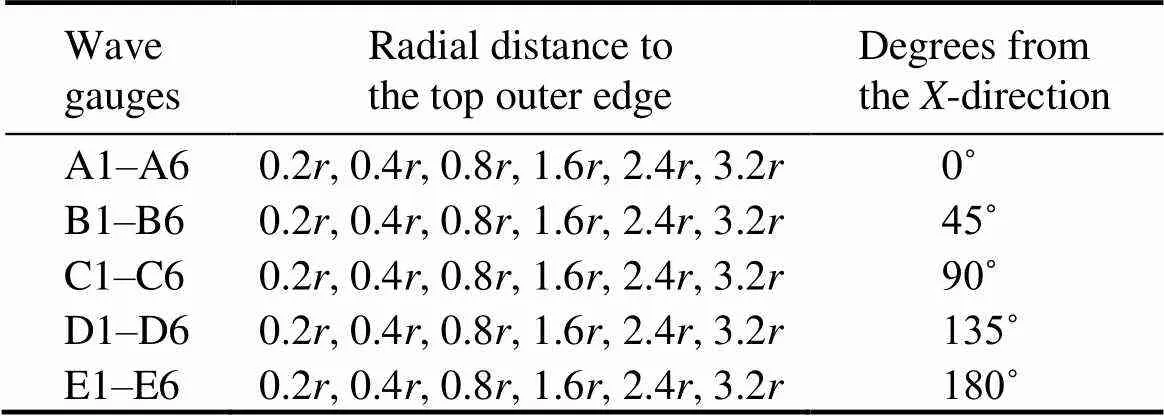
Table 1 Description of wave gauge positions installed in the model test
Note:is half the top diameter of the Arc-CBF model (D).

Fig.5 Experimental setup of wave gauge transducer placements.
2.4 Wave Conditions and Procedure
All of the wave conditions are listed in Table 2. The test was conducted in regular waves, which vary from 0.20m to 0.30m in water depth, from 0.04m to 0.12m in wave height, and from 1.0s to 1.8s in wave period. In the present study, each experimental case was repeated three times to avoid operational errors in the experiment. As mentioned previously, the obtained wave run-up heights were analyzed on the basis of the average of the maximum wave run-up events for the experimental cases. Moreover, it can take 20min or more to achieve a calm water condition in the wave flume after the last experimental case After a calm water condition is achieved, all transducers should be set to 0 before the next experimental case. All data were extracted with a sampling frequency of 50Hz during the test.

Fig.6 Side view of a wave impact example for the test in Case 1 (d=0.25m, H=0.06m, T=1s).

Table 2 Experimental cases
Notes:,,,,, andare the water depth, wave height, wave period, wave number, amplitude of the incident wave, and radius of the base diameter of the Arc-CBF in this study, respectively, andis the wave scattering parameter.
3 Results and Discussion
3.1 Wave Pressure on the Arc-CBF
Fig.7 shows the time series of wave pressure and the corresponding spectral distribution on measurement point 1 (No. 1) in Case 1. Note that the location of No. 1 is always underwater. It is observed that the same peak as the incident wave frequency occurs at approximately 1.0Hz in the power spectrum. The second harmonic component of 2Hz is also observed in the spectral diagram. Meanwhile, the second-order nonlinear effect has a low intensity. This finding indicates that the transducers can measure the fluctuating pressure induced by a wave train on the surface of the model accurately.
Fig.8 shows the response of wave pressure and the corresponding spectral distribution on measurement point 5 (No. 5) in Case 1. Note that No. 5 is located near the wave surface elevation in Case 1. Hence, all of the minimum pressures deviate from the zero-pressure axis at approximately 0.07kPa for every wave period, and the pressure on No. 5 is positive, which is consistent with a previous experiment (Vicinanza and Frigaard, 2008). The deviation phenomenon can be explained by the way that the transducers are installed and the test process, which are described in Section 2. The water almost always stays in the hole no matter how the free fluid surface changes after the physical experiments start, which is due to the surface tension of water. Thus, the wave pressure of transducer No. 5 is greater than 0. Moreover, Fig.8(a) shows that the measured time series of pressure is not strictly periodic with identical magnitudes. This finding can be attributed to the fact that wave run-up in a wave train is not necessarily periodic with identical green water heights because of the interaction between incoming waves and the Arc-CBF. This is observed in Fig.8(b), with the highest peak at low frequency due to the deviation.
Fig.9 shows the experimental results of maximum wave pressure on the 30 points measured in Case 1. Note that the maximum wave pressure of each point at the same level has different values, and the points at 0˚ have high values. Apparently, the maximum wave pressure at the corresponding points decreases with the increase in distance from a certain position, which may be located somewhere from the still water to the region of wave height variation. Moreover, the characteristics of maximum wave pressure in the other test cases are nearly consistent with the results of Case 1. This trend can be explained by the distribution of the horizontal and vertical velocities of water particles influenced by wave action. The horizontal particle velocityuand vertical particle velocityubelow the hydrostatic surface with a distancecan be expressed as follows:

Fig.7 Response to wave pressure on measurement point 1 in Case 1. (a) Time series; (b) Power spectrum.

Fig.8 Response to wave pressure on measurement point 5 in Case 1. (a) Time series; (b) Power spectrum.


whereis the radian frequency. The decrease in the velocity of the water particles results in the decrease in wave pressure calculated on the basis of velocity.
Compared with that in the other directions, the maximum wave pressure on the lee side,, at an angle of 180˚, is different, which is caused by wave collision at the rear side of the Arc-CBF. From this perspective, when regular waves hit the model, it continues to propagate forward along both sides and eventually overlaps at 180˚. For the maximum wave pressure on different points at 180˚, the strong coupling mechanism results in a significant nonlinear phenomenon.
Figs.10 and 11(a) show one part of the time series of the wave pressure of the measurement points on the CBF model under the influence of wave action for Cases 1 and 10, respectively. For these points at the same elevation, the vertical distance is 0.03m from the bottom of the flume. In these plots, because of the large diameter of the Arc-CBF, there are obvious phase differences among different points. The corresponding wave pressure of the measure- ment points at 0˚ is displayed in Figs.10 and 11(b). The secondary wave crest is observed, particularly at a low relative water depth in Fig.11(b). This is probably caused by the fact that the backflow around both sides induces wave run-up to a certain extent in front of the model be- fore the next wave crest. The specific explanation can involve a certain process,, one part of the wave at the rear of the CBF model begins to reflow along both sides after reaching the maximum wave run-up level; subsequently, the backflow results in partial wave run-up before the next wave hits the Arc-CBF.

Fig.9 Maximum wave pressure on the Arc-CBF for 30 measurement points in Case 1.

Fig.10 Variation of wave pressure on the Arc-CBF from different directions in Case 1.

Fig.11 Variation of wave pressure on the Arc-CBF from different directions in Case 10.
3.2 Wave Force on the CBF
Fig.12 shows the variation of the non-dimensional horizontal wave forceFon the CBF versus the wave scattering parameterwith a fixed water depth, whereis the radius of the base diameter of the Arc-CBF. The horizontal wave forces are dimensionless bythe factor2(Roy and Ghosh, 2006), whereis the density of water. It is obvious that the non-dimensional horizontal wave force for a high wave height (=0.10m) is large. Moreover, the non-dimensional horizontal wave force increases with the increase in the wave scattering parameter.
Fig.13 shows the plots of the non-dimensional horizontal wave force versus the relative wave height (/) with fixed water depth (=0.25m) and wave height (=0.06m), respectively. The wave heightis normalized by the water depth. As shown in Figs.13(a) and 13(b), thenon-dimensional horizontal wave force increases with the increase in relative wave height for a certain wave period.
Fig.14 illustrates the time relationship between normalized wave force and wave pressure on measurement point 1 in Case 1, and the two quantities are normalized by their maxima. The crest value of wave force occurs approximately 0.08s ahead of that of wave pressure. The phase difference between wave force and wave pressure on measurement point 1 for all test conditions is displayedin Table 3. The phase difference has a low intensity; hence, the maximum wave force is expected to occur at the time that is the same as the peak of wave pressure on measurement point 1.
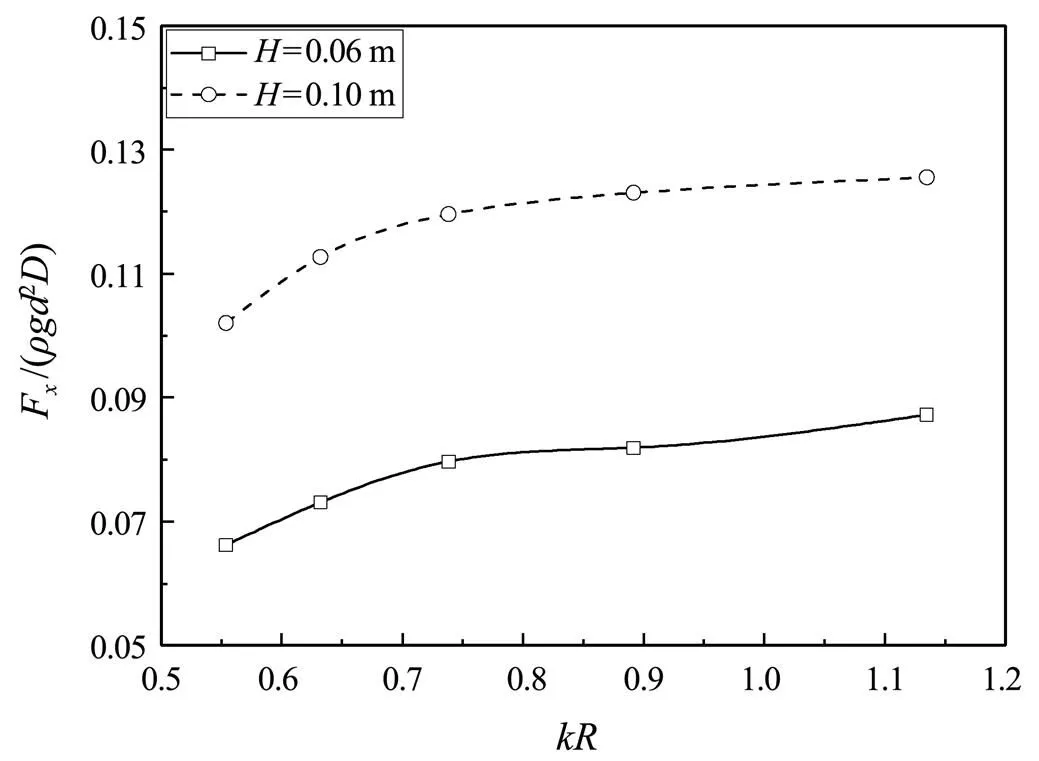
Fig.12 Non-dimensional horizontal wave force versus wave scattering parameter with a fixed water depth d=0.25m.

Fig.13 Non-dimensional horizontal wave force versus relative wave height. (a) d=0.25m; (b) H=0.06m.

Fig.14 Phase relationship between normalized wave force and wave pressure on measurement point 1 in Case 1.

Table 3 Phase difference between wave force and wave pressure on measurement point 1
3.3 Wave Upwelling
Fig.15 exhibits the normalization of wave upwelling around the CBF in different directions in Case 1. The maximum wave upwellingmaxis defined as the amplitude of the maximum wave elevation with reference to the still water level, and the dimensionless wave upwelling ratio is described as the normalized upwelling valuemax/. The wave upwelling ratio increases as it gets closer to the Arc-CBF for Rows A and B. The maximum upwelling ratio is observed at wave gauge A1, whereas the minimum wave upwelling ratio is observed at wave gauge D1 at an angle of 135˚. The lowest wave upwelling height is expected to occur at the lee side,, 180˚. However, this result is substantially the same as the conclusion made by De Vos(2007),, the lowest wave upwelling height around the pile was located at 135˚ in irregular waves. This finding can be attributed to the fact that the high kinetic energy is converted into potential energy due to the convergence of the wave along both sides of the CBF at 180˚. Moreover, the wave upwelling heights are higher in front of the CBF than at the other locations.
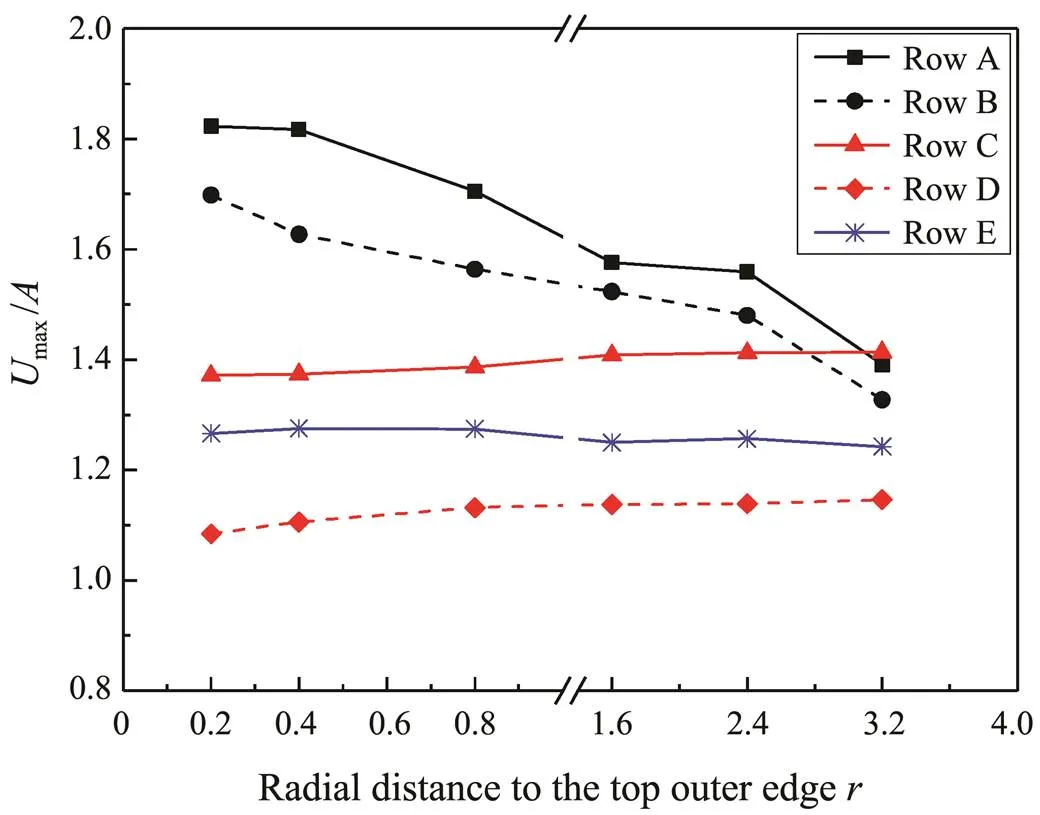
Fig.15 Distribution of wave upwelling ratios around the CBF model in Case 1.
Fig.16 presents the time series of the wave surface elevation and the corresponding power spectrum at 0˚ in Case 1. In comparison with the wave condition without the CBF, in which the phase difference between A3 and A6 is equal to 0.733, according to the linear wave theory, the phase difference at 0˚ is not so obvious because of the blocking effect of the Arc-CBF. The results shown in Fig.16(b) indicate that the third harmonic component appears at wave gauge A3, whereas the peak value is not significant, which may be caused by the superposition of incident and nonlinear side waves. After the propagating waves reach the highest level on the lee side of the Arc-CBF, part of the waves moves back along the side of the Arc-CBF, which results in the phenomenon of side waves (see Fig.6(f)). Compared with the location of wave gauge A3, the other wave gauges,, A4, A5, and A6, are farther from the surface of the Arc-CBF. Therefore, the waves were less disturbed and the nonlinearity decreased; hence, the third harmonic component of these wave gauges had no peak value. Moreover, the peak value of the second harmonic component is smaller than that of the fundamental harmonic.

Fig.16 Time series of wave surface elevation and the corresponding power spectrum at Row A in Case 1. (a)Time series;(b)Power spectrum.
3.4 Wave Run-up on the Arc-CBF
Fig.17 illustrates the relationship between the normalized maximum run-up heightsR,max/on the Arc-CBF at 0˚ and the wave steepness. It is obvious that the values ofR,max/for test conditions with a constant water depth or wave height increase with the increase in the value of wave steepness, which indicates strong nonlinearity. Furthermore, the increasing trend of the values ofR,max/slightly increases with the increase in wave steepness. This may be because the high wave steepness contributes significant kinematics to the enhancement of wave run-up height compared with the low wave steepness. Meanwhile, the strong energy dissipation could cause the increase in wave run-up to diminish.
As a new type of wind turbine foundation, no theoretical formula has been developed for predicting the wave run-up heights on the CBF in previous literature. However, one of the conventional analytical models for wave run-up is based on the velocity stagnation head theory. According to this theory, some semiempirical run-up formulae related to piles are proposed and described, and the difference among these formulae lies in the introduc-tion of the appropriate wave theory and the determination of the adjustment factor. In comparison with the state of wave run-up around a single pile, which is based on the velocity stagnation head theory, whether this analytical model can be applied to the experimental results for the CBF is uncertain, and further research needs to be conducted.
Fig.18 shows the comparison between the obtained experimental results (R,max−) for the CBF at an angle of 0˚ and the theoretical values accompanied by the increase in wave height at a constant water depth=0.25m. On the basis of the velocity stagnation head theory, the two diagrams illustrate that two theories were applied to calculate wave kinematics. The linear theory was used according to the suggestions of Hallermeier (1976), Niedzwecki and Duggal (1992), and Niedzwecki and Huston (1992). Another higher-order theory, which was applied to calculate wave kinematics at the wave crest, is the second-order Stokes wave theory.
The analytical method according to Hallermeier (1976), who originally proposed the velocity stagnation head theory, significantly underestimates the wave run-up when applying the linear theory with the adjustment coefficientequal to 1.0. The proposals of Niedzwecki and Duggal (1992) and Niedzwecki and Huston (1992) contributed to the improvements in the prediction of the wave run-up height. Based on the velocity stagnation head theory, the green curve, representing the second-order Stokes wave theory, is nearly consistent with the idea of Niedzwecki and Duggal (1992),, the blue curve when=1.8s. This phenomenon occurs because the introduction of higher-order wave theory results in one more item when determining wave kinematics. In this manner, the distribution of the green curve might change because of an additional item evaluated between=1.4s and=1.8s with constant water depth. As shown in Fig.18, the wave run-up heights are underestimated for all of the theories calculating wave kinematics in the range of low wave heights. Fig.18 illustrates that these curves are inconsistent with the experimental results; hence, the coefficientis adjusted to develop new formulae based on the velocity stagnation head theory.

Fig.18 Comparison between experimental results and wave run-up heights predicted for water depth d=0.25m. (a) T=1.4s; (b) T=1.8s.
3.5 New Formulae for Wave Run-up on the Arc-CBF


Then, the wave run-up when the linear theory is used can be expressed as follows:

wheremaxis calculated using Eq. (5).
Furthermore, greater scatter and disorder are observed for the distribution of the second-order Stokes wave theory in comparison with the linear theory, as shown in Fig.19. Thus, the adjustment coefficientis assumed to be 1 under the second-order Stokes wave theory. When the second-order Stokes wave theory is applied to predict wave run-up, the maximum horizontal water particle velocity at the wave crest is derived as follows:
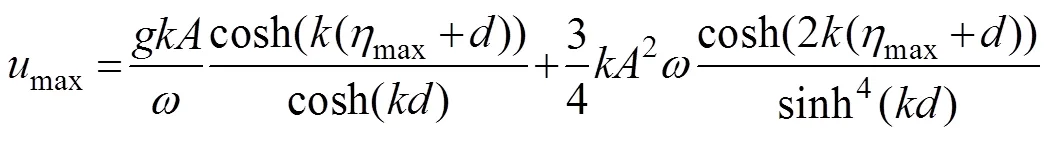
The introduction of higher-order wave theory results in one more item when determining wave kinematics compared with the linear wave theory in Eq. (5). The maximum wave run-up when the second-order Stokes wave theory is used can be expressed as follows:

wheremaxis calculated using Eq. (9).
The values ofamong these combinations are quite different for Eqs. (8) and (10). De Vos(2007) inferred thatmight be related to the shape of the foundation or the cylinder diameter. However, in addition to the ideas mentioned by other authors, the factorseems to be influenced by the different wave theories applied to calculate wave kinematics in this study. This finding can be attributed to the fact that a large adjustment coefficientis obtained because of the decrease in crest velocity on the basis of different wave theories applied to the case of low wave steepness.
Furthermore, investigations of wave run-up on the Arc-CBF in terms of the effective dimensionless parameter based on sensitivity analysis are conducted. In the present study, multiple regression analysis considering the linear trend (Fig.18) is applied to propose a formula for predicting the wave run-up heights of the Arc-CBF. Moreover, nonlinear technology, which is in logarithmic form, is introduced to conduct the entire analysis procedure.
The wave run-up height can be presented in dimensionless form (Kazeminezhad and Etemad-Shahidi, 2015), as follows:

To conduct correlation analysis, after taking the logarithm, the formula can be rewritten as follows:

On the basis of the 24 experimental results, the factors in Eq. (12) were evaluated through multiple regression analysis:

The following equation was obtained:
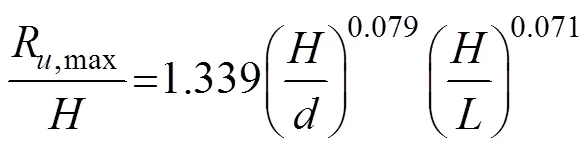
Simultaneously, one must carefully apply Eq. (14) considering the regular waves with a limited range (0.16
Before discussing the performance of new formulae derived using different methods, several statistical indices, including the squared Pearson correlation coefficient2, the scatter indicator, and the bias, need to be determined. The corresponding equations are defined, as follows:

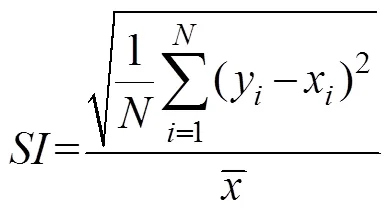


Fig.19 Results of wave run-up as a function of velocity head with the linear theory (bottom X and left Y) and second-order Stokes wave theory (top X and right Y) as a function of velocity head for regular waves.
Fig.20 presents the comparison between experimental and theoretical results of new formulae with constant water depth. The best results are obtained by simple multiple regression analysis. However, the two other theories based on the velocity stagnation head theory cannot reproduce the experimental results sufficiently; in particular, the trends are not identical at all. The predicted results are not improved as expected by these new formulae compared with the unmodified formulae, as mentioned previously (see Fig.18). This finding can be attributed to the fact that the shape of the Arc-CBF has a significant effect on the wave run-up on the CBF.
Fig.21 shows the experimental and theoretical results of this study for wave run-up obtained using different theories, including linear theory and second-order Stokes wave theory based on the velocity stagnation head theory, and the multiple regression method. Notably, the performance of the multiple regression method is superior to that of the other formulae. Compared with the other methods, greater scatter is observed for the new formulae based on the linear theory and second-order Stokes wave theory. The performance of the new formulae is evaluated, as presented in Table 4. The regular waves in the present study are second-order Stokes waves; hence, the performance is less promising when the linear theory is used in comparison with the formula based on the second-order Stokes wave theory. Among these methods or theories, the best results are obtained when applying a simple multiple regression method.
4 Conclusions
To investigate the wave load and run-up on the CBF influenced by regular waves, laboratory tests were performed in the present study. As a new type of foundation, the distribution of wave pressure on the Arc-CBF was discussed, and the wave load measured with the corresponding dimensionless parameters was analyzed. Moreover, the wave run-up heights, as well as wave upwelling around the CBF, were investigated. To estimate the wave run-up accurately,new formulae were developed based on the velocity stagnation head theory by updating the value of. Moreover, the multiple regression method was used to predict wave run-up. Some of the results can be summarized as follows:

Fig.20 Comparison between experimental and theoretical wave run-up with a fixed water depth d=0.25m (Eq. (8) for the linear theory, Eq. (10) for the second-order Stokes wave theory, and Eq. (14) for the multiple regression method). (a) T=1.4s; (b) T=1.8s.

Fig.21 Comparison between experimental and theoretical wave run-up obtained using the new formulae (Eq. (8) for the linear theory, Eq. (10) for the second-order Stokes wavetheory, and Eq. (14) for the multiple regression method).

Table 4 Statistical indices of new formulae based on different theories for wave run-up
1) The non-dimensional wave loadF/2on the CBF increases with the increase in the wave scattering parameter. A high wave height has a significant influence and leads to a large non-dimensional wave load.
2) The wave upwelling around the CBF has a high value in front of the CBF, particularly when the wave propagates close to the model. However, the minimum wave upwelling is located at an angle of 135˚.
3) As a new type of foundation, the non-dimensional wave run-upR,max/on the Arc-CBF increases with the increase in wave steepness. A high wave steepness significantly contributes to the wave run-up on the CBF.
4) Based on the velocity stagnation head theory, the semiempirical formulae show that the adjustment coefficientis large under the wave condition of low wave steepness influenced by regular waves. Moreover, the factorcould be influenced by the theories that are applied to calculate wave kinematics.
5) In summary, the best-fit formula for predicting wave run-up is obtained by a simple multiple regression method. By contrast, the analytical model based on the velocity stagnation head theory leads to a less accurate prediction of wave run-up on the CBF.
A preliminary study of the mechanism of wave load and run-up on the CBF model influenced by regular waves was conducted, and new formulae for estimating the maxi- mum wave run-up height were proposed in this study. However, to extract comprehensive and accurate results for the CBF, considerable studies and data are needed to explore the relationship between wave load and run-up induced by regular and irregular waves, which can guide application in engineering practice.
Acknowledgements
This work was financially supported by the funds for the National Natural Science Foundation of China (Nos. 51509230 and 52071304), and the Primary Research & Development Plan of Shandong Province (No. 2019GHY112044). Support from the funding agency is sincerely acknowledged.
Bonakdar, L., Oumeraci, H., and Etemad-Shahidi, A., 2016. Run-up on vertical piles due to regular waves: Small-scale model tests and prediction formulae., 118: 1-11, DOI: https://doi.org/10.1016/j.coastaleng.2016.08.008.
Buccino, M., Vicinanza, D., Salerno, D., Banfi, D., and Calabrese, M., 2015. Nature and magnitude of wave loadings at Seawave Slot-cone Generators., 95: 34-58, DOI: https://doi.org/10.1016/j.oceaneng.2014.11.038.
De Vos, L., Frigaard, P., and De Rouck, J., 2007. Wave run-up on cylindrical and cone shaped foundations for offshore wind turbines., 54 (1): 17-29, DOI: https://doi.org/10.1016/j.coastaleng.2006.08.004.
Hallermeier, R. J., 1976. Nonlinear flow of wave crests past a thin pile., 102 (4): 365-377.
Kazeminezhad, M. H., and Etemad-Shahidi, A., 2015. A new method for the prediction of wave run-up on vertical piles., 98: 55-64, DOI: https://doi.org/10.1016/j.coastaleng.2015.01.004.
Li, J. X., Wang, Z. H., and Liu, S. X., 2012. Experimental study of interactions between multi-directional focused wave and vertical circular cylinder, part I: Wave run-up., 64: 151-160, DOI: https://doi.org/10.1016/j.coastaleng.2012.02.003.
Li, J. X., Wang, Z. H., and Liu, S. X., 2014. Experimental study of interactions between multi-directional focused wave and vertical circular cylinder, part II: Wave force., 83: 233-242, DOI: https://doi.org/10.1016/j.coastaleng.2013.06.004.
Lian, J. J., Ding, H. Y., Zhang, P. Y., and Yu, R., 2012. Design of large-scale prestressing bucket foundation for offshore wind turbines.,18: 79-84, DOI: https://doi.org/10.1007/s12209-012-1661-5.
Lian, J. J., Sun, L. Q., Zhang, J. F., and Wang, H. J., 2011. Bearing capacity and technical advantages of composite bucket foundation of offshore wind turbines., 17: 132-137, DOI: https://doi.org/10.1007/s12209-011-1644-y.
Lin, Y. H., Chen, J. F., and Lu, P. Y., 2017. A CFD model for simulating wave run-ups and wave loads in case of different wind turbine foundations influenced by nonlinear waves.,129:428-440,DOI:https://doi.org/10. 1016/j.oceaneng.2016.10.050.
Lykke Andersen, T., and Frigaard, P., 2006. Horns Rev II, 2-D model tests. Wave run-up on pile. DCE Contract Report No. 3. Aalborg University, Denmark.
Lykke Andersen, T., Frigaard, P., Damsgaard, M. L., and De Vos, L., 2011. Wave run-up on slender piles in design conditions–Model tests and design rules for offshore wind., 58 (4): 281-289, DOI: https://doi.org/10.1016/j.coastaleng.2010.10.002.
Myrhaug, D., and Holmedal, L. E., 2010. Wave run-up on slender circular cylindrical foundations for offshore wind turbines in nonlinear random waves.,57 (6): 567-574, DOI: https://doi.org/10.1016/j.coastaleng.2009.12.003.
Niedzwecki, J. M., and Duggal, A. S., 1992. Wave run-up and forces on cylinders in regular and random waves., 118: 615-634.
Niedzwecki, J. M., and Huston, J. R., 1992. Wave interaction with tension leg platforms., 19 (1): 21-37, DOI: https://doi.org/10.1016/0029-8018(92)90045-6.
Ning, D., Wang, R., Chen, L., Li, J., Zang, J., Cheng, L., and Liu, S., 2017. Extreme wave run-up and pressure on a vertical seawall., 67: 188-200, DOI: https://doi.org/10.1016/j.apor.2017.07.015.
Pérez-Collazo, C., Greaves, D., and Iglesias, G., 2015. A review of combined wave and offshore wind energy., 42: 141-153, DOI: https://doi.org/10.1016/j.rser.2014.09.032.
Ramirez, J., Frigaard, P., Lykke Andersen, T., and De Vos, L., 2013. Large scale model test investigation on wave run-up in irregular waves at slender piles., 72: 69-79, DOI: https://doi.org/10.1016/j.coastaleng.2012.09.004.
Roy, P. D., and Ghosh, S., 2006. Wave force on vertically submerged circular thin plate in shallow water., 33 (14-15): 1935-1953, DOI: https://doi.org/10.1016/j.oceaneng.2005.09.010.
Shan, T. B., Yang, J. M., Li, X., and Xiao, L. F., 2011. Experi- mental investigation on wave run-up characteristics along col- umns and air gap response of semi-submersible platform., 23 (5): 625-636, DOI: https://doi.org/10.1016/S1001-6058(10)60158-8.
Stockdon, H. F., Thompson, D. M., Plant, N. G., and Long, J. W., 2014. Evaluation of wave runup predictions from numerical and parametric models., 92: 1-11, DOI: https://doi.org/10.1016/j.coastaleng.2014.06.004.
Vicinanza, D., and Frigaard, P., 2008. Wave pressure acting on a seawave slot-cone generator., 55 (6): 553-568, DOI: https://doi.org/10.1016/j.coastaleng.2008.02.011.
Wang, H. Y., and Sun, Z. C., 2010. Experimental study of a porous floating breakwater., 37 (5-6): 520-527, DOI: https://doi.org/10.1016/j.oceaneng.2009.12.005.
Wang, P. G., Zhao, M., and Du, X. L., 2018. Short-crested, cnoidal, and solitary wave forces on composite bucket foundation for an offshore wind turbine.,10 (2): 023305, DOI: 10.1063/1.4995649.
Xiao, H., and Huang, W. R., 2008. Numerical modeling of wave runup and forces on an idealized beachfront house., 35 (1): 106-116, DOI: https://doi.org/10.1016/j.oceaneng.2007.07.009.
Yu, T. S., Lian, J. J., Shi, Z. Q., and Wang, H. Z., 2016. Experi- mental investigation of current-induced local scour around composite bucket foundation in silty sand., 117: 311-320, DOI: https://doi.org/10.1016/j.oceaneng.2016.03.045.
Yu, T. S., Zhang, Y. T., Zhang, S. B., Shi, Z. Y., Chen, X. G., Xu, Y., and Tang, Y. Y., 2019. Experimental study on scour around a composite bucket foundation due to waves and current., 189: 106302, DOI: https://doi.org/10.1016/j.oceaneng.2019.106302.
Zhang, J. S., and Teng, B., 2017. Numerical study on cnoidal wave run-up around a vertical circular cylinder., 63: 276-287, DOI: https://doi.org/10.1016/j.apor.2017.01.006.
Zhang, P. Y., Guo, Y. H., Liu, Y. G., and Ding, H. Y., 2016. Experimental study on installation of hybrid bucket foundations for offshore wind turbines in silty clay., 114: 87-100, DOI: https://doi.org/10.1016/j.oceaneng.2016.01.025.
January 12, 2020;
July 18, 2020;
August 18, 2020
© Ocean University of China, Science Press and Springer-Verlag GmbH Germany 2021
. Tel: 0086-532-66781150
E-mail: tshyu707@ouc.edu.cn
(Edited by Xie Jun)
杂志排行

Journal of Ocean University of China的其它文章
- Corrosion Mechanism of 5083 Aluminum Alloy in Seawater Containing Phosphate
- In vitro Antioxidant Effects of Porphyra haitanensis Peptides on H2O2-Induced Damage in HepG2 Cells
- Molecular Characterization and Expression Analysis of SKIV Infection of Interferon-Induced Protein with Tetratricopeptide Repeats 1 (IFIT1) in Epinephelus lanceolatus
- Characteristics and Influencing Factors of the Microbial Concentration and Activity in Atmospheric Aerosols over the South China Sea
- Characteristics of Atmospheric Rivers over the East Asia in Middle Summers from 2001 to 2016
- Otolith Shape Analysis as a Tool to Identify Two Pacific Saury (Cololabis saira) Groups from a Mixed Stock in the High-Seas Fishing Ground