Otolith Shape Analysis as a Tool to Identify Two Pacific Saury (Cololabis saira) Groups from a Mixed Stock in the High-Seas Fishing Ground
2021-03-06LIWenjiaZHANGChiTIANYongjunLIUYangLIUShigangTIANHaoandCAOChang
LI Wenjia, ZHANG Chi, TIAN Yongjun, LIU Yang, LIU Shigang,TIAN Hao, and CAO Chang
Otolith Shape Analysis as a Tool to Identify Two Pacific Saury () Groups from a Mixed Stock in the High-Seas Fishing Ground
LI Wenjia1), #, ZHANG Chi1), #, TIAN Yongjun1), 2), 3), *, LIU Yang1), 2), LIU Shigang4),TIAN Hao1), and CAO Chang1)
1),,266003,2),,266100,3),,266237,4)y,,,361005,
ThePacific sauryis a commercially important pelagic species with wide distribution in the North Pacific Ocean. Previous studies identified two geographical groups by comparing the radius of otolith annual rings (ROA) of the fish collected during the pre-fishing season. Moreover, understanding the group composition in the mixed catch from the fishing ground is essential for sustainable exploitation of this species. Using samples collected during the fishing season (July–November) from 2016 to 2018, the potential of applying otolith shape analysis as a tool to identify these two mixed groups was tested in this research. Two otolith morphotypes thatbelong to the eastern group and western group were identified by K-means cluster analysis using Fourier coefficients and ROA. The high classification success of random forest further confirmed the effectiveness of otolith shape analysis. The western group accounted for the majority of catch in July and August at 160˚E. With the passing of sampling time and fishing fleets moving westward, the proportion of eastern group gradually increased and finally reached more than 60% of the whole catch in November at 150°E. This result suggests that the eastern and western groups are well mixed during spawning migration. In addition, the temporal and spatial dynamics of their catch composition provide information for their migration route. This study is helpful for improving fisheries management and understanding the short-term stock fluctuation of Pacific saury.
Pacific saury; otolith shape analysis; geographical group; radius of otolith annual ring
1 Introduction
The Pacific sauryis widely distributed in the North Pacific Ocean (Hubbs and Wisner, 1980) and caught commercially by Japan, Russia, Korea, China, and Vanuatu mainly in the western area of 165˚E (Tseng, 2013). They migrate northward from the Oyashio (subarc- tic cold) waters to the Kuroshio (subtropical warm) wa- ters in May and July, moving through the Kuroshio-Oya- shio transitional waters, and then start southward migration between July and August (Kurita, 2004). Pacific sau- ry is characterized by short life span (2 years), high growthrate, and early maturity (Suyama, 2010; Suyama,2019), exhibiting marked population fluctuations (Tian,2003; Watanabe, 2003). The total landings fluctuatedover the last 20 years from 187898 tons in 1999 to 260178 tons in 2017 (The Food and Agriculture Organization: http:// www.fao.org/fishery/statistics/global-capture-production/ query/en, accessed 15 October, 2019). Despite the increase in total fisheries catches, the standing stock of Pacific sau-ry has declined recently (Tohoku National Fisheries Research Institute, Fisheries Research Agency TNFRI,2017). Thus stock assessment and management aiming to achieve the sustainable exploitation of Pacific saury resources are ur- gently needed. Therefore, a regional fisheries management organization, North Pacific Fisheries Commission (www. npfc.int), was established in 2015 to take timely actions.
One essential part of fish stock assessment and fishe- ries management is to identify distinct populations that have unique demographic properties and life history pat- terns as well as divergent responses to fishery exploitation (Begg, 1999; Stephenson, 1999), and to manage them separately (Hutchinson, 2008). For Pacific saury, Suyama(2012a) found two spatially separated groups of one year old individuals through comparing the radius of oto- lith annual rings (ROA) of samples collected during pre- fishing season (June and July): one distributed in the west of 160˚E with large ROAs (western group) and the other in the east of 170˚E with small ROAs (eastern group). However, the two groups are mixed in the high-seas fish- ing ground during the fishing season, which makes them difficult to be distinguished by ROA.
The different growth and migration patterns of distinct groups can result in different dynamics. The western group, a main stock captured by Japanese fleets, has declined re- cently (Miyamoto, 2019). However, this group is also captured along with the eastern group in the high-seas fishing ground, which makes management and allocation of fishing quota difficult because of lacking effective tools to separate these two groups.
Due to the effects of both genetics and environment, fish with different life histories often vary in otolith morphol- ogy (Vignon, 2012). This variation has led to the deve- lopment and wide application of otolith shape analysis as an ideal tool to identify groups of fish that may have been spatially or temporally discrete at some stages in their life history (Stransky, 2008; Agüera and Brophy, 2011; Bacha, 2014; Keating, 2014; Chi, 2016). If the separated habitats for the two groups of the Pacific saury during the first year result in differences in ROAs, it could also cause differences in otolith shape. Such dif- ferences could last during spawning migration because of the different environmental conditions they experienced, which thus allow the quantification of group composition in the fishing ground. In this study, we tested the potential of using otolith shape analysis combined with ROAs to identify the two groups of one year old Pacific saury. The aims of this study were 1) to separate the two groups and quantify the spatial and temporal dynamics of group com- position of Pacific saury in the fishing ground; and 2) to provide information on the timing of migration to facili- tate sustainable fisheries management.
2 Materials and Methods
2.1 Sampling
Pacific saury were randomly sampled from commercial catch (using stick-held net) in the fishing ground of high- seas (147.7˚–163.1˚E, 37.8˚–47.6˚N) during the fishing sea- son (July–November) from 2016 to 2018 with the vessels of Qingdao Zhongtai Oceanic Fishery Co., Ltd., China. Fishsamples were frozen on board. After being transported to the laboratory, all fish samples were measured by knoblength and weighted. Otoliths were extracted, washed with ultrapure water, air-dried, and then stored in plastic tubes. The left undamaged otolith of each individual was placed on glass slides and photographed using a micrographic sys- tem (Olympus BX53 and DP74) at a magnification of 40. For Fourier analysis, the otoliths were placed along the sul- cus side, facing down and rostrumsresting horizontally to the left. Polarized light was used to produce high-contrast images and to enhance the clarity of translucent zones, where otoliths were bright objects on a black background.
All animal experiments were conducted in accordance with the guidelines and approval of the respective Animal Research and Ethics Committees of Ocean University of China (Permit Number: 20141201. http://www.gov.cn/gong bao/ content/2011/content_1860757.htm). The studies did not involve endangered or protected species.
2.2 Radius of Annual Ring Measurement and Otolith Shape Analysis
Only one year old individuals were selected for subse- quent analysis based on the otolith classification method recommended by Suyama(2009) to exclude age-re- lated variability in otolith shape. Only the otoliths enclosed by a broad translucent area (type II) or containing a com- plete hyaline zone within the otolith (type III) were select- ed.
The ROA of each selected otolith, which is defined as the distance from the otolith core to the inner edge of the first annual ring (Suyama, 2012b), was measured withand recorded. Then, the images were analyzed us- ing the R package ‘’ specifically designed for oto- lith shape analysis (Libungan and Pálsson, 2014). This package ‘’ has built-in functions that allow users toextract the otolith outlines from images, visualize the mean shape, smooth the outline by eliminating pixel noise, and transform the outlines into independent coefficients using either normalized elliptic Fourier or discrete wavelet. El- liptic Fourier analysis was chosen and 48 normalized el- liptic Fourier coefficients were produced for each otolith. The first three coefficients were degenerated and constant for all outlines and thus were omitted, leaving 45 (48−3=45) normalized elliptic Fourier coefficients left.
2.3 Statistical Analysis
Samples were identified according to sampling time and location to demonstrate the spatial and temporal changes of group compositions (Table 1). K-means cluster analy- sis was carried out on the Fourier coefficients and ROAs. This method allows a priori assumptions on the number of clusters to compute, and two morphotypes were speci- fied based on a previous study (Suyama, 2012b). Then, the algorithm estimates iteratively the cluster means and assigns each case to its respective cluster until the sum of squares of the assigned cluster centers is minimized. Clus-ter was performed for each year respectively to exclude po-tential effects of year-class shape differences. ROA fre- quency distribution histograms and Gauss fitting curves ofthe clustered groups in three years were plotted using OriginPro 9.1. Random forest was also used to compare the otolith shapes of the clustered groups. Out-of-bag er- ror was estimated internally in the model runs, which is conceptually similar to cross-validation, and used to esti- mate classification success (Breiman, 2001).
3 Results
K-means cluster dendrograms identified two otolith mor- photypes (Fig.1). The ROA cluster centers of Morphotype I were 0.5173778, 0.52516270, and 0.5283049 in the three years, respectively, whereas those of Morphotype II were 0.6084395, 0.6296290, and 0.6033788. The ROA frequen- cy distribution histograms and Gauss fitting curves of the two clusters across the three years showed consistent pat- terns with a smaller ROA of Morphotype Ithan Morpho- type II (Fig.2). The average contours of the two morpho- types also showed high consistency across the three years (Fig.3). The major differences lie on the dorsal and ven- tral margins, namely, the otolith shape of the large ROA group (Morphotype II) is smaller and slender than that of the small ROA group.

Table 1 Collection records of Pacific saury (Cololabis saira) samples used in the analysis
Notes: N, sample size; KnL, knob length.
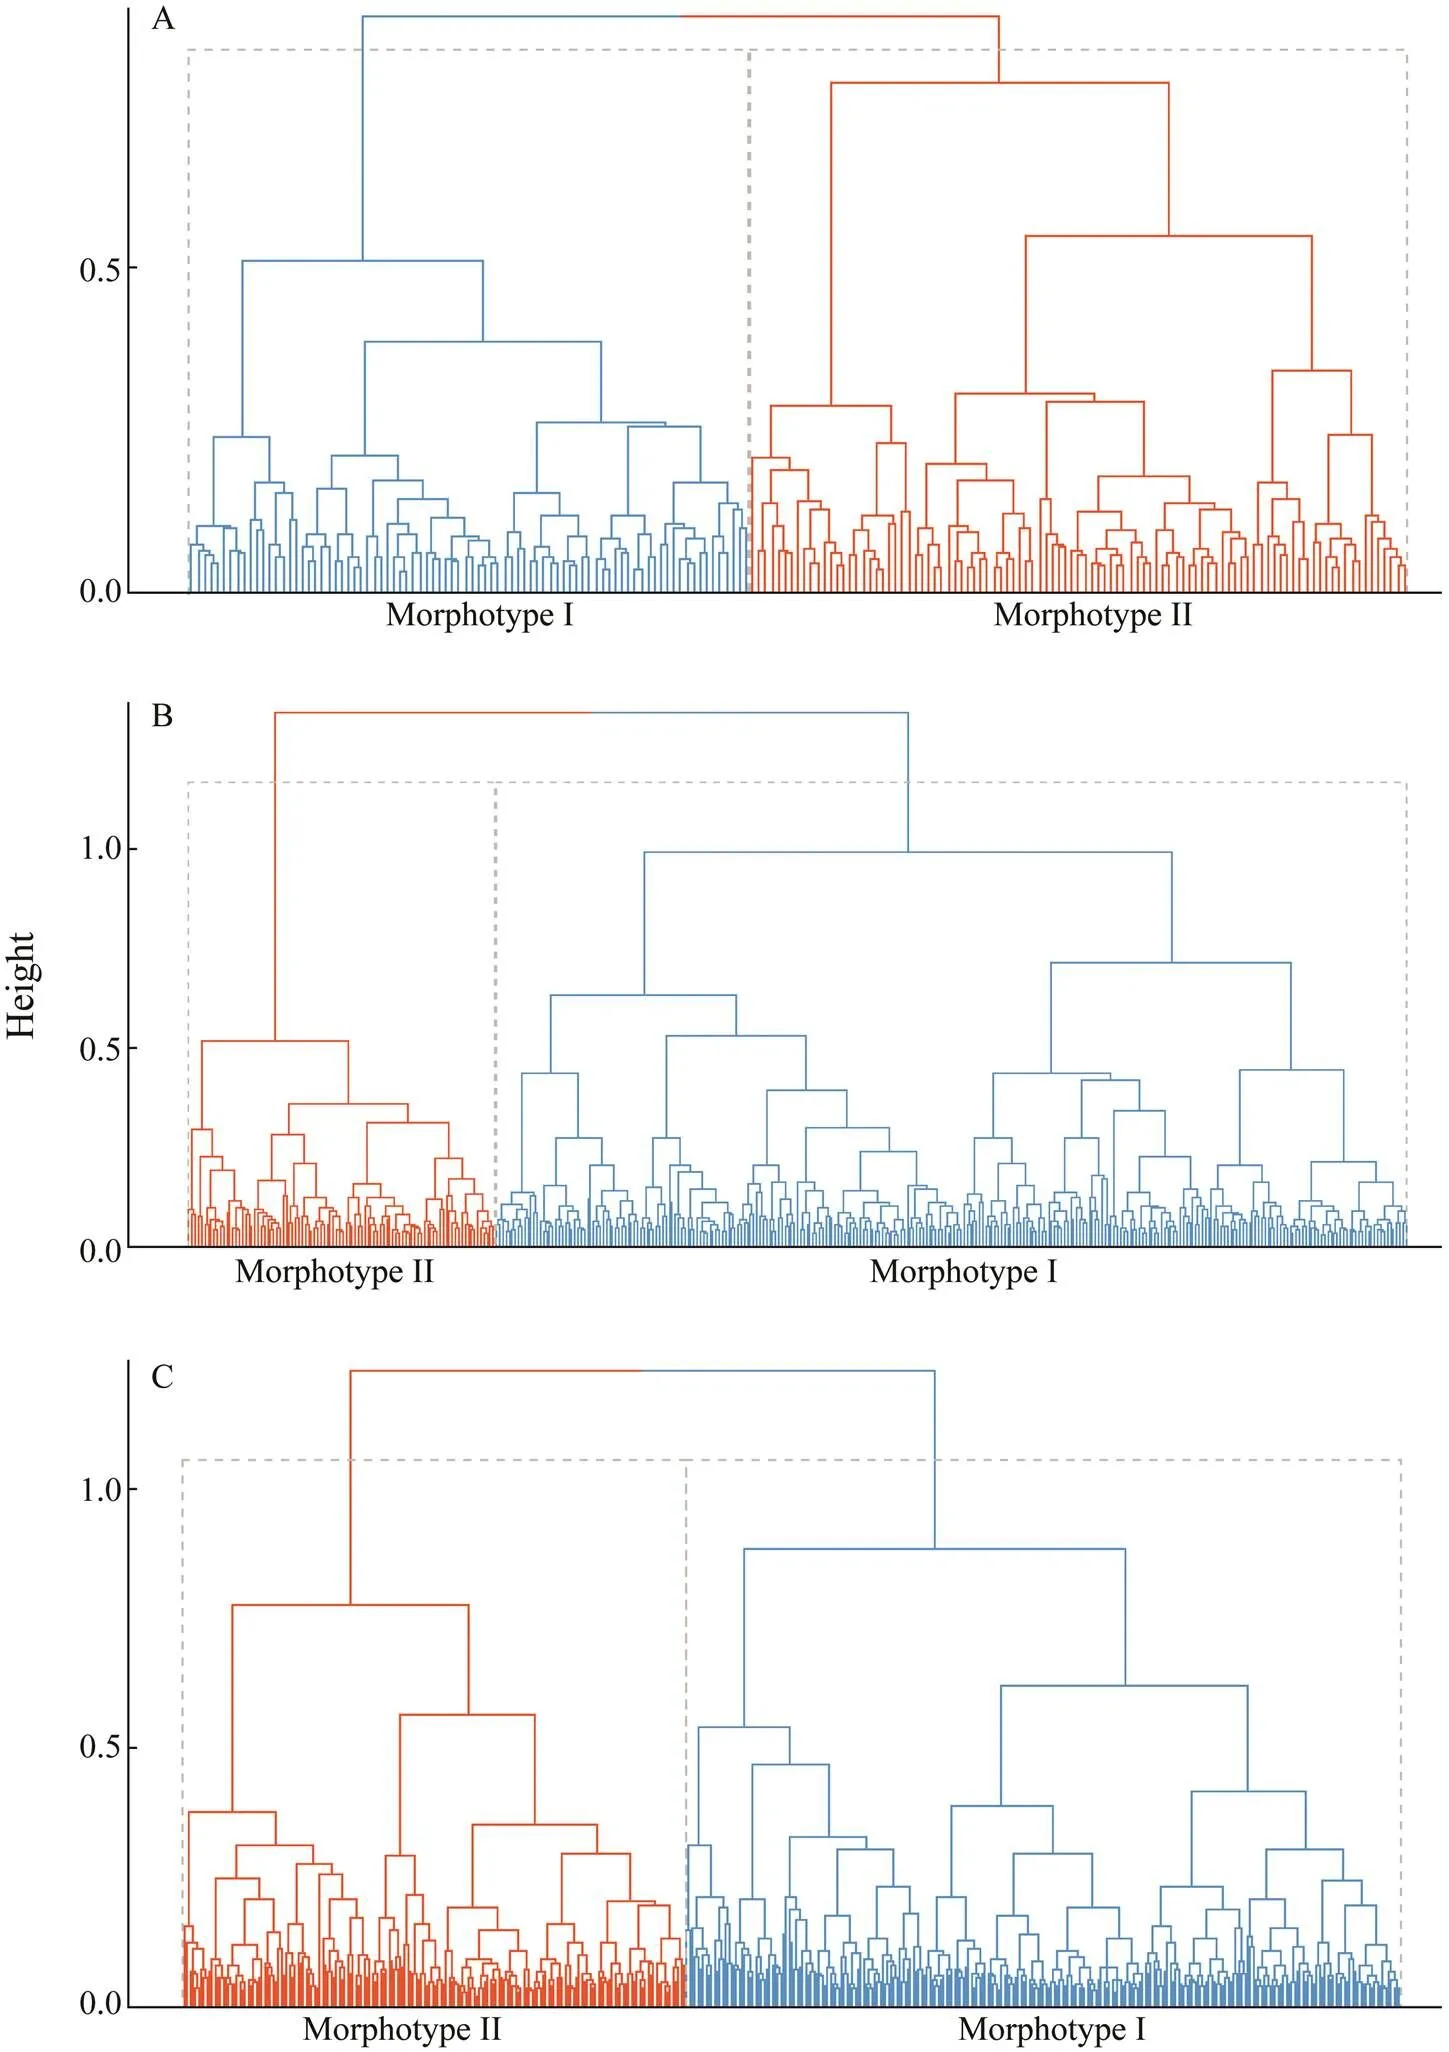
Fig.1 Cluster dendrograms of Pacific Saury collected in (A) 2016, (B) 2017, and (C) 2018.

Fig.2 Frequency distribution histograms and Gauss fitting curves of ROA from samples collected in (A) 2016, (B) 2017, and (C) 2018.

Fig.3 Recreated average contours of the two otolith morphotypes collected in (A) 2016, (B) 2017, and (C) 2018.
The spatial and temporal distribution patterns of Pacific saury showed that the two groups were well mixed from July to November in the three years. In the similar longi- tude (150˚E in 2016, Fig.4), the proportion of individuals from Morphotype Igradually increased with prolonged sam-pling time. Meanwhile, individuals from Morphotype I ac- counted for a large proportion in the west sampling loca- tions in September 2017 (Fig.4). With the passing of sam- pling time and the westward movement of the fleets, the proportion of Morphotype I generally increased, except in August 2016 (Fig.4).
Random forest showed high classification success (ran- ging from 86% to 98%) in assigning individuals to their clustered group (Table 2).

Fig.4 Distribution of two groups in sampling areas in (A) 2016, (B) 2017, and (C) 2018. The blue square represents Morphotype I, and the orange square represents Morphotype II. The beginning of the long black arrows in (C) indicates the actual positions of the sampling stations.

Table 2 Classification results of random forest between the two identified otolith morphotypes
4 Discussion
In this study, otolith shape analysis identified two groups of one year old Pacific saury that were captured from the high-seas fishing ground. The high classification success of random forest further supports the existence of the two groups. Previous studies (Suyama, 2012b; Miyamo- to, 2019) reported that fishes with small ROAs (<0.54mm) and large otolith (Morphotype I) were from east of 170˚E (eastern group), whereas individuals with large ROAs (>0.6mm) and small otolith (Morphotype II) ori- ginated from west of 160˚E (western group). The fish sam- ples were collected with a small space coveragefrom an assemblage of fish during their migration; therefore, the result may merely provide a ‘snapshot’ of the temporal and spatial distribution of the two groups. However, the re- vealed distribution trend is consistent with the previous observation (Miyamoto., 2019). The western group accounted for the majority in July and August at about 160˚E. With the passage of sampling times and westward movement of the fishing locations, the proportion of eastern group increased gradually except in August 2016 and finally reached more than 60% in November at about 150˚E in these three years.
Otolith shape is a species-specific mark that is deter- mined by the genetics of the stock; however, it can also change under the influences of ontogeny and environment (Vignon, 2012). Environmental factors such as tempera- ture (Chi, 2014; Keating, 2014), water depth (Lombarte and Castellón, 1991), salinity (Capoccioni, 2011), substrate type (Mérigot, 2007), diet (Gaglia- no and Mccormick, 2004), and hydrogeomorphic factors (Ding., 2019) affect otolith shape. The response of oto- lith shape to temperature and food availability is mediated by the effects of these variables on growth rate (Campana and Casselman, 1993; Hüssy, 2008). Pacific saury migratesbetween the Oyashio and Kuroshio waters and passes through the Kuroshio-Oyashio transition zone of complex oceanic structures (Watanabe, 1997; Liu, 2019). Moreover, migration is considered to be driven by water temperature and food resources (Huang, 2007; Tseng, 2014). Therefore, the variation in otolith shape might be attributed to the complex and changeable environmen- tal conditions during this long-distance migration. The ob- served otolith shape differences between the two groups might be ascribed to temperature, considering that hightemperature contributes to large sizes (Lombarte and Lleo- nart, 1993). Two dominant Pacific saury fishing grounds were recorded in the fishing season, and the temperature of eastern ground is higher than that of the western one (Tseng, 2011). The otolith shape differences might also ascribe to different water velocities, as Ding(2019) suggested that fast water flow coincides with long and slender otolith.Coincidently, westward velocities are highly correlated with the distribution and migration ofPacific saury (Miyamoto, 2019). Further understand- ing the origins of otolith shape variance and response to longitudinal environmental gradients will be the focus of future work.
Using otolith shape analysis and ROA measurement, two groups of Pacific saury were identified in the high-seas fishing ground in this research. The one year old indivi- duals,which are winter cohort in the Kuroshio region, play a crucial role in the recruitment of this stock because of the stable high growth rates (Watanabe, 2003).Tian(2004) indicated that the decadal-scale varia-tion in Pacific saury abundance is strongly affected by ocea- nic region shifts in the Kuroshio region. However, the short- period fluctuation of saury abundance remains to be stud- ied, especially when inter-regional management is invol- ved. The result can provide information for stock assess- ment and for understanding the migration route of Pacific saury. As shown in this study, ROAs contribute to the most significant differences. Future studies will focus on early life information, such as retrospective analysis using oto- lith microstructure and microchemistry, which can build a baseline for separating the two groups and provide useful information on group origin and migration route.
Acknowledgements
We acknowledge the crew of Zhongtai Oceanic Fishery Co. for their great help in sample collection. We thank Dr. Caihong Fu from Pacific Biological Station, Fisheries and Oceans Canada for proof reading the article, and appreci- ate Prof. Yoshiro Watanabe from University of Tokyo for his valuable discussions and suggestions. This work was supported by the National Natural Science Foundation of China (No. 41930534) and the Fundamental Research Funds for the Central Universities to Ocean University of China (Nos. 201762015 and 201822027).
Agüera, A., and Brophy, D., 2011. Use of saggital otolith shape analysis to discriminate Northeast Atlantic and Western Medi- terranean stocks of Atlantic saury,(Walbaum)., 110 (3): 465-471, DOI: 10. 1016/j.fishres.2011.06.003.
Bacha, M., Jemaa, S., Hamitouche, A., Rabhi, K., and Amara, R., 2014. Population structure of the European anchovy,, in the SW Mediterranean Sea, and the At- lantic Ocean: Evidence from otolith shape analysis., 71 (9): 2429-2435, DOI: 10.1093/icesj ms/fsu097.
Begg, G. A., Friedland, K. D., and Pearce, J. B., 1999. Stock iden- tification and its role in stock assessment and fisheries man- agement: An overview., 43 (1-3): 1-8, DOI: 10.1016/S0165-7836(99)00062-4.
Breiman, L., 2001. Random forests., 45 (1): 5-32, DOI: 10.1023/a:1010933404324.
Campana, S. E., and Casselman, J. M., 1993. Stock discrimina- tion using otolith shape analysis., 50 (5): 1062-1083, DOI: 10.1139/ f93-123.
Capoccioni, F., Costa, C., Aguzzi, J., Menesatti, P., Lombarte, A., and Ciccotti, E., 2011. Ontogenetic and environmental effects on otolith shape variability in three Mediterranean European eel () local stocks., 397 (1): 1-7, DOI: 10.1016/j.jembe. 2012.11.011.
Chi, Z., Ye, Z., Li, Z., Rong, W., Ren, Y., and Dou, S., 2016. Po- pulation structure of Japanese Spanish mackerelin the Bohai Sea, the Yellow Sea and the East China Sea: Evidence from random forests based on otolith fea-tures., 82 (2): 251-256, DOI: 10.1007/s12562- 016-0968-x.
Chi, Z., Ye, Z., Rong, W., Ma, Q., and Li, Z., 2014. Investiga- ting the population structure of small yellow croaker () using internal and external features of oto- liths., 153: 41-47, DOI: 10.1016/j.fishres. 2013.12.012.
Ding, L., Tao, J., Ding, C., Chen, L., Zhang, C., Xiang, Q., and Sun, J., 2019. Hydrogeomorphic factors drive differences in otolith morphology in fish from the Nu-Salween River., 28 (1): 132-140, DOI: 10.1111/eff. 12437.
Gagliano, M., and Mccormick, M. I., 2004. Feeding history in- fluences otolith shape in tropical fish., 278 (43): 291-296, DOI: 10.3354/meps278291.
Huang, W. B., Lo, N. C. H., Chiu, T. S., and Chen, C. S., 2007. Geographical distribution and abundance of Pacific saury,(Brevoort) (Scomberesocidae), fishing stocks in the Northwestern Pacific in relation to sea temperatures., 46 (6): 705-716.
Hubbs, C. L., and Wisner, R. L., 1980. Revision of the sauries (Pis- ces, Scomberesocidae) with descriptions of two new genera and one new species., 77: 521-566.
Hüssy, K., 2008. Otolith shape in juvenile cod (): Ontogenetic and environmental effects., 364 (1): 35-41, DOI: 10.1016/ j.jembe.2008.06.026.
Hutchinson, W. F., 2008. The dangers of ignoring stock com- plexity in fishery management: The case of the North Sea cod., 4 (6): 693, DOI: 10.1098/rsbl.2008.0443.
Keating, J. P., Brophy, D., Officer, R. A., and Mullins, E., 2014. Otolith shape analysis of blue whiting suggests a complex stock structure at their spawning grounds in the Northeast At- lantic., 157: 1-6, DOI: 10.1016/j.fishres. 2014.03.009.
Kurita, Y., Nemoto, Y., Oozeki, Y., Hayashizaki, K. I., and Ida, H., 2004. Variations in patterns of daily changes in otolith in- crement widths of 0+ pacific saury,, off japan by hatch date in relation to the northward feeding migration during spring and summer., 13 (Sup- pl. 1): 54-62, DOI: 10.1111/j.1365-2419.2004.00312.x.
Libungan, L. A., and Pálsson, S., 2014. ShapeR: An R package tostudy otolith shape variation among fish populations.,10 (3): e0121102, DOI: 10.1371/journal.pone.0121102.
Liu, S., Liu, Y., Fu, C., Yana, L., Xu, Y., Wan, R., Li, J., and Tian, Y., 2019. Using novel spawning ground indices to analyze the effects of climate change on Pacific saury abundance., 191: 13-23, DOI: 10.1016/j.jmarsys.2018. 12.007.
Lombarte, A., and Castellón, A., 1991. Interspecific and intra- specific otolith variability in the genusas deter- mined by image analysis., 69 (9): 2442-2449, DOI: 10.1139/z91-343.
Lombarte, A., and Lleonart, J., 1993. Otolith size changes re- lated with body growth, habitat depth and temperature., 373 (3): 297-306, DOI: 10.1007/ BF00004637.
Mérigot, B., Letourneur, Y., and Lecomte-Finiger, R., 2007. Cha- racterization of local populations of the common sole(Pisces, Soleidae) in the NW Mediterranean through oto- lith morphometrics and shape analysis., 151 (3): 997-1008, DOI: 10.1007/s00227-006-0549-0.
Miyamoto, H., Suyama, S., Vijai, D., Kidokoro, H., Naya, M., Fu- ji, T., and Sakai, M., 2019. Predicting the timing of Pacific saury () immigration to Japanese fishing grounds: A new approach based on natural tags in otolith annual rings., 209: 167-177, DOI: 10.1016/j.fishres.2018. 09.016.
Stephenson, R. L., 1999. Stock complexity in fisheries manage- ment: A perspective of emerging issues related to population sub-units., 43 (1-3): 247-249, DOI: 10. 1016/S0165-7836(99)00076-4.
Stransky, C., Murta, A. G., Schlickeisen, J., and Zimmermann, C., 2008. Otolith shape analysis as a tool for stock separation of horse Mackerel () in the Northeast At- lantic and Mediterranean., 89 (2): 159-166, DOI: 10.1016/j.fishres.2007.09.017.
Suyama, S., Kurita, Y., and Ueno, Y., 2010. Age structure of Pa- cific saurybased on observations of the hya- line zones in the otolith and length frequency distributions., 72 (4): 742-749, DOI: 10.1111/j.1444-2906. 2006.01213.x.
Suyama, S., Nakagami, M., Naya, M., and Ueno, Y., 2012a. Com- parison of the growth of age-1 Pacific sauryin the Western and the Central North Pacific., 78 (2): 277-285, DOI: 10.1007/s12562-011-0459-z.
Suyama, S., Nakagami, M., Naya, M., and Ueno, Y., 2012b. Mi- gration route of Pacific sauryinferred from the otolith hyaline zone., 78 (6): 1179-1186, DOI: 10.1007/s12562-012-0546-9.
Suyama, S., Oshima, K., Nakagami, M., and Ueno, Y., 2009. Sea- sonal change in the relationship between otolith radius and body length in age-zero Pacific saury., 75 (2): 325-333, DOI: 10.1007/s12562-008-0039- z.
Suyama, S., Ozawa, H., Shibata, Y., Fuji, T., Nakagami, M., and Shimizu, A., 2019. Geographical variation in spawning histo- ries of age-1 Pacific sauryin the North Pa- cific Ocean during June and July., 85: 495- 507, DOI: 10.1007/s12562-019-01308-0.
Tian, Y. J., Akamine, T., and Suda, M., 2003. Variations in the abundance of Pacific saury () from the north- western Pacific in relation to oceanic-climate changes., 60 (2-3): 439-454, DOI: 10.1016/S0165-7836 (02)00143-1.
Tian, Y. J., Ueno, Y., Suda, M., and Akamine, T., 2004. Decadal variability in the abundance of Pacific saury and its response to climatic/oceanic regime shifts in the northwestern subtro- pical Pacific during the last half century., 52 (1-4): 235-257, DOI: 10.1016/j.jmarsys.2004.04. 004.
Tohoku National Fisheries Research Institute, Fisheries Research Agency TNFRI, 2017.. Tohoku National Fisheries Research Institute, Shiogama, 229 pp (in Japanese).
Tseng, C. T., Sun, C. L., Belkin, I. M., Yeh, S. Z., Kuo, C. L., and Liu, D. C., 2014. Sea surface temperature fronts affect dis- tribution of Pacific saury () in the Northwes- tern Pacific Ocean., 107: 15-21, DOI: 10.1016/j.dsr2.2014.06.001.
Tseng, C. T., Sun, C. L., Yeh, S. Z., Chen, S. C., Su, W. C., and Liu, D. C., 2011. Influence of climate-driven sea surface tem- perature increase on potential habitats of the Pacific saury ()., 68 (6): 1105-1113, DOI: 10.1093/icesjms/fsr070.
Tseng, C. T., Su, N. J., Sun, C. L., Punt, A. E., Yeh, S. Z., Liu, D. C., and Su, W. C., 2013. Spatial and temporal variability of the Pacific saury () distribution in the northwes- tern Pacific Ocean., 70 (5): 991-999, DOI: 10.1093/icesjms/fss205.
Vignon, M., 2012. Ontogenetic trajectories of otolith shape du- ring shift in habitat use: Interaction between otolith growth and environment., 420-421: 26-32, DOI: 10.1016/j.jembe.2012.03.021.
Watanabe, Y., Kurita, Y., Noto, M., Oozeki, Y., and Kitagawa, D., 2003. Growth and survival of Pacific sauryin the Kuroshio-Oyashio transitional waters., 59 (4): 403-414, DOI: 10.1023/a:1025532430674.
Watanabe, Y., Oozeki, Y., and Kitagawa, D., 1997. Larval para- meters determining preschooling juvenile production of Pa- cific saury () in the northwestern Pacific., 54 (5): 1067-1076, DOI: 10.1139/cjfas-54-5-1067.
March 24, 2020;
June 1, 2020;
October 9, 2020
© Ocean University of China, Science Press and Springer-Verlag GmbH Germany 2021
#The two authors contributed equally to this work.
. E-mail: yjtian@ouc.edu.cn
(Edited by Qiu Yantao)
杂志排行

Journal of Ocean University of China的其它文章
- Corrosion Mechanism of 5083 Aluminum Alloy in Seawater Containing Phosphate
- Molecular Cloning, Expression and Characterization of Peroxisome Proliferators-Activated Receptors Gamma in the Sea Urchin (Strongylocentrotus intermedius)
- Molecular Characterization and Expression Analysis of SKIV Infection of Interferon-Induced Protein with Tetratricopeptide Repeats 1 (IFIT1) in Epinephelus lanceolatus
- Characteristics and Influencing Factors of the Microbial Concentration and Activity in Atmospheric Aerosols over the South China Sea
- Characteristics of Atmospheric Rivers over the East Asia in Middle Summers from 2001 to 2016
- In vitro Antioxidant Effects of Porphyra haitanensis Peptides on H2O2-Induced Damage in HepG2 Cells