Analysis of secondary electron emission using the fractal method*
2021-01-21ChunJiangBai白春江TianCunHu胡天存YunHe何鋆GuangHuiMiao苗光辉RuiWang王瑞NaZhang张娜andWanZhaoCui崔万照
Chun-Jiang Bai(白春江), Tian-Cun Hu(胡天存), Yun He(何鋆), Guang-Hui Miao(苗光辉),Rui Wang(王瑞), Na Zhang(张娜), and Wan-Zhao Cui(崔万照),†
National Key Laboratory of Science and Technology on Space Science,China Academy of Space Technology(Xi’an),Xi’an 710100,China
Keywords: secondary electron emission yield,the fractal method,multipactor
1. Introduction
Secondary electron emission(SEE)is a phenomenon that when an energetic electron is incident on a solid surface,a considerable number of secondary electrons may be produced. It is found and investigated in various fields such as multipactor[1–5]effect in microwave devices, dielectric window breakdown in high-power microwave sources, and the electron cloud effect in accelerators. Secondary electron yield(SEY),[6–10]which refers to the average emitted secondary electrons per incident primary electron, is frequently used to characterize SEE properties of materials.
As is known,almost all of the material surfaces are found to be rough in nature. It is generally accepted that SEY is heavily influenced by surface topography of materials. So far, there have been many studies on surface characteristics and SEY.Vaughan[11]developed an analytic model considering only the surface roughness for the relationship between the SEY and surface topography with a smoothness factor.The empirical formula considers only the surface roughness for the relationship between the SEY and surface topography.Nishimura et al.[12,13]investigated the effects of a rippled surface structure on SEY properties by Monte–Carlo simulation.Pivi et al.[14]reported a method that reduces SEY by enhancing surface roughness via constructing rectangular grooves on surface of metals. Chang et al.[15–18]proposed to suppress multipactor on high-power-microwave windows by applying regular periodic triangular structures,sawtooth structures,and grooved structures on material surface. Ye et al.[19,20]studied the method to suppress SEY of surface for metal materials by designing regular micro-porous array structures. Cao and Zhang et al.[21]developed a multigeneration model to examine SEY properties of rough surfaces. Zhang et al.[22]also examined the effects of rough surface topography on SEY from a metal surface by considering both the surface roughness and the fluctuation correlation length.
Unlike the case of material surface with regular structures,SEY properties of the material surface with complicated rough surface topography are not enough to be revealed using only roughness because SEY of a rough surface exceeds that of a smooth one in our research of theoretical analysis and experiment. This is in contradiction with the suppression effect of a rough surface, because it is generally thought that a large surface roughness can lead to a low SEY. Therefore, it is inaccurate to reveal SEY properties by only using roughness. In addition, roughness of surface topography depends strongly on resolution of roughness-measurement instrument,and hence the value of roughness will be not unique for a surface when different measure instruments are used. As a result,the predictions of SEY based on this parameter may not be unique to a surface. Fortunately, the fractal method[23–26]is scale-independent and the fractal characterization of surface is independent of resolution of the roughness-measurement instrument. Consequently, if the multipactor threshold of a microwave device is predicted with the SEY which is based on fractal parameters,the value of prediction will be unique once the fractal parameters of the rough surface are fixed.
In this paper, the relationship between surface topography and SEY is analyzed with the fractal method. The paper is organized as follows. In Section 2, the surface model based on the fractal method is described. In Section 3, effects of the fractal parameters on SEY are analyzed using the Monte–Carlo simulation method.[27]In Section 4, based on the relationship between the SEY and the fractal parameters,the multipactor thresholds of microwave devices are predicted.The bridge between the multipactor threshold and the fractal parameters is built. Finally,some conclusions are summarized in Section 5.
2. Surface model based on the fractal method
Surface topography of a material is of high importance in the response of SEY properties. In order to find out the relationship between surface topography and SEY properties,it is necessary to characterize the surface topography accurately.Generally, experimental techniques are used to quantify the surface parameters for surface topography. Roughness is usually used to describe surface topography. However,roughness parameter depends strongly on resolution of measurement instrument and hence the value of roughness parameter will be not unique for a surface. Fortunately, the fractal method has the advantage that the surface modeling is size-independent and there is no dependence on the experimental data acquisition process.

Fig.1. Surface topography of the aluminum sample at different length scales measured by AFM: (a) 10 μm ×10 μm measured by AFM, (b)1 μm×1 μm measured by AFM.
In practical engineering, there are many man-made surfaces such as machined surfaces and wearing surfaces. These surface topographies usually appear to be random,multiscale,and disorderd.Figures 1(a)and 1(b)show the surface topography of a practical microwave device measured with an atomic force microscope (AFM) at different length scales. These man-made surfaces can be represented over at least part of their structural range as self-affine fractal, and have the characteristic of fractal. Therefore, the fractal method has been used as a useful tool in characterization of machined surface topography.
The fractal surface model is proposed by Majumdar and Bhushan based on the Weierstrass–Mandelbort (WM)function.[24]Based on the two-variable WM function,Yan and Komvopoulos developed a three-dimensional function to represent rough surface. The expression is given by
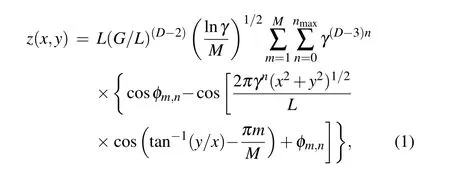
where the parameter D(2 <D <3)is the fractal dimension implying space-filling capacity of the surface,and the parameter G means the characteristic length scale of the surface; x and y are the planar Cartesian coordinates, z is the surface point of height,M denotes the number of superposed ridges used to construct the surface,φm,nmeans the random phase in the interval[0, 2π]; and n denotes the frequency index. The upper limit of n is given by

where int[···]denotes the maximum integer value of the number in the brackets. L is the sample length and Lsis the cut-off length. In most cases, γ =1.5 is found to be a suitable value for high spectral density and for phase randomization.
In order to elucidate the significance of the fractal parameters on surface topography,the three-dimensional fractal surfaces which are obtained from formulas (1) are shown in Fig. 2. The simulated results of fractal surfaces with different fractal parameters are shown in Figs. 2(a)–2(d), and the simulated areas are all 10 μm×10 μm. Comparison of these topographies indicates that,for the fixed simulated parameter D, the smaller the parameter G is, the smoother the surface is. When the parameter G is fixed at a large value such as 1×10⁻⁵,the smaller the parameter D is,the smoother the surface is,whereas the larger the parameter D is,the smoother the surface is when the parameter G is fixed at a small value such as 1×10-11.
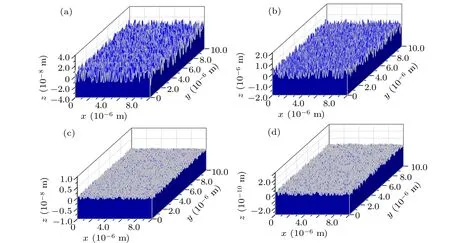
Fig.2. Simulated three-dimensional fractal surfaces: (a)D=2.2,G=1×10⁻⁵;(b)D=2.7,G=1×10⁻⁵;(c)D=2.2,G=1×10-11;(d)D=2.7,G=1×10-11.
According to Ref. [23], it is important to note that there is a bridge to build the roughness parameter and the fractal parameters. The relationship between the roughness σ and the fractal parameters D and G can be written as

where ωlis the lowest frequency which is related to the length of the sample,and ωhis the highest frequency which depends on the resolution of the measurement instrument.
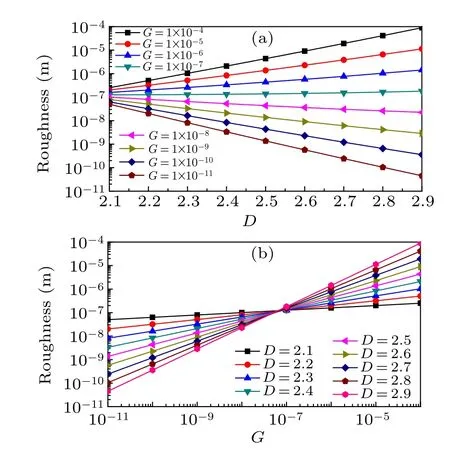
Fig.3. The relationship between roughness and the fractal parameters:(a)the roughness versus D for fixed G,(b)roughness versus G for fixed D.
Figure 3 depicts the relationship between roughness and the fractal parameters by the numerical method with Eq. (3).From Fig.3(a),it can be seen that the roughness of surface topography increases with the parameter D when the parameter G is larger than 1×10⁻⁷, while the roughness of surface topography decreases with the parameter D when the parameter G is less than 1×10⁻⁷. The results of these curves show that only one single roughness parameter is not enough to describe the surface characterization accurately for a roughness surface topography. The fractal parameters D and G can be used to describe the surface characterization more accurate due to the fractal method. Figure 3(b) shows that the roughness of surface topography decreases with the parameter G decreasing,due to the fact that the smaller the parameter G is,the smoother the surface is. The performance is in agreement with Fig.2.
As is known,the perfect smooth surface does not exist.In actual engineering,all the surfaces have roughness. It is worth noticing that the surface roughness is almost always greater than 0.1 μm in practical microwave devices. From Figs.3(a)and 3(b), it can be seen that when the surface roughness is larger than 0.1 μm, the parameter G is greater than 1×10⁻⁷and the parameter D is larger than 2.1. That is to say, when the surfaces topography of the practical microwave devices are characterized by the fractal method, the parameters G and D should be larger than 1×10⁻⁷and 2.1,respectively.
3. Simulation of SEY based on fractal surface
According to Section 2, the metal surfaces with random rough topography are constructed using formulas(1)with different fractal parameters D and G. Then the effects of the fractal parameters on SEE properties from a metal surface can be obtained using the Monte–Carlo simulation method. The schematic of SEE on random rough surface is shown in Fig.4.In the simulation,these random rough surfaces are divided into many small rectangular grids with the same size in the plane.These grids have different height values due to the random characters of these surfaces. Figure 5 displays the schematic diagram of a single rectangular grid. According to the data of these grid points,the information of any point in the grid can be obtained using the two-dimensional interpolation method.The height of the point in the grid can be expressed as

where a and b are the sizes of the rectangular grid,zi,j,zi,j+1,zi+1,jand zi+1,j+1mean the heights of vertices of the rectangular grid. Calculating the trajectory information of each electron tracked in all grids, we can judge whether the electron meets the emission conditions when the Monte–Carlo simulation method is implemented.
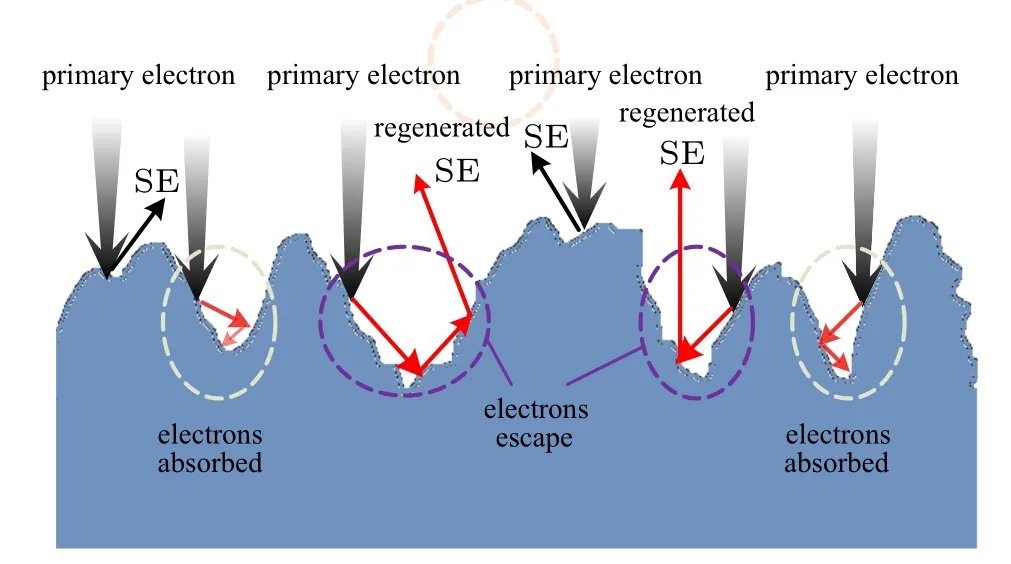
Fig.4. The schematic of SEE on random rough surface.

Fig.5. The schematic of rectangular grid and local coordinate which be used to describe random rough surface.
When a primary electron enters the metal material, its passage and electron trajectory can be simulated using individual electron scattering processes. These scatterings are either elastic scattering or inelastic scattering. For elastic scattering,only the electron direction is changed and the energy is conserved. The elastic scattering is calculated by

where θ′is the scattering angle, σeis the Mott scattering cross section calculated by the combination of tabulation and interpolation based on the differential cross section data in Ref. [28]. For inelastic scattering, the electron direction and energy are all changed. The differential cross section for inelastic scattering is determined by the formulas
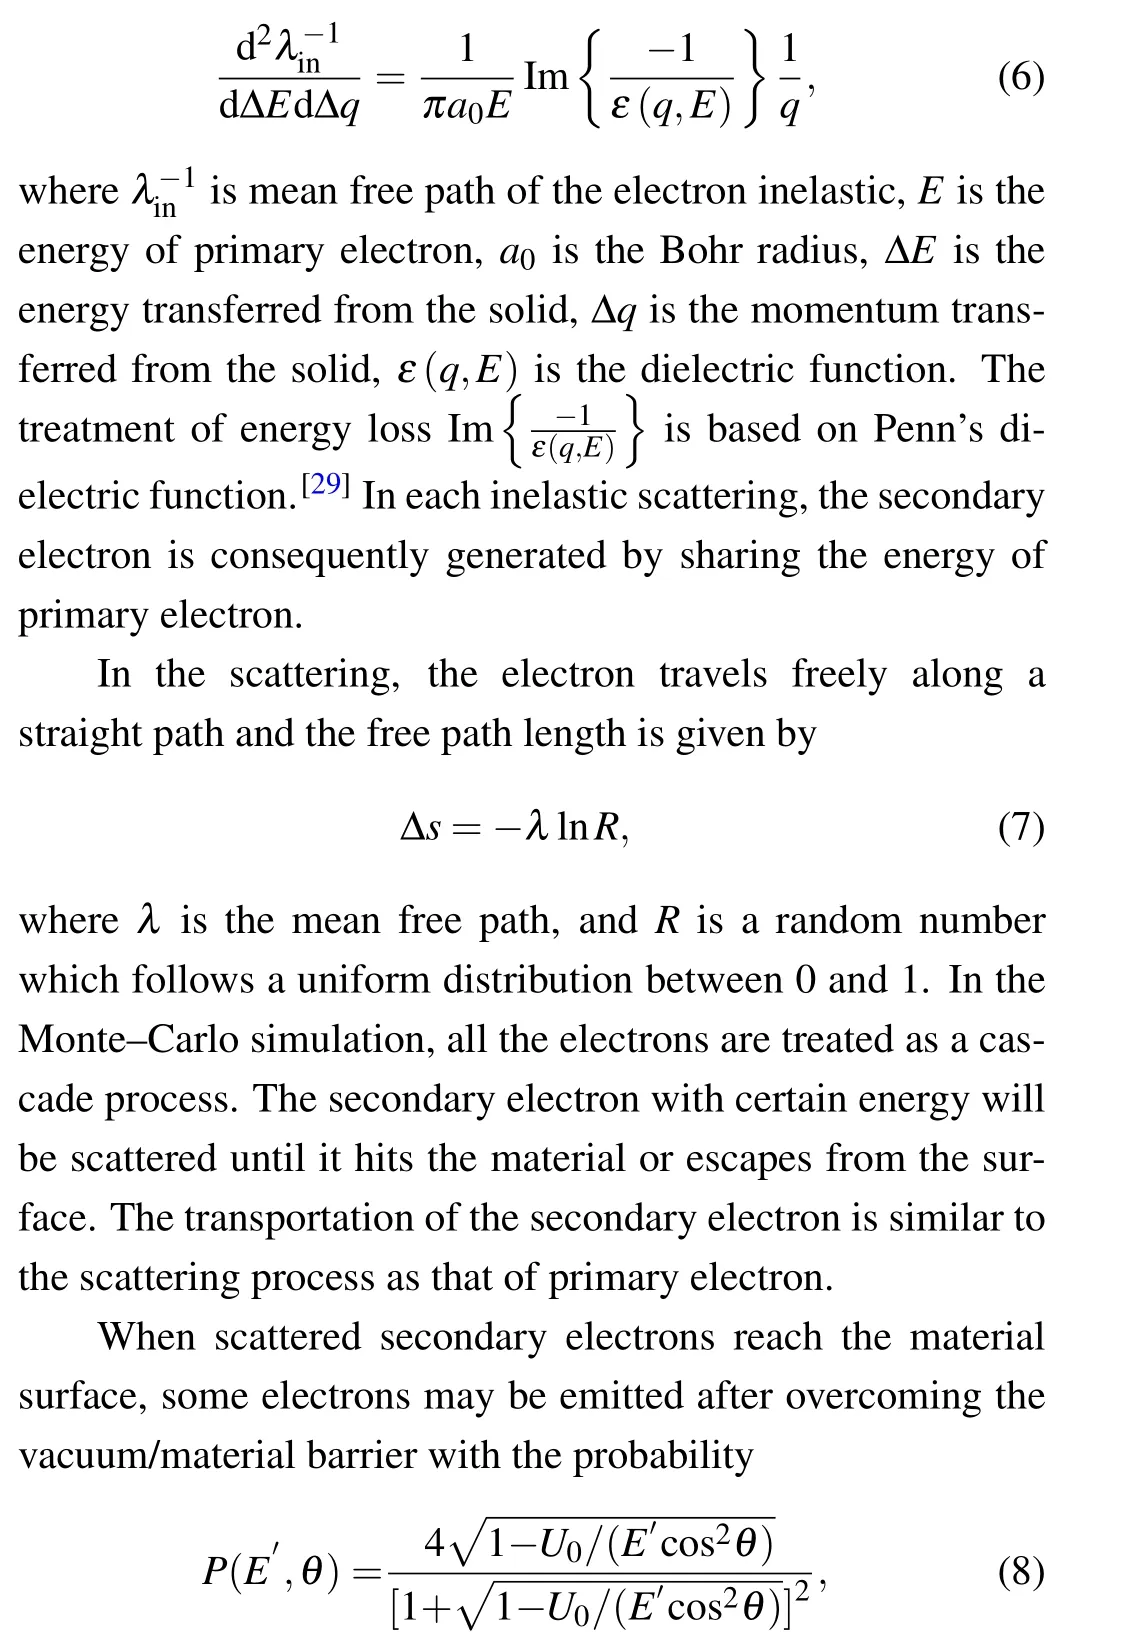
where θ is the ejection angle of electron from surface normal,E′is the electron energy and U0is the inner potential of the material which means the material/vacuum barrier.
Combining the expressions mentioned above and the meshing method for random rough surface,the SEY of a rough surface topography is treated with the multigeneration model proposed in Ref.[21]. When the secondary electrons are emitted from the metal surface,the electron states considering interactions with surface barriers in entrance and emission processes are refreshed.It is noted that the scattering of re-entered electrons is examined similarly to that of the primary electrons. All the electrons are tracked until they escape or their energy is exhausted in the metal. Then the final states of emitted electrons are recorded to achieve effective SEE properties.
Based on the rough surface topography and the Monte–Carlo simulation method for SEE properties,the SEY of metal with rough surface topography are analyzed. The simulation results are shown in Figs.6 and 7.
From Figs. 6(a)–6(d), it can be seen that SEY decreases as the dimension D increases for fixed G. The reason is that the surface is rougher and rougher with the D increasing. This phenomenon agrees with Fig. 3(a). From Fig. 3(a) we know that when the parameter G is larger than 1×10⁻⁷,the surface roughness increases with the parameter D increasing. When a surface becomes rougher,it is difficult for the entered electrons to escape surface.As a result,more electrons are collected and then SEY decreases.Another case is shown in Figs.6(e)–6(h).We can see that SEY almost has no change as the dimension D increases when G is less than 1×10⁻⁷. This means that the surface is quite smooth when G reaches a value,and the effect of the surface topography can be ignored. Figure 3(a)gives an explanation for this phenomenon that the roughness of surface topography decreases with the parameter D increasing when the parameter G is larger than 1×10⁻⁷.
Figure 7 displays that the SEY properties change with different parameter D. From Figs. 7(a)–7(i), it can be seen that when the parameter D is fixed, the value of SEY decreases with the growing parameter G. As the fractal dimension, the smaller the parameter G is, the smoother the surface is. This means that the smoother the surface is, the larger the value of SEY is. This phenomenon agrees with Fig.3(b). It is concluded that the roughness of surface topography increases with the parameter G increasing for a fixed D.
4. The multipactor threashold of microwave devices with different SEY’s based on the fractal method
In order to find out the relationship between the fractal parameters and the multipactor threshold,two different kinds of microwave devices are chosen to analyze the multipactor threshold. During the analysis, SEY based on fractal parameters D and G is used and the multipactor thresholds are obtained with the simulation tools which can provide accurate prediction of multipactors.[30–32]
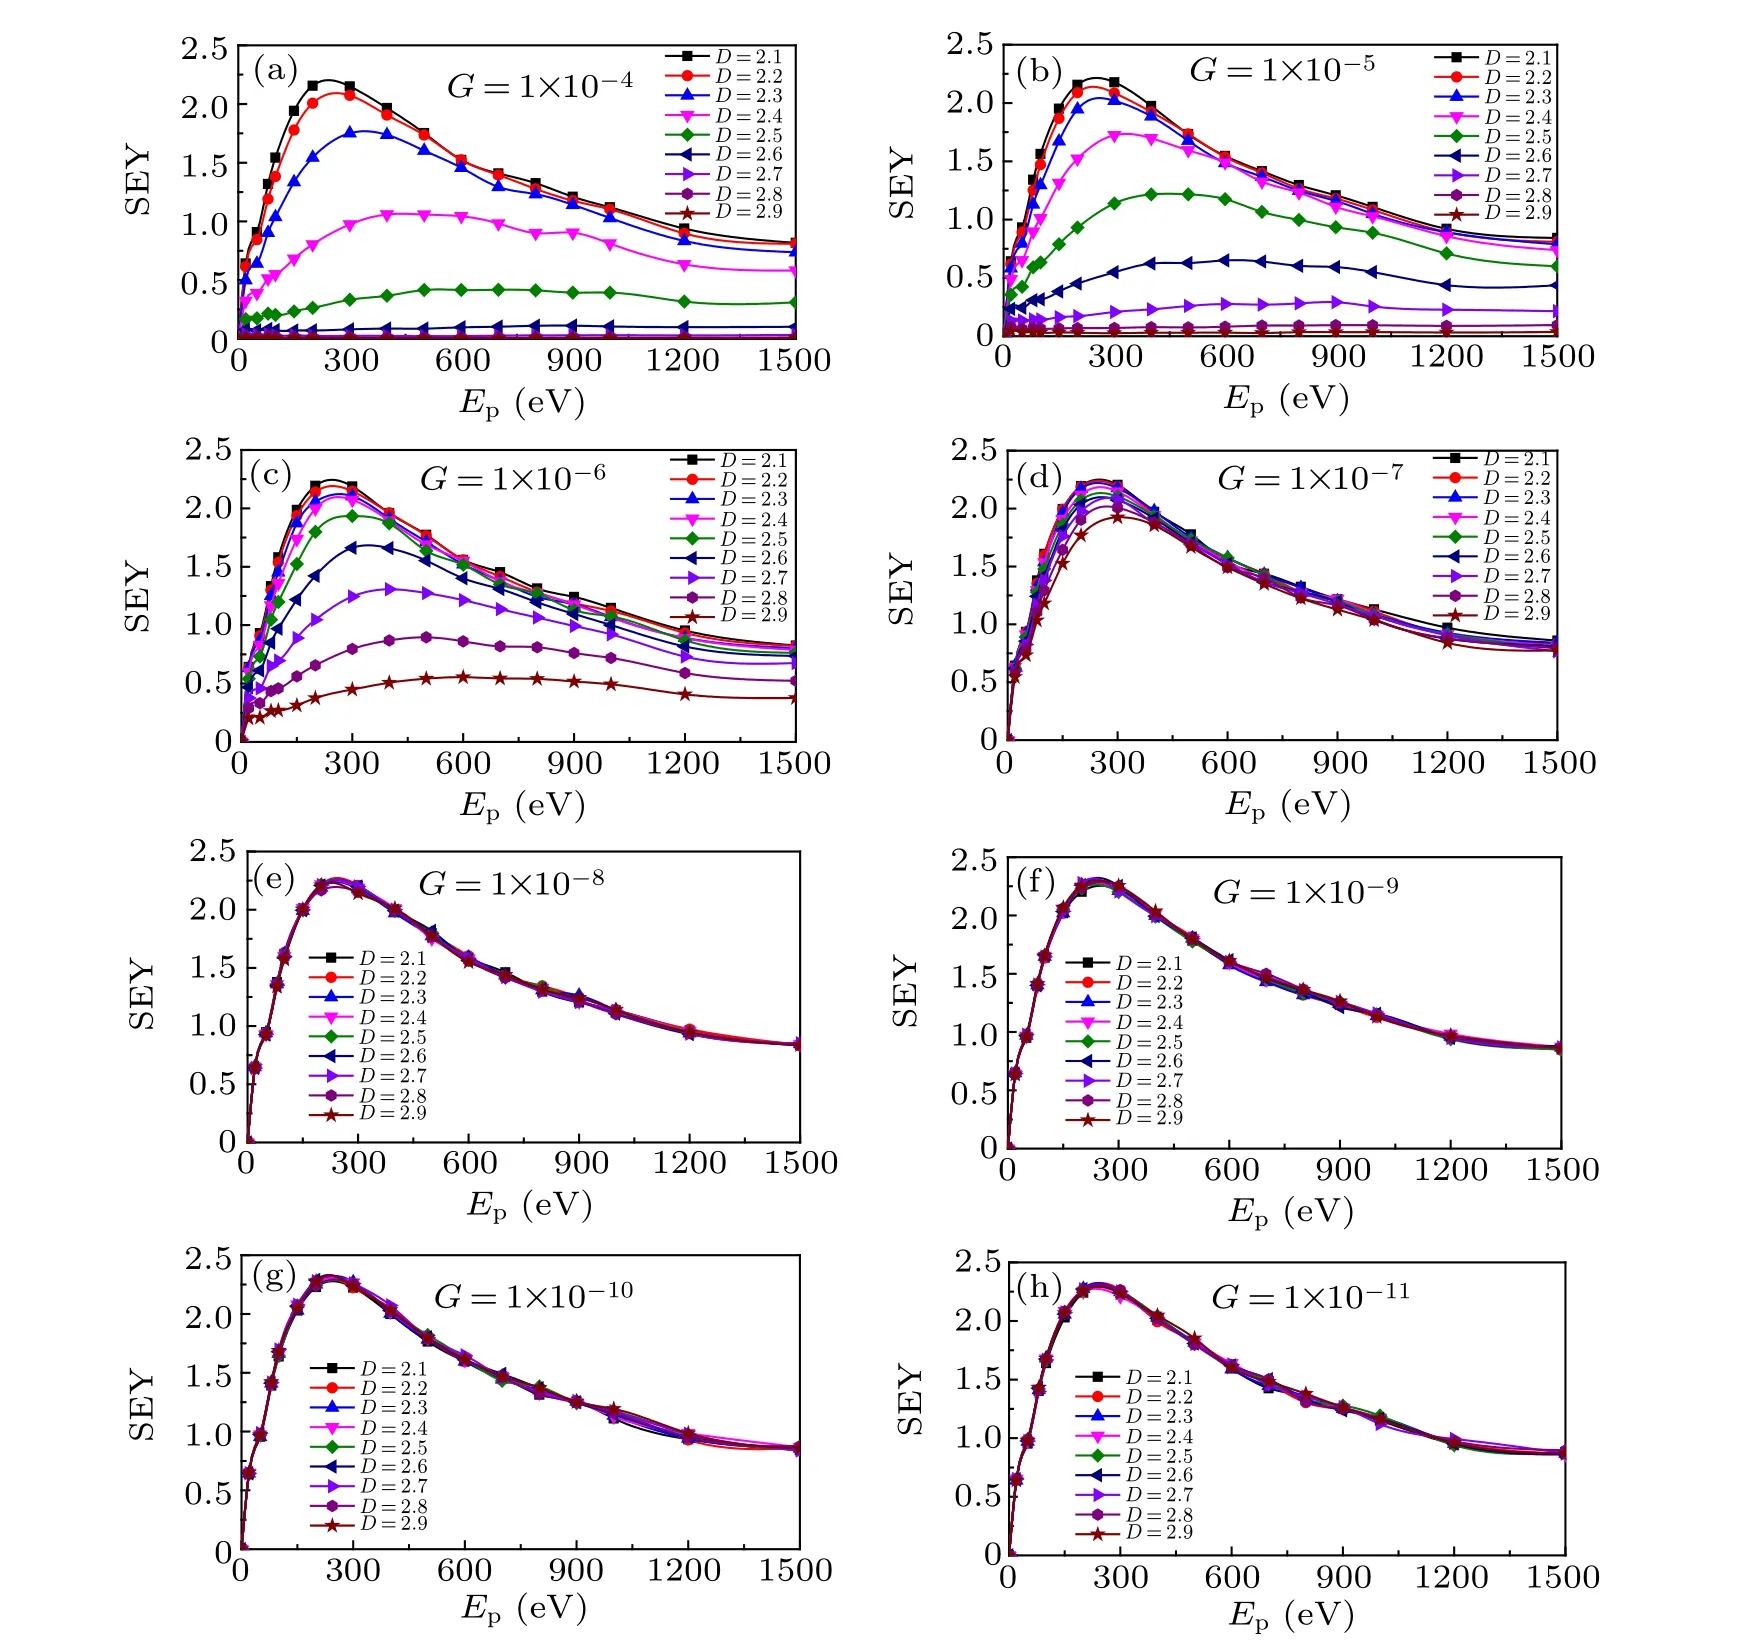
Fig.6. The SEY properties with different D for fixed G: (a)SEY for G=1×10⁻⁴,(b)SEY for G=1×10⁻⁵,(c)SEY for G=1×10⁻⁶,(d)SEY for G=1×10⁻⁷,(e)SEY for G=1×10⁻⁸,(f)SEY for G=1×10⁻⁹,(g)SEY for G=1×10⁻¹⁰,(h)SEY for G=1×10-11.
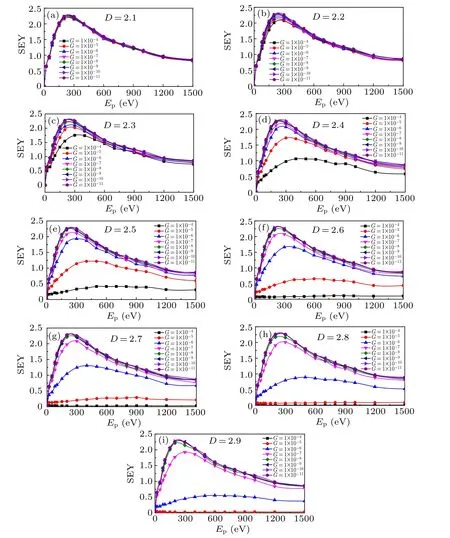
Fig.7. SEY with different G for fixed D: (a)SEY with different G for D=2.1,(b)SEY with different G for D=2.2,(c)SEY with different G for D=2.3,(d)SEY with different G for D=2.4,(e)SEY with different G for D=2.5,(f)SEY with different G for D=2.6,(g)SEY with different G for D=2.7,(h)SEY with different G for D=2.8,(i)SEY with different G for D=2.9.
The two microwave devices take the rectangular impedance transfer working at C-band and the coaxial impedance transfer working at ultrahigh-frequency (UHF)band.The models of the two microwave devices with different structures are shown in Fig.8.
Figures 9(a) and 9(b) display the multipactor thresholds of the rectangular impedance transfers with different SEY’s which are characterized by fractal parameters D and G. From Fig.9(a),it can be seen that the multipactor threshold increases with the dimension G increasing. This is because with the parameter G increasing,the roughness of surface becomes larger and larger. Then the value of SEY decreases with the surface roughness increasing. As a result, the multipactor threshold increases with low values of SEY. The conclusion is in good agreement with Fig. 3(b). In addition, it is also noticed that for a fixed parameter D, when the parameter G is larger than 1×10⁻⁷, the SEY increases fast, while the SEY increases is slowly when the parameter G is smaller than 1×10⁻⁷. The reason is that when the parameter G decreases to some degree,although the surface roughness always decreases with the parameter G decreasing,the SEY of metal material surface will be changed a little.
The curves describing the relationship between the fractal parameter D and the multipactor thresholds of rectangular impedance transfer are shown in Fig.9(b). It can be seen that the multipactor thresholds increase with the parameter D increasing. When the parameter G is less than 1×10⁻⁷, the multipactor thresholds have little change with the parameter D increasing. This means that when the parameter G reaches a fixed value,the surface topography has become quite smooth.In this case, SEY of the metal material surfaces will have no change although the surface roughness still decreases with the parameter D increasing.
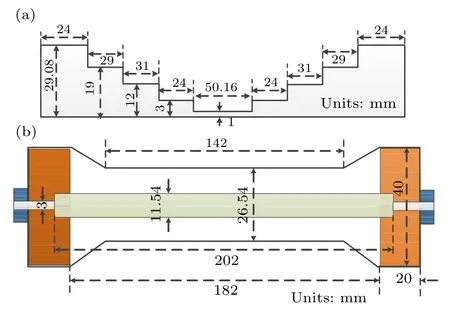
Fig.8. The models of microwave devices for multipactor thresholds(a)for the rectangular impedance transfer and(b)for the coaxial impedance transfer.

Fig.9. The multipactor threshold of rectangular impedance transfer(a)versus parameter G with different parameter D and(b)versus parameter D with different parameter G.
Figures 10(a) and 10(b) display the multipactor thresholds for coaxial impedance transfers with different fractal parameters.The cases are the same as Figs.9(a)and 9(b),respectively. In summary, the multipactor thresholds increase with the surface roughness increasing and the multipactor thresholds decrease with the surface roughness decreasing. When the roughness is reduced to a certain extent, the surface will be quite smooth, and SEY of the surface will reach a fixed value,and then the multipactor thresholds will hold steady. In addition, it is also noticed that the surface roughness usually is about 10-6m for practical microwave devices. By combining practical microwave devices and making a comprehensive analysis of Figs. 3(a) and 3(b), we know that the larger the parameter G is, the rougher the surface is, and the larger the value of D is, the rougher the surface is. That is to say, the larger the parameter G is,the higher the multipactor threshold is,and the larger the value of D is,the greater the multipactor threshold is.

Fig. 10. The multipactor threshold of coaxial impedance transfer (a)versus parameter G with different parameter D and(b)versus parameter D with different parameter G.
5. Conclusion and perspectives
In summary, we have employed the fractal method to characterize the surface topography in analyses of SEY. The relationship of the SEY of metal material surface to the fractal parameters D and G is built. The multipactor thresholds of a C-band rectangular impedance transformer and a UHFband coaxial impedance transformer are predicted.The results show the influence of the fractal parameters D and G on SEY and the multipactor threshold of microwave devices. The results further reveal the effect of surface topography on SEY,which gives a comprehensive insight into the control of SEY properties using the fractal parameters.
Furthermore,it is also noticed that the values of SEY for the surface topography are quite low, even approximately to zero for some fractal parameters. According to the research of predecessors, we can also know that the present results are beneficial for enhancing the multipactor thresholds of microwave devices, when SEY of surface topography is as little as possible. Multipaction will not occur when the SEY of surface topography is less 1. However, the surface resistance will become larger with the SEY decreasing due to roughness.Consequently,this will result in the increase of RF power loss and then have an influence on performance of microwave devices. Therefore,the surface topography for which the SEY is approximately zero is not suitable for enhancing multipactor threshold of microwave devices in practical engineering. In the future,we will focus on constructing the surface topography with low SEY and low surface resistance.
猜你喜欢
杂志排行

Chinese Physics B的其它文章
- Two-dimensional finite element mesh generation algorithm for electromagnetic field calculation*
- Stable water droplets on composite structures formed by embedded water into fully hydroxylated β-cristobalite silica*
- Surface active agents stabilize nanodroplets and enhance haze formation*
- Synchronization mechanism of clapping rhythms in mutual interacting individuals*
- Theoretical study of the hyperfine interaction constants,Land´e g-factors,and electric quadrupole moments for the low-lying states of the 61Niq+(q=11,12,14,and 15)ions*
- Ultrafast photoionization of ions and molecules by orthogonally polarized intense laser pulses: Effects of the time delay*