Magnetic properties of oxides and silicon single crystals
2022-08-31ZhongXueHuang黄忠学RuiWang王瑞XinYang杨鑫HaoFengChen陈浩锋andLiXinCao曹立新
Zhong-Xue Huang(黄忠学) Rui Wang(王瑞) Xin Yang(杨鑫)Hao-Feng Chen(陈浩锋) and Li-Xin Cao(曹立新)
1Beijing National Laboratory for Condensed Matter Physics,Institute of Physics,Chinese Academy of Sciences,Beijing 100190,China
2University of Chinese Academy of Sciences,Beijing 100049,China
Keywords: magnetism,single crystals,oxides,silicon
1. Introduction
The oxide single crystals with cubic lattices, such as SrTiO3(STO,a-axis lattice constant,a= 3.905 ˚A),LaAlO3(LAO,a= 3.792 ˚A), MgO (a= 4.210 ˚A), and(La,Sr)(Al,Ta)O3(LSAT,a=3.868 ˚A),as well as single crystal of silicon (Si,a= 5.431 ˚A) have been found to exhibit magnetic properties[1–6]consisting mainly of three parts: (1)intrinsic diamagnetism signal, (2) paramagnetism signal usually due to 3d impurities incorporated in the crystal structure,and (3) ferromagnetism signal. The third one is believed to be ubiquity of room temperature ferromagnetism (RTF)[1–6]in the oxide crystals,since it was observed for the first time in HfO2thin films by Coeyet al.,[7,8]which was followed by further experimental studies claiming the emergence of the RTF in other oxides films, including thin films of TiO2,[9]ZnO,[10,11]MgO,[12]and graphene,[13]and also in the single crystals as well,[1–6,14,16]such as STO,[1,2,4–6]LAO,[3,5,6]MgO,[4–6]ZnO,[6,14,15]Si,[4]and SiC.[16]It is widely believed that the origin of the RTF is irrelevant to the traditional magnetic elements, while the defects[7–9,11,12,17,18]and/or hydrogen existed ubiquitously[19,20]play an important role in establishing the long-range magnetic order in these materials.
The magnetic properties found in the single crystals are interesting not only from the scientific perspectives as discussed above, but also from the application perspectives as well, one of which is that such single crystals have been widely used as the substrates to grow epitaxially the thin films of,e.g.,the copper oxide superconductors,[21]the colossal magnetoresistive (CMR) materials,[22,23]the iron-based superconductors,[24–26]the Mn-doped zinc-arsenic-based diluted magnetic semiconductors (DMSs),[27]and the microelectronic semi-conductors.[28]The urgent demand to investigate the magnetic properties of the single crystals much more seriously than ever comes from the need to study the synthesis and properties of the thin films of the DMSs.[27]The reasons are simple:the measured magnetic signal of the thin film sample as total is in fact the summation of those coming from the thin film as well as from the substrate single crystal.Obviously the thickness of the substrate single crystal, e.g., 0.5 mm, is three or four orders of magnitude larger than that of the thin film, e.g. 100 nm, while the surface areas of the two are the same. This means that the magnetic signal originating from the substrate single crystal may contribute significantly to the magnetic measurement result of the DMS thin film sample,which consists not only the thin film but also the crystal.[27]The influences of the substrate single crystals must be studied carefully in order to learn the real magnetic properties of the thin films.
In this work, the magnetic measurement and analysis on the above mentioned oxide single crystals, namely, STO,LAO,MgO,LSAT,and Si are carried out. These crystals are frequently chosen and widely used as substrates to grow epitaxially the thin films. A novel analysis method is developed and therefore the diamagnetic, paramagnetic, and ferromagnetic contributions of the crystals are quantitatively characterized and discussed. Furthermore,the influence of the properties of the substrate single crystals on the thin films is quantitatively discussed,which is decisive for studying weakly magnetic thin films such as the DMS films.[27]
2. Experimental methods
Five single crystals Si,STO,LAO,MgO,and LSAT studied in this paper are all 4 mm×2 mm×0.5 mm in size,singleside polished, and purchased from Hefei Kejing Materials Technology Co., Ltd. No further treatments were given to these crystals before the magnetic measurements, except the ultrasonic bathing in acetone and alcohol subsequently. Magnetization measurements were carried out using a SQUIDVSM magnetometer by Quantum Design, with the magnetic field oriented perpendicular to the (001) crystal plane and along the 0.5 mm thick side direction of the crystals.
3. Results and discussion
3.1. Intrinsic diamagnetism
The originally measured curves of the magnetization with the magnetic field at room temperature (300 K) of five substrate single crystals are reproduced in Fig.1(a),with its black dotted central small area enlarged as shown in Fig.1(b). Figure 1(c) reproduces the originally measured results on the magnetic susceptibility of each single crystal as a function of the temperature under the magnetic field 0.1 T,the field which is also labelled correspondingly as a red dashed line drawn perpendicularly in Fig. 1(b) as reference. In addition to the intrinsic diamagnetism possessing a negative magnetic susceptibility in nature,the curves of the magnetization of single crystals STO,LAO,and MgO all show the positive magnetic susceptibilities and obviously non-linear features at low field,which are consistent with the positive(or close to positive)values of the magnetic susceptibilities at 300 K and 0.1 T given in Fig. 1(c). While as for the substrate crystal Si or LSAT,from the first glance of view it seems that there is no obvious non-linear behavior as shown in Fig. 1(b), however, the non-linearity does still exists if one observes the original data more carefully, which in fact can be seen clearly as shown in Fig.2(d)and will be discussed more in details later.
The intrinsic diamagnetic susceptibility tends to change monotonously and linearly with temperature,[29]i.e.,dχdia/dTkeeps constant. The diamagnetic susceptibility can be deduced from the linear fitting of the measurement under high magnetic field. The diamagnetic susceptibilities getting from the linear fitting of the curves in Fig.1(a)and the magnetic susceptibilities reading at 300 K in Fig.1(c)are marked by symbols circles and pentagons in Fig. 1(d), respectively,while the symbols triangles represent the room temperature susceptibility of Si[29]and all the 4 oxides[6]taken from the references. The diamagnetic susceptibilitiesχdiagetting from the linear fitting of the curves in Fig.1(a)are also summarized in Table 1.

Table 1.Diamagnetic susceptibility at room temperature(χdia),variation of diamagnetic susceptibility with temperature(dχdia/dT),saturation magnetization at room temperature(MS,ferro),paramagnetic magnetization at temperature 2 K and field 4.85 T(Mpara(4.85 T,2 K))and impurity concentration(Imp. Con.) of the single crystals.
The diamagnetic susceptibilities of our crystals are roughly consistent at large with the results given in the literatures.[6,29]However the overall susceptibility identified at room temperature under low magnetic field is influenced not only by the diamagnetism but also by the paramagnetism and ferromagnetism,too,leading to the overall measured magnetization signals,i.e.,the summation of the diamagnetic,paramagnetic, and ferromagnetic signals increasing along with the magnetic field but not only decreasing, even becoming an overall positive value in total.Therefore,using theχ–Tcurves under a fixed magnetic field is not a proper way to obtain the right diamagnetic susceptibilities, as can be seen very clearly in Fig.1(d).If one insisted to do so,the analysis thereafter will be obviously unreliable,including,e.g.,to obtain an improper concentration of magnetic impurities in a single crystal.[5]
3.2. Room temperature ferromagnetism
The experimental data as given in Fig. 1(a) are further analyzed. As shown in Fig. 2(a) for the STO crystal, after the high-field linear term is subtracted from the originally measuredM–Hcurve at 300 K (green filled circle), a small ferromagnetic signal (red open circle) can be identified with the saturation magnetic susceptibility 2.8×10⁻³emu/cm3.The low-field (0–0.5 T) region of Fig. 2(a) is enlarged and given in Fig. 2(b), which is further enlarged once again and given in Fig.2(c)for the field of 0–0.05 T.The coercive force and remnant magnetization can be recognized as 29 Oe and 0.15× 10⁻³emu/cm3, respectively. The RTF curves of all five substrate crystals are given in Fig. 2(d), from which the saturation magnetizationMSof the crystals we examined can be deduced. The magnetization signal of Si crystal is relatively small, which is magnified by a factor of 5 as shown in Fig. 2(d). All the saturation magnetizationMSof the ferromagnetic term of 5 crystals are also summarized in Table 1 in which abbreviated asMS,ferroinstead.
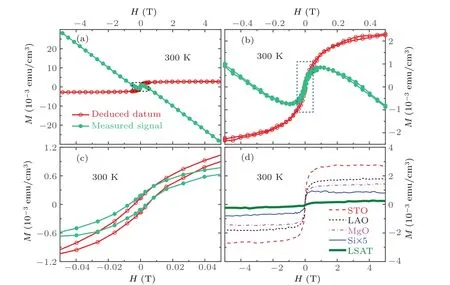
Fig. 2. Ferromagnetic properties of different substrates single crystals: (a) originally measured (green filled circle) and deduced (red open circle)M–H curves at 300 K for substrate crystal STO,(b)enlargement of a central small region in(a)marked by the black dot line,(c)further enlargement of a central small region in(b)marked by the blue dot line,(d)deduced M–H curves at 300 K for different substrates crystals with that of Si magnified by a factor of 5 for its M.
The saturation magnetizationMSthus deduced is shown(symbols round) in Fig. 3, in which some earlier results from the literatures are also shown (symbols star,[4]symbols square,[5]and symbols triangle[6])for comparisons. The Si crystal also shows a ferromagnetism with a saturation magnetization about 1.7×10⁻⁴emu/cm3. The saturation magnetization of our STO or LSAT crystal is roughly consistent with those of their each own corresponding counterpart given in the literatures,[4–6]however that of our MgO or LAO is a bit higher than those reported earlier.[4–6]The reasons behind these divergences are not very clear at the moment, however argument may stem from the different treatments the different crystals undergone previously.[6,16,19,20]The logic to support the above argument is that the surface area has been experimentally found and phenomenally correlated to,and therefore further believed to be responsible for the RTF.[6,16,19,20]It was believed by several different groups of researchers[6,16,19,20]that these single crystals which do not possess the ferromagnetic dopant(s)show the ferromagnetism behavior because of the hydrogen influences, and/or lattice defects, etc, existing inside their surface area.
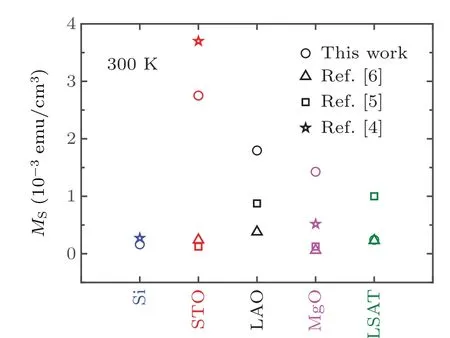
Fig. 3. Ferromagnetic saturation magnetizations at room temperature for our crystals (circles) as well as from Ref. [4] (pentacles), Ref. [5](squares),and Ref.[6](triangles)for comparison.
3.3. Paramagnetism due to 3d impurities
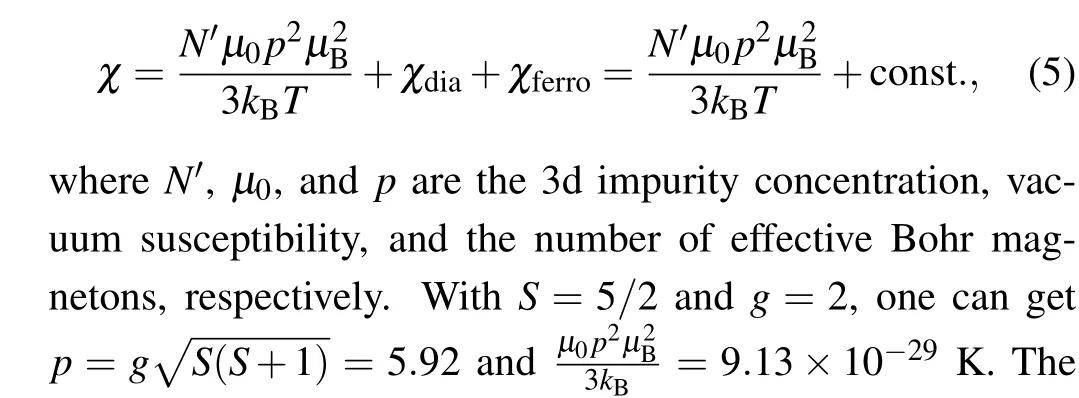
The total magnetization of a single crystal can be expressed as
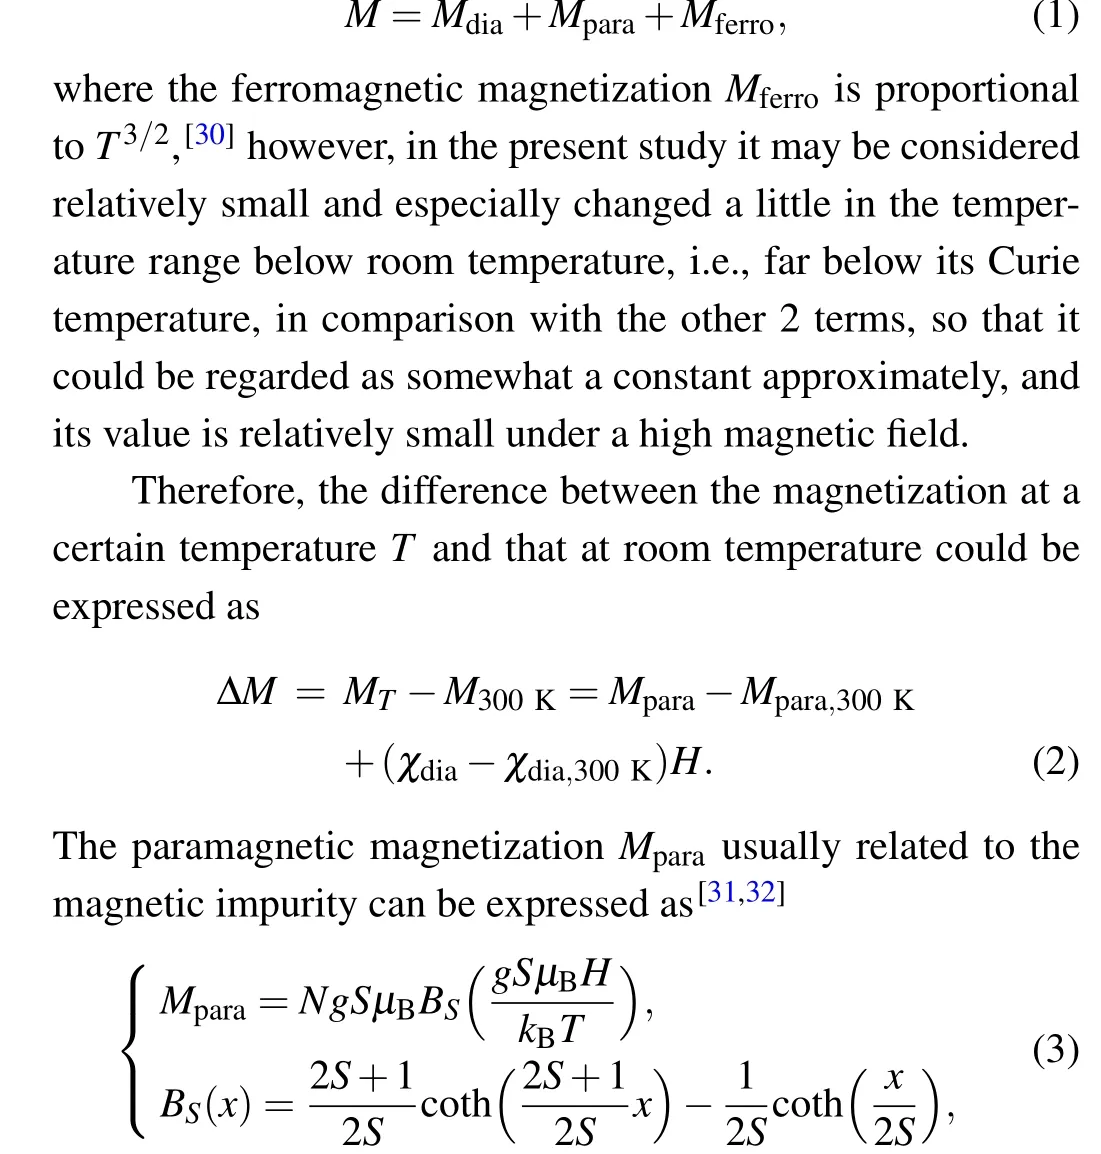
whereNis the number of magnetic impurities per unit volume in average,and the othersS,g,µB,andkBare the spin quantum number,the Lande factor,the Bohr magnetic moment,and the Boltzmann constant,respectively.BSis the Brillouin function in mathematics whose expression is given in Eq.(3),too.
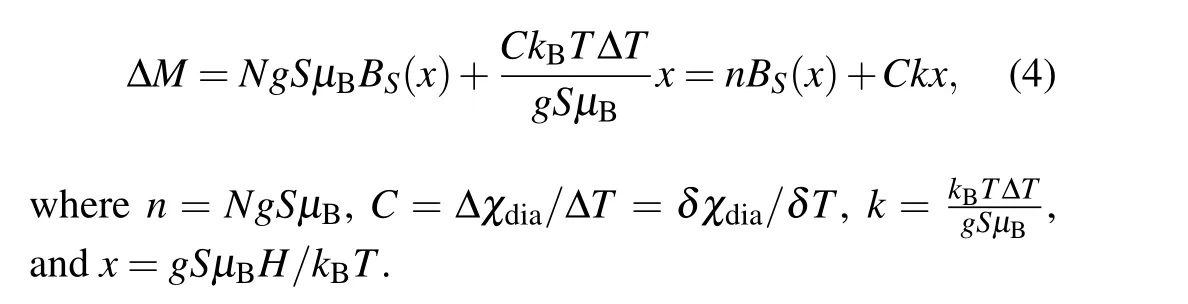
The Brillouin function is particularly sensitive to the temperature,e.g.,under a magnetic field of 1 T,the Brillouin functional value at 2 K is approximately 120 times larger than that at 300 K, so thatMpara,300Kcan be approximately ignored compared toMparaat low temperatures. Meanwhile the intrinsic diamagnetic susceptibility changes linearly along with the temperature,[29]i.e.,(χdia−χdia,300K)is proportional to the temperature difference ∆T=(T −300), and therefore(χdia−χdia,300K)=C×∆T. So equation(2)can be rewritten as
The experimentalM–Hcurves of our substrate single crystal STO measured at different temperatures are plotted in Fig. 4(a). There are 2 dramatic features: (1) the magnetic susceptibility under a high magnetic field keeps negative even when the temperature is down to 2 K,which means obviously the diamagnetic term being dominant under this condition,(2)the magnetic susceptibility is positive under a low magnetic field,because of the contributions from the RTF and the paramagnetism.
The magnetization curves at different temperatures shown in Fig.4(a)were all subtracted to the curve at 300 K,i.e.,deduced to ∆M=MT −M300K, and then replotted in Fig. 4(b)with the independent variablex=gSµBH/kBT. Firstly the data were tried to be fitted by only the Brillouin function term of Eq.(4)withS=5/2,2,or 3/2,as shown in Fig.4(b). The fitting parameterndenotes the termNgSµBin Eq.(4).As seen in Fig.4(b),it is clear that the linear term of Eq.(4)could not be omitted.
Then the data were tried to be fitted by taking both the Brillouin function term and the linear term of Eq.(4)into account withS=3/2,2,or 5/2,respectively,for data taken at 2 K as an example explicitly as shown in Figs.4(c),4(d),and 4(e),respectively. The fitting parameterCappeared in Eq. (4) denotes(∆χdia)/∆T.The solid lines and the dotted lines given in Figs. 4(c)–4(e) represent the Brillouin functional fittings and the linear fittings,respectively,while the dash-dotted lines are summations of both. It is clear that the fitting is the best whenS=5/2 in comparison with its counterpartsS=2 or 3/2,leading to a conclusion that the magnetic impurity inside the STO crystal is 3d metal ion(s) and further a speculation that they are something more likely the ions Fe3+and/or Mn2+,etc.

Fig.4. Fitting of the paramagnetism of the STO crystal: (a)experimental M–H data taken at different temperatures,with the symbols as the original data and the solid lines as the guides to the eyes,(b)∆M=MT −M300 K plots versus x=gSµBH/kBT and fittings with the Brillouin functions only and with S=5/2,2,or 3/2,respectively,(c)∆M plot versus x taken at 2 K and the fittings with S=3/2,(d)∆M plot versus x taken at 2 K and the ftitings with S=2,(e)∆M plot versus x taken at 2 K and the ftitings with S=5/2,(f)∆M–C×k×x plot versus x for all data taken at 2 K,6 K,9 K,12 K,and 20 K,as well as a 2-terms fitting with S=5/2.
3.4. Further analysis on magnetisms
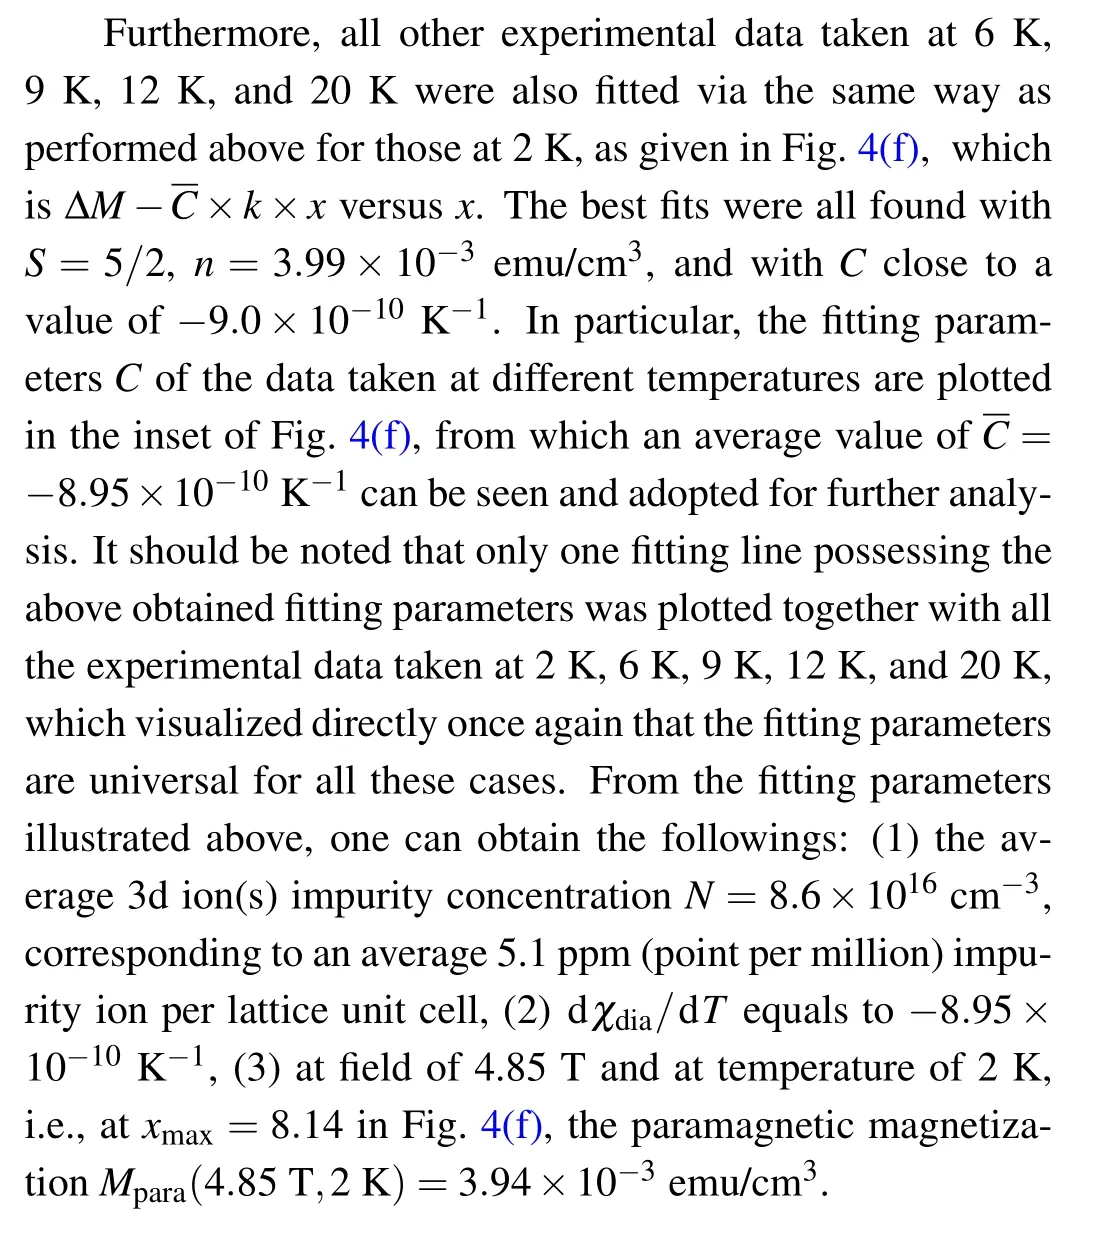
The methodology developed and examined above for the STO crystal was further applied to other crystals, Si, MgO,LAO, and LSAT. The Brillouin function fitting results of(∆M −Ckx)versusx=gSµBH/kBTfor the experimental data taken at 2 K of all 5 crystals are given in Fig.5(a). It should be noted that for all 5 crystals studied here the best fits were all found only in case ofS=5/2,rather than 2 or 3/2,which reveals that the paramagnetism is all introduced by 3d ions impurities.
From the fittings shown in Fig.5(a),the fitting parametersnandCcan be obtained. Furthermore impurity concentrationN, dχdia/dT,andMpara(4.85 T,2 K)for all 5 crystals can be deduced, which are summarized in Table 1. The average 3d impurity concentrationsNfor all 5 crystals deduced from thus Brillouin function fitting are shown in Fig. 5(b), while dχdia/dT,i.e.,∆χdia/∆Tof all 5 crystals studied are shown in Fig. 5(c), with the previously published data[6,29]also shown for references.
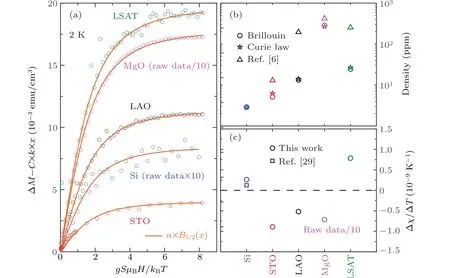
Fig.5. Paramagnetism analyses of substrate single crystals: (a)paramagnetic phase and Brillouin fitting at temperature 2 K after deduction of the influence of diamagnetism, (b) impurity densities of different crystals in comparison with those from the reference,[6] (c) ∆χdia/∆T of 5 our crystals and of one Si crystal from the reference.[29]
Different from the Brillouin function approach utilized above, one can also analyze in an alternatively simple way the experimental result of the magnetic susceptibility versus temperature, as shown in Fig. 1(c), in which at low temperature the variation of the paramagnetism is the dominant term of all because of the followings: (1)c.f. Table 1,the variance ofχdia, say ∆χdia, which can be estimated in a simple way as(dχdia/dT)∆T,is relatively small in comparison withχdialet aloneχ, (2)the ferromagnetic magnetizationχferrois proportional toT3/2,[30]however, in the present study it may be considered relatively small and especially changed a little in the temperature range below room temperature,i.e.,far below its Curie temperature, in comparison with the other 2 terms,so that it could be regarded as somewhat a constant approximately and therefore ∆χferrois considered to be almost zero,(3) it can be seen clearly from Fig. 1(c) that all the 5 experimental data curves keep almost constant in the temperature range roughly higher than 50 K for Si,STO,LAO,and LSAT,or higher than 100 K for MgO,testifying once again it is reasonable to assume the paramagnetism being the decisive figure in the magnetic susceptibility dependency on temperature.
The magnetic susceptibility versus temperature curves shown in Fig.1(c)can be fitted by the Curie’s law[30]

Of all 5 crystals as shown in Fig. 5(b), Si single crystal possesses the least magnetic impurity concentration,2.9 ppm,while the impurity concentrations of the other 3 different perovskite oxide crystals including STO, LAO, and LSAT,∼10 ppm,are from several times to about one order of magnitude larger than that of Si single crystal,except the impurity concentration of the oxide MgO,∼300 ppm,is even one more other magnitude larger than those of the perovskites.
It is interesting to point out that in comparison with the crystals studied earlier,[6]it seems that the perovskite crystals STO, LAO, and LSAT, and oxide crystal MgO we studied in this paper are much more cleaner than the previous ones,[6]in particular,for LAO and LSAT roughly one order less in impurity concentrations in our cases.
Now let us move on to analyze and discuss the intrinsic diamagnetic susceptibility differential dχdia/dT, which were obtained for the first time for the perovsike crystals STO,LAO,and LSAT,and oxide crystal MgO,c.f.Fig.5(c).The value we obtained 2.93×10⁻¹⁰K−1for Si single crystal is a little bit but not much different from the previous result 1.25×10⁻¹⁰K−1(symbol blue square).[29]The intrinsic diamagnetic susceptibility differential dχdia/dTare on the order of 10−9for the 3 perovskite oxides and on the order of 10−8for oxide MgO,c.f.Fig.5(c).
Intrinsic diamagnetism can be written as the summation of the orbital contribution of core electrons,χc<0,the orbital contribution of valence electron,χv<0, and the Van Fleck paramagnetic contribution,χp>0. The temperature dependence of intrinsic diamagnetism can be written as[29]
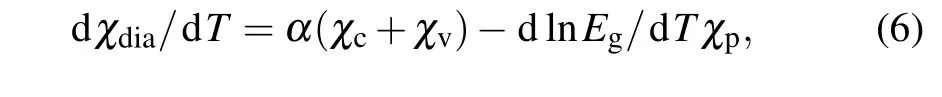
whereαis the thermal expansion coefficient,andEgthe Penn–Phillips gap. Since generallyα> 0, the first term is usually always negative.WhileEgof general semiconductor or insulator always increases with the decrease of temperature,so that the second term is always positive.
Compared to Si single crystal,oxide compounds possess relatively larger thermal expansion coefficients, so that the contribution of the first term may be greater, which leads to the overall dχdia/dTnegative for the crystals STO,LAO,and MgO.However,different from all its other peroskite partners,the dχdia/dTof the LSAT crystal is positive,which suggests the second term being much more decisive in this particular case. This may be true for a solid solution compound like LSAT in which the Van Fleck paramagnetic contribution is boosted strongly.
3.5. Impact of substrate single crystal on magnetic thin film
All the 5 single crystals studied above are frequently used as the substrates to grow epitaxially the thin films.[21–28]It is a must to subtract the magnetic signal from the substrate crystals especially for studying the weak magnetic including the DMS film. Our experimental studies and theoretical analyses are crucial to future studies on the weak magnetic thin films.
(1) The substrate crystal usually is 0.5 mm thick, while the films are down to one monolayer thick being∼0.5 nm,or up to several hundreds nanometer thick being∼250 nm.This means that even if the magnetization per unit volume of the substrate crystal is one millionth up to two thousandth of that of the film,the measured magnetization signals of the substrate crystal and of the film are equal to each other,which is quite serious a problem for studying the weak magnetic thin films.
(2) In order to get rid of the signal from the substrate as much as possible and to obtain relatively pure signal from the film alone, one has to either searching for and trying best to utilize a much cleaner crystal regarding the magnetic performances,or examining carefully the magnetic contributions of the substrate crystal in order to subtract them later on. In the former aspect,Si single crystal is indeed a relatively clean crystal and an easier and best choice serving as the substrate,however thin film epitaxy in most cases do need and ask for some particular crystals rather than only the Si, which means the burden being drifted onto the shoulders of the crystal suppliers.
(3)Of all the 3 terms of the magnetic signals in the crystals,the decisive one distinguishing the different crystals from each other in respect of the quantity of the magnetic signals is the paramagnetic term,which is determined by the concentrations of the impurities inside the crystals. Again, the paramagnetic quantity is a reflection of the quantity of the impurity inside the crystal, i.e., the cleanness of the crystal being the crucial and decisive factor as the criteria to evaluate which crystal is more suitable than others in terms of magnetic characteristics.
4. Conclusion
The magnetic performances of the STO,LAO,and LSAT perovskite single crystals, MgO oxide crystal, and Si single crystal were measured and analyzed thoroughly.The magnetic properties of these single crystals are the summation of the intrinsic diamagnetism, ferromagnetism, and paramagnetism.By assuming a Brillouin function scenario to simulate the intrinsic diamagnetic term,a linear function of the diamagnetic term,and a small constant of the ferromagnetic term,we can fit the experimental results well and obtain the material parameters including the intrinsic diamagnetic susceptibility differential dχdia/dT,the diamagnetic susceptibility at room temperatureχdia,the ferromagnetic saturation magnetization at room temperatureMS,ferro, the paramagnetic magnetization at low temperatureMpara,and the impurity concentrationsNin these 5 different crystals,among which the dχdia/dTwere the first time to be dug out for the STO,LAO,MgO,and LSAT crystals. It was found that the paramagnetic term is decisive in all the 3 terms, which is found to be caused by the 3d impurities doped in the crystals. Our research will be beneficial not only for understanding the magnetic properties as well as their correlations to the intrinsic parameters of these single crystal materials,but also for the epitaxy study on the thin films of the magnetic materials.
Data availability
The data that support the findings of this study are openly available in Science Data Bank at https://www.doi.org/10.57760/sciencedb.j00113.00028.
Acknowledgement
Project supported by the National Natural Science Foundation of China(Grant Nos.61974161 and 11474324).
猜你喜欢
杂志排行

Chinese Physics B的其它文章
- Direct measurement of two-qubit phononic entangled states via optomechanical interactions
- Inertial focusing and rotating characteristics of elliptical and rectangular particle pairs in channel flow
- Achieving ultracold Bose–Fermi mixture of 87Rb and 40K with dual dark magnetic-optical-trap
- New experimental measurement of natSe(n,γ)cross section between 1 eV to 1 keV at the CSNS Back-n facility
- Oscillation properties of matter–wave bright solitons in harmonic potentials
- Synchronously scrambled diffuse image encryption method based on a new cosine chaotic map