Natural Variation of Soluble Sugar Mass Fraction and Its Relationship with Visual Flesh Color in Radish (Raphanus sativus L.) Taproots
2020-06-04LIYuanyuanGAOMinggangHANTailiLIUYiDULeiXULigongandSUNJifeng
LI Yuanyuan, GAO Minggang, HAN Taili, LIU Yi,DU Lei, XU Ligong and SUN Jifeng
(1.Key Laboratory of Biochemistry and Molecular Biology in Universities of Shandong Department of Bioengineering, Weifang University, Weifang Shandong 261061 ,China; 2.Weifang Academy of Agricultural Sciences,Weifang Shandong 261071,China)
Abstract Radish is an important root vegetable crop worldwide. Assessment of sugar composition in taproots of radishes will provide helpful information for quality breeding of radishes. In this study, 195 cultivars including 129 white-fleshed, 48 green-fleshed and 18 red-fleshed radishes were collected and the variation of sugar composition in taproots was evaluated using high performance liquid chromatography analysis in three successive years.Three sugars including glucose, fructose and sucrose were identified in radish taproots. The most abundant sugar was glucose, followed by fructose and sucrose, and more than 20%(46/195) of cultivars were sucrose free. These radish cultivars presented a wide range of variation from a minimum 5.39 mg/g to a maximum of 47.08 mg/g in total sugar mass fraction, from 3.2 mg/g to 27.61 mg/g in glucose mass fraction, from 0.6 mg/g to 19.42 mg/g in fructose mass fraction, from 0 to 9.02 mg/g in sucrose mass fraction,and from 1.01 to 6.67 in glucose/fructose ratio. By cluster analysis, all the tested cultivars were clustered into four groups. Cluster 4 had the highest mean for total sugar mass fraction of 41.81 mg/g, and Cluster 1 had the lowest mean for total sugar mass fractions of 13.68 mg/g. Furthermore, correlation analysis indicated that the sugar mass fraction was significantly correlated with the flesh color. Green-fleshed radishes had the highest amount of sugars, followed by red-fleshed and white-fleshed ones. Overall, glucose and fructose are the main sugars in these radish cultivars. The sugar mass fraction is not related to the skin color, but is strongly correlated with the flesh color of radishes.
Key words HPLC; Sugar profile; Sweetness; Soluble sugar; Radish; Flesh color
Radish (RaphanussativusL.),the family Cruciferae, is an important root vegetable crop[1]. The first record of radish consumption in human nutrition dates back to approximately 2000 BC in ancient Egypt and radish was cultivated from the thirteenth century BC[2]. Nowadays,it represents approximately 2% of total world vegetable production at an estimated 7 million tons/year on average[3]. Radish is a healthy vegetable and is popular in many dishes. The most commercially valuable part of radish is its enlarged root, which is commonly consumed for fresh vegetables, cooking vegetables, salted vegetables, condiments and the processed food such as dried radish[4].
Soluble sugar mass fraction is the major determinant of quality and marketability of fruits and vegetables[5-6], and taste quality is closely associated with the mass fraction and type of soluble sugars[7]. Assessment of sugar composition has been conducted in many fruits and vegetables such as apple[6], almond[8], potato[9]and tomato[10]. Due to the benefits of the radish for human health, researchers have focused more on the identification of radish’s bioactive compounds, e.g. anthocyanins[11], glucosinolates and isothiocyanates[12-13]. Nevertheless, very few studies have reported the sugar composition of radishes. Hara et al.[14]investigated the variations of soluble sugars among only seven radish cultivars, and pointed out that sugar mass fractions may be chemical indexes for the taste of radishes. Therefore, it is very necessary to conduct a more detailed study on sugar composition in radish cultivars.
In this study, a total of 195 radish cultivars with different skin or flesh colors were collected, and their natural variation of fructose, glucose and sucrose mass fraction were analyzed using a high performance liquid chromatography (HPLC) methodology in three successive years.The previous studies indicated that sugar mass fraction was correlated with the fruit color in other plants[15-16]. Therefore, we further investigated the relationship between sugar mass fraction and color of skin or flesh among these radish cultivars. This study will not only contribute to the selection of radish genotypes suitable for different kinds of utilization, but also provide helpful information for quality breeding of radishes.
1 Materials and methods
1.1 Plant materials and field experiments
A total of 195 radish cultivars were used in this study. A trained panel of five experts classified the radishes visually into three groups according to the perception of the flesh color as white, red and green flesh cultivars. These cultivars were grown and evaluated from year of 2015 to 2017. The field experiments were conducted in Weifang,China.Weifang is in the east of China with an average daily temperature of 12.1 ℃ and average rainfall per year of 600 mm. Seeds were sown during mid-August. After seed germination, the distance between the nearest two plants in each row was fixed to 0.20 m at 15 days for usual radishes and 0.10 m at 7 days for cherry radishes. The plants were grown under normal growing conditions,and the harvested based on the previous records of maturity date.
1.2 Sample preparation
Each year, three representative average-sized radishes were selected from each cultivar after harvested. Each selected fresh taproot was hand-washed and cut into three fractions (proximal, central and distal) according to the ratio of 1∶2∶1. The central parts of three radishes of one cultivar were ground with a homogenizer to obtain a homogeneous puree, which were then stored at -20 ℃ for soluble sugar mass fraction measurement by HPLC.
For each sample, one gram of homogenate was transferred to a 10 mL polypropylene centrifuge tube, and 5 mL 80% ethanol was added. The tubes were then warmed at 80 ℃ in water bath for 30 min and centrifuged at 12 000 r/min for 10 min, and the supernatant was collected. To ensure the complete extraction of sugars, the residue was extracted one time again. Finally, the two supernatants were combined and evaporated to dryness by BuCHI R210 type rotary evaporator (water bath temperature of 70 ℃, the pressure of 100 MPa, rotational speed of 3 r/s). The extracted sugars were redissolved into 5ml 50% methanol, and the solution was filtered through a 0.45 μm filter.
1.3 Soluble sugar mass fraction measurement
The analysis of sugars was carried out on an UltiMate 3000 system (Thermo Fisher Scientific, CA, USA) equipped with a Shodex RI-101 detector (Showa Denko K.K., Tokyo, Japan). Sugars were separated by a carbohydrate column (4.6 mm i.d. × 250 mm, 5 μm, Agilent, USA), using a solvent of acetonitrile∶water (8∶2,v/v). The flow rate was 1.0 mL/min at 33 ℃, and the temperature of detection was 33 ℃. Identification and quantification of the major sugars in the samples were achieved by comparing each peak retention time and peak area with those of the standard. Sugar standards were made for glucose, fructose and sucrose. A standard curve for each sugar was prepared by injecting different concentrations of the standard solution and plotting HPLC peak areas versus sugar mass fraction in the standards. The sugar mass fraction of each cultivar was presented as the average value of the three years.
1.4 Estimation of total sugar mass fraction and sweetness index
Total sugar mass fraction was indicated by the amount of three major sugars found in taproots, i.e., glucose, sucrose, and fructose. Sweetness index (SI) for each radish accession was estimated according to a modified method as previously described by Keutgenetal[17]. SI=0.70[Glucose]+1.0[Sucrose]+ 1.75[fructose].
1.5 Data analyses
Statistical analyses were carried out using SPSS statistics 17.0 for windows (SPSS Inc., Chicago, Illinois). Correlations between sugar variables were determined by the coefficient of Pearson. The sugar variables contained fructose, glucose, sucrose, total sugar mass fraction, SI and the ratio of glucose/fructose (G/F). Correlations between sugar and skin and flesh color were calculated using Spearman’s rank correlations. Cluster analyses were performed using R software version 3.4.2 (http://www.R-project.org) with the “hclust” function of the stats package. Ward method was used to cluster these cultivars into similarity groups, and the Euclidean distance was calculated as a measurement of dissimilarity.
2 Results and Analysis
2.1 Soluble sugar mass fraction of 195 radish cultivars
Three sugars including glucose, fructose and sucrose were identified in radish taproots by HPLC, and the sugar mass fraction showed an extensive range of variation among 195 cultivars (Fig. 1). Five sugar variables were distributed in a nearly normal fashion, corresponding to glucose mass fraction, fructose mass fraction, total sugar mass fraction, SI and G/F. Sucrose mass fraction presented a normal distribution with skew to the left. The most abundant sugar was glucose, followed by fructose and sucrose. Glucose ranged from 3.20 to 27.61 mg/g with an average of 14.67 mg/g. Fructose ranged from 0.6 to 19.42 mg/g with an average of 10.43 mg/g. Sucrose ranged from 0 to 9.02 mg/g with an average of 1.11 mg/g. Among 195 radish cultivars, 23.59% (46/195) were free of sucrose, e. g.‘Duanye13’‘Zijinling’ and ‘Fuding’.Only four cultivars had sucrose mass fraction higher than 5 mg/g, i.e.‘Huasuzidaoxin’‘Beijing mantanghong’‘Cuitianmeijiao’ and ‘Mantanghong1’.
For total sugar mass fraction with the range of 5.39 to 47.08 mg/g, the highest value was achieved for ‘Cuishuai’, which was a green-fleshed radish (Fig. 1). For SI, with the range of 6.07 to 53.68, the highest value was achieved for ‘Liwaiqing II’, which was also a green-fleshed radish (Fig.1). For 182 of 195 cultivars, G/F presented value greater than 1.00, indicating that fructose tended to be present in lesser amounts than glucose. Moreover, glucose mass fraction could be found up to fourteen times higher than fructose, as in the case of ‘Weiluobo 5’(Fig. 1).
2.2 Correlation among sugar variables
A correlation matrix (Table 1) showed significant relationships among variables related to sugar composition in radish taproots. A high number of significant (P<0.01) correlations were found among the sugar variables. The highest correlation was observed between total sugar mass fraction and SI (r=0.986**). Among three sugars, the highest correlation was observed between fructose and glucose mass fractions (r=0.742**). Glucose showed correlations with all the other sugar variables, including fructose, sucrose, total sugar mass fraction, SI and G/F. Sucrose, total sugar mass fraction and SI were positively correlated with the rest of sugar variables except G/F. Fructose was negatively correlated with G/F and positively with other sugar variables. G/F presented a weak positive correlation with glucose (r= 0.269**) and a weak negative correlation with fructose (r=-0.359**). There were no significant correlations among other sugar variables.
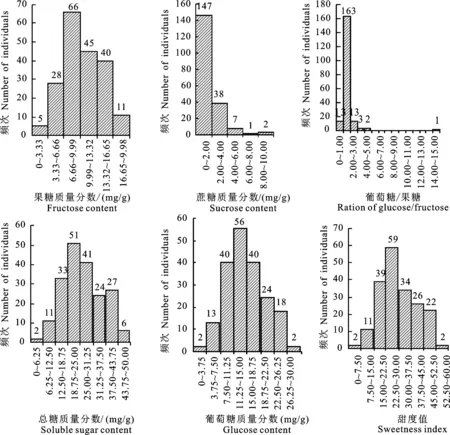
图1 195种萝卜肉质根中可溶糖质量分数、甜度值及葡萄糖/果糖比值的频次分布Fig.1 Distribution of sugar characteristics measured for taproots of 195 radish cultivars
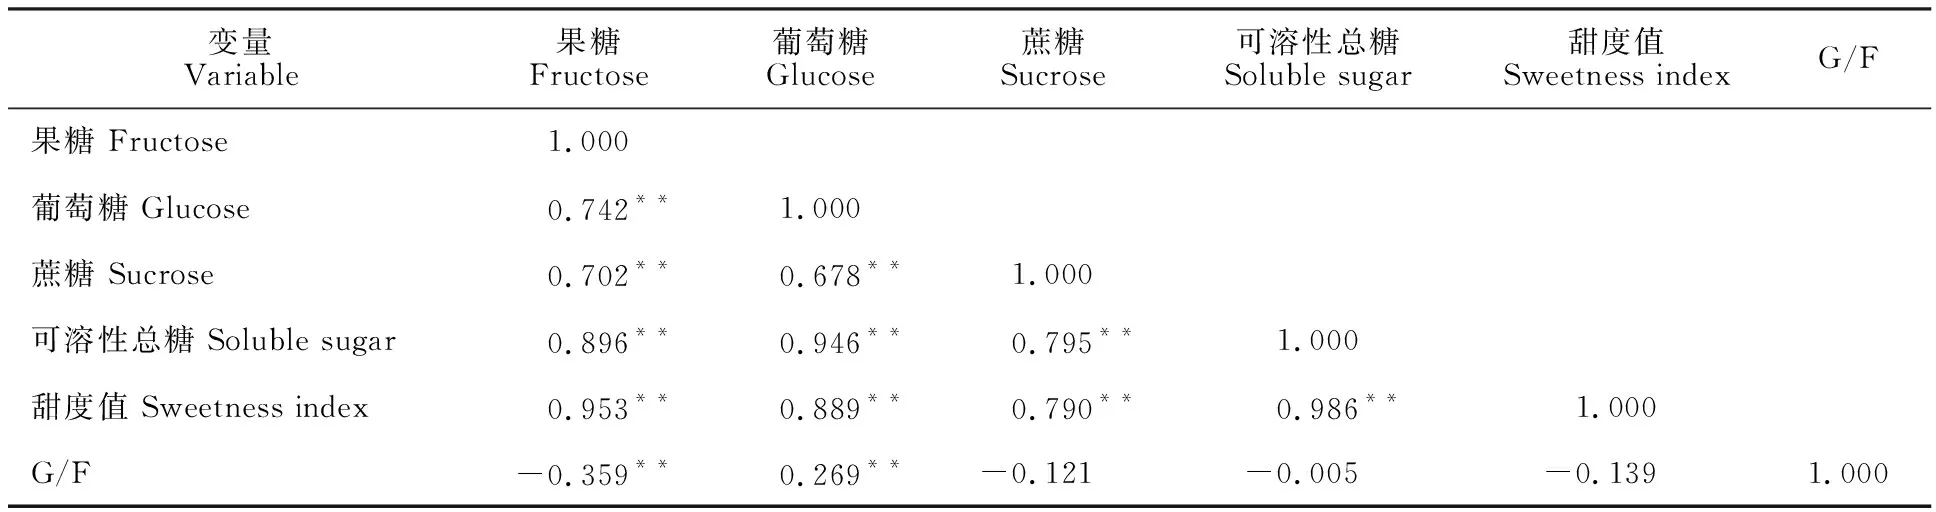
表1 糖变量之间的相关性矩阵Table 1 Correlation matrix among sugar variables
注:“**”P<0.01;G/F.葡萄糖与果糖的比值。
Note:“**”P<0.01;G/F.ratio of glucose/fructose.
2.3 Cluster analyses
All of the 195 radish cultivars were divided into four clusters on the basis of their sugar composition (Table 2). Cluster 1 comprised of 42 cultivars including 40 white-fleshed and two red-fleshed ones. This cluster had the lowest mean for SI of 15.60 and fructose, glucose, sucrose and total sugar mass fraction of 5.70, 7.84, 0.14 and 13.68 mg/g, respectively. In Cluster 2 with average sugar composition, there were 65 cultivars including 62 white-fleshed, one green-fleshed and two red-fleshed ones. Fifty-eight cultivars with higher sugar composition were found in Cluster 3, which included 25 white-fleshed, 11 red-fleshed and 22 green-fleshed ones. And the 30 cultivars, containing 25 green-fleshed, three red-fleshed and two white-fleshed ones, were classified into Cluster 4 with the highest mean for fructose (16.22 mg/g), glucose (22.87 mg/g), sucrose (2.72 mg/g), total sugar mass fraction (41.81 mg/g) and SI (47.11).
To sum up, 79.07% of white-fleshed radishes were assigned to Cluster 1 and 2 with lower sugar mass fraction, whereas 92.42% of colored fleshed (red-fleshed and green-fleshed) radishes were classified into Cluster 3 and 4 with higher sugar mass fraction. These results may suggest the existence of correlation between flesh color and sugar mass fraction in radish taproots.
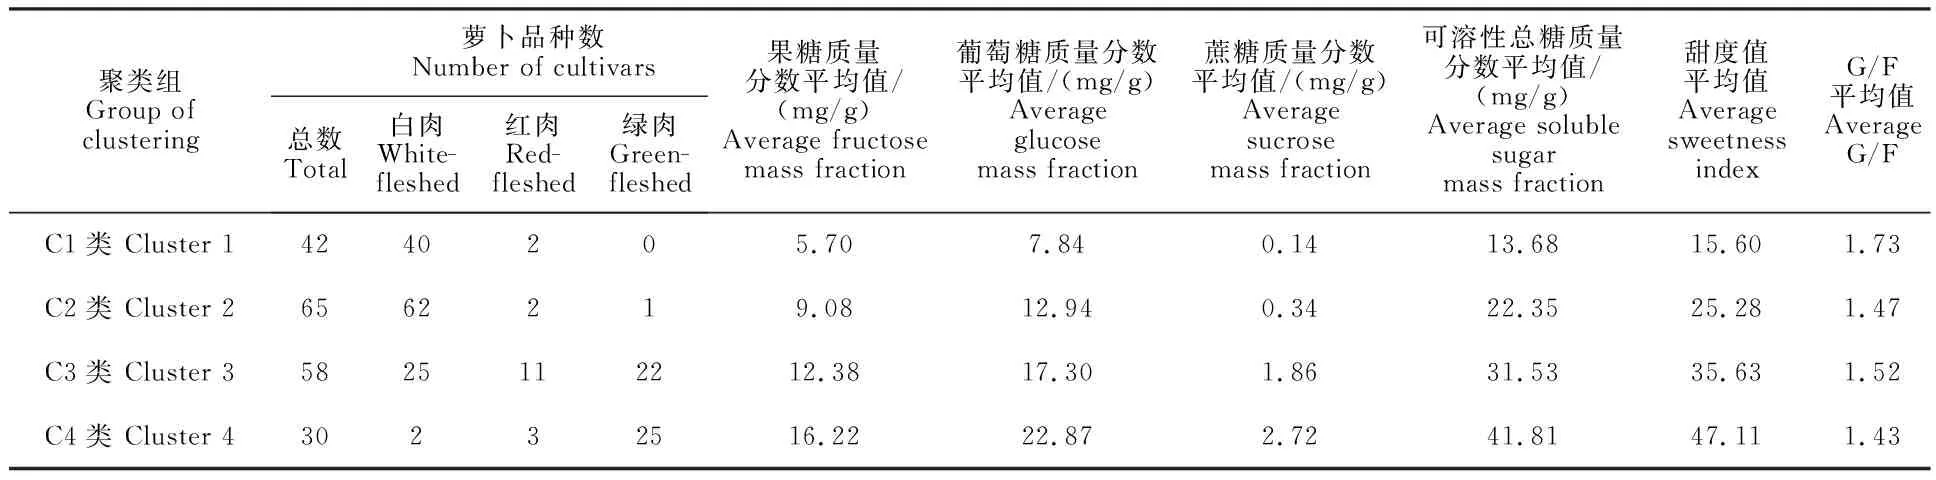
表2 195个萝卜品种的聚类分析结果Table 2 Cluster of 195 radish cultivars
2.4 Correlation between visual radish color and sugar variables
A trained panel of five experts classified the radishes visually into three groups according to the perception of the flesh color as white, red and green flesh cultivars (Fig.2-A). And they separated these radish cultivars according to skin color into seven groups including four monochromatic (i.e., red, purple, white, and black), two bicolor (i.e., red and white, and green and white), and one tricolor (i.e., green, red and white) (Fig.2-B). The correlation between radish color and sugar variables detected by Spearman correlation test is shown in Table 3. No correlation was observed between skin color and sugar variables. However, flesh color significantly correlated with all the sugar variables except G/F (Table 3). The best correlation was observed between flesh color and SI (r= 0.708**). Among the three sugars, fructose had the highest correlation with flesh color, followed by fructose and glucose.
2.5 Comparison of sugar mass fraction among radish cultivars with different flesh colors
The average sugar mass fraction and G/F in different flesh color radishes are shown in Table 4. White-fleshed radishes had lower fructose and sucrose mass fraction than red-fleshed or green-fleshed ones (P<0.05). Glucose mass fractions of green-fleshed radishes were the highest in all the three groups (P<0.05). Additionally, red-fleshed radishes had higher glucose mass fractions than white-fleshed ones (P<0.05). The average total sugar mass fraction was 21.14, 32.43 and 37.49 mg/g in the white-fleshed,red-fleshed,and green-fleshed radishes, respectively. SI ranged from 6.07 to 42.84 in the white-fleshed radishes, from 11.73 to 53.09 in the red-fleshed radishes, and from 6.36 to 48.12 in the green-fleshed radishes (Fig. 1). Green-fleshed radishes had the highest (P<0.05) total sugar mass fraction and SI value in all the three groups. Moreover, red-fleshed radishes had greater (P<0.05) total sugar mass fraction and SI value than white-fleshed ones. The lowest average of glucose/fructose ratio was numerically recorded in white-fleshed radishes, whereas no difference was detected between white-fleshed and green-fleshed radishes.
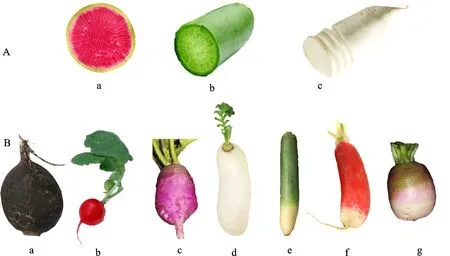
A.肉色:a.红色;b.绿色;c.白色;B.皮色:a.黑色;b.红色;c.紫色;d.白色;e.绿色和白色;f.红色和白色;g.绿色、红色和白色。
A.flesh color:a.red; b.green; c.white;B.skin color:a.black; b.red; c.purple; d.white; e.green and white; f.red and white; g.green,red and white.
注:“**”P<0.01。
Note:“**”P<0.01.

表4 3种不同肉色萝卜可溶性糖质量分数和G/FTable 4 Average mass fraction of sugars and average G/F ratios from three different flesh color groups
注:数据为“平均值±标准差”。同列中的不同字母表示差异显著(P<0.05)。
Note:Data are “mean±standard deviation”.Different letters in superscript within a column indicate statistically significant differences (P<0.05).
3 Discussion
In addition to genotype, there are various factors that can affect sugar mass fraction in plants, such as temperature during growth, mineral nutrition and irrigation[18-19].Critical analytical difficulties emerged due to the potential interactions among these factors when we attempted to characterize accurately sugar mass fraction in numerous cultivars[20]. There is an obvious need to control these environmental factors. In the present study, these radish cultivars collected from different locations were planted in one place at the same time and given the unified cultivation conditions. Moreover, evaluation of sugar mass fraction in radish cultivars was performed for three successive years. Sugar mass fraction of each cultivar was presented as the average value of the three years to minimize environmental effect.
In present study, the concentrations of sugars in a total of 195 radish cultivars were systemically analyzed. Generally, glucose and fructose were the main soluble sugars in radishes which was in agreement with a previous report[14]. Similar results had also been reported in apples[21]and ripe tomato fruits[22]. As suggested by Shiraishi[23], sugar composition can be expressed as the ratio of glucose to fructose plus sucrose (α ratio), and Shiraishi et al.[24]proposed that cultivars were classified into two groups on the basis of α ratio: hexose accumulators (α ratio≥0.81) and sucrose accumulators (α ratio ≤0.80). According to above classification standards, more than 95% of radish cultivars was hexose accumulators, while only 2.05% of cultivars was sucrose accumulators. The hexose- and sucrose-accumulating character in plants may be related to genetic differences and genes regulating sugar metabolism may differ between them[24]. Some cultivars with extreme phenotypes (such as Cuishuai, Liwaiqing II, and Weiluo5)detected in this study will contribute to the further studies of sugar accumulation in radishes.
Color strongly affects consumer perception of quality and is one of the major characteristics in making purchasing decisions on fresh vegetables[25]. In the present study, we found that flesh color,not skin color, significantly correlated with sugar mass fraction, which is a major determinant of internal quality in radishes. Recently, Liu et al.[26]found that flesh color is associated with the sorbitol content in plum cultivars, and the red-fleshed ones had higher sorbitol content compared to the yellow-fleshed ones. However, the highest mass fraction of sugars in our study was found in green-fleshed radishes which had the taproots with a green coloration due to the presence of chlorophyll. Some previous studies reported that many non-foliar organs containing chlorophyll carried on the photosynthesis[27], and this non-foliar photosynthesis could increase the sugar mass fraction at harvest[28-29]. In addition, the green-fleshed cultivars had a longer growing period than others (data not shown), therefore they were under lower temperature conditions at later growth stage. It was reported that the mass fraction of soluble sugars increased when plants were subjected to low growth temperatures[30]. Green-fleshed radishes may accumulate more sugars at low temperature of the late growth.
4 Conclusions
So far as we know, this is the first report on a large-scale HPLC assessment of sugar mass fractions in radishes. Three soluble sugars (glucose, fructose and sucrose) with an extensive range of variation were identified in radish taproots. The mass fraction of glucose, fructose and sucrose ranged from 3.20 to 27.61 mg/g, from 0.60 to 19.42 mg/g and from 0 to 9.02 mg/g, respectively. Glucose was the only sugar which demonstrated significant difference among the experimented radishes with different flesh color. This indicated that glucose might be a useful chemical marker for distinguishing cultivars. Moreover, a good correlation between sugar mass fraction and flesh color was observed (P<0.01). The highest total sugar mass fraction was found in green-fleshed radishes and then in red-fleshed ones. These findings will provide useful information for the production, utilization, and breeding of radishes, and help consumers pick the sweet radishes from markets.