Theoretical analyses of stock correlations affected by subprime crisis and total assets:Network properties and corresponding physical mechanisms∗
2019-11-06ShiZhaoZhu朱世钊YuQingWang王玉青andBingHongWang汪秉宏
Shi-Zhao Zhu(朱世钊),Yu-Qing Wang(王玉青),and Bing-Hong Wang(汪秉宏)
1School of Business,University of Shanghai for Science and Technology,Shanghai 200093,China
2School of Mechanical Engineering,Hefei University of Technology,Hefei 230009,China
3Department of Modern Physics,University of Science and Technology of China,Hefei 230026,China
Keywords:complex networks,total assets,subprime crisis,stock correlations
1.Introduction
For statistical physics and nonlinear dynamics,the complex network is widely studied due to its significance in understanding profound physical mechanism of dynamical systems.[1–4]In general,the complex network can be divided into small world networks,[5]self-similarity ones,[6]regular ones,[7]partly or wholly heterogeneous one.[8]It is capable of modelling real physical or engineering phenomena like traffic flow,[9–15]the transcription of mRNA,[16]the directional motion of active particles,[17–25]etc.,which leads the technology networks,[26]social networks,[27]financial network,[28–39]biological networks,etc.to emerge.[40]Among these researches,the predictions and analyses of stocks in the market are widely studied and analyzed in the financial measure like the management and control of risks.[41]Therefore,the research on the financial network is essential,especially for the stock market.[42]It is widely known that the entire market economy is dependent on variation in financial network,[43]and the stock market is a barometer of social,economic,and financial conditions.[44]Moreover,the correlation among stocks is a key feature of venture capital.Furthermore,due to the interrelationship among stocks,it is quite necessary to use the complex network to study the correlation among real stocks in financial market.[28–39]
Owing to the academic significance and practical values of the complex network,some typical methods have been introduced into the studies like Euler diagram,[45]E-R random diagram,[46]etc.Among these analytical methods,the minimum spanning tree(MST)method is considered as an effective way to identify the risk channel of financial market.[47]However,with this method the importance of network nodes cannot be analyzed. In order to address the weaknesses of MST,the planar maximum filtering(PMFG)method has been adopted in recent years.[48]Specifically,for the(PMFG)method,each stock of the network is seen as a node.Besides,the correlation among stocks is seen as links among the network nodes. Moreover,the planar maximum filter map reflects the construction of the network whose edges are not completely interlinked,and at least two edges of each node are connected to the network nodes,as the network structure has been formed.Besides,another method named the threshold network[49]is quite useful in the theoretical analysis of the financial network.It should be noted that the method of applying the threshold network to the analysis modifies the magnitude of the correlation between node threshold and set threshold for these indicators.[50]In fact,it is advantageous because useful information can also be filtered.These network nodes are arranged according to their values.Besides,by setting the threshold,highly-correlated nodes can be retained because of their high correlation.
Based on the methods above,some studies in this field have been conducted previously.The research conducted by Allen pioneered the financial network.[51]Hereafter,Jiang used resources of Shanghai stock exchange(SSE)to make maximum plane filter maps,the node position and the connection edge of the network graph change with time.[52]In the subprime crisis or during the internet bubble,the network presented a chain-like linear structure. Therefore,a crosscorrelation matrix for the high-frequency data of SSE was made.[53]Since then,the planar maximum filtering method has been used to study the market state in the morning and afternoon.[54]A significant difference in the market was reported. However,although tremendous studies about financial networks have been reported previously,[28–54]there are rare studies about investigating the correlation among stocks.At least,the correlation among stocks has not been extensively investigated.Firstly,it should be clarified that the cross correlation matrix Cijof stock prices is isochronal correlation of stock yield between stock i and stock j. Then,as for the focus of our concerned issue(namely,studying the correlation among stocks by using the cross-correlation matrix),some pioneering studies are reviewed as follows.Shen firstly used the data of SSE,NSE(National stock exchange of India)and NYSE(New York stock exchange)to make a cross-correlation matrix whose maximum eigenvalue represents stock interactions.[55]However,this exploration is only from a macro perspective and does not consider the microscopic one. Then,high-frequency data of NYSE was used to obtain the main components of stock market changes in different industries from a microscopic perspective.[56]While there is no further consideration of time dynamics in their work. Hereafter,a cross-correlation matrix rolling window was introduced.[57]The historical time points of the instability of the Tokyo Stock Exchange was examined.However,this mentioned work did not consider the common characteristics of the market state when the financial crisis emerges.Recently,Qiu took the 30 constituent stocks in the US Dow Jones Index and used the number of associated edges of the network nodes to judge the state of the stock market.[58]The more the number of network nodes seems,the greater the influence of enterprise on the market is.However,the fact that stock quote can be affected by the assets of enterprise is ignored.
To conclude,the correlation among stocks has been extensively studied,which is unlike previous studies.The contributions and improvements of the work can be expanded.Firstly,Asian market stocks and US market stocks are considered with the empirical data in the subprime crisis.Stocks with big assets are more closely linked than stocks with small assets. Secondly,the third characteristic vector quantity of the cross-correlation matrix decreases with assets of Asian enterprises decreasing at the early stage of the subprime crisis.Thirdly,to enhance the competitiveness of the enterprise,adopting different investment strategies and carrying out different competition plans are beneficial to the strategy of customer assets,followed by the enterprise-oriented development,the improvement of the asset structure and the reduction of asset risks,depending on the characteristics of different stages of the customer relationship life cycle. Fourthly,a financial market network is established by the threshold approach.Then,the financial threshold network is composed of different stocks. Besides,the stocks with big assets are divided into small networks in the study,indicating the changes of the whole network at the same time.Fifthly,the total assets of the stock have been taken into account for the analysis of changes in market volatility,proving more accurate information in the study than previous studies.
The rest of this paper is organized as follows.Theoretical derivations of the stock correlation are performed in Section 2,in which the properties of the cross-correlation matrix are presented in detail. Besides,the empirical data of 30 stocks in Asia are extracted.Moreover,the empirical data of 30 stocks in America are put into the analysis.Then in Section 3,the stock correlation affected by subprime crisis and total asset is carefully analyzed.Specially,the network properties and corresponding physical mechanism are reported. By using the empirical data,the moduli of components of eigenvectors are calculated,and the correlation among stocks is analyzed.By comparing stocks in Asia with those in America,it shows that components of the third eigenvector decrease with the asset price of enterprise decreasing and the transition graph about the average correlation coefficient among stocks of the crosscorrelation matrix at different stages can be drawn.The threshold network is applied to selected Asian stocks in order to discuss the dynamics in networks dominated by different thresholds.The PMFG network diagrams for Asian stocks and properties of financial networks are investigated.Finally,conclusions are drawn in Section 4.
2.Method
2.1.Cross-correlation matrix model
In this section,the theoretical method in this study is introduced in detail,including establishing physical models of the complex network,performing numerical simulations and proving the validity of the theoretical analysis. Firstly,the physical model of cross-correlation matrix is proposed in Subsection 2.1.The 30 stocks in Asia and 30 stocks in America are investigated in this study.Besides,it is necessary to define some vital parameters in the construction of model.Specifically,pi(t)is defined as the closing price of the i-th stock at the time point t.N is denoted as the total number of focused stocks(namely,the total stock number).In fact,the dimension of parameter t means day,whose value should be integer.Besides,the value of i ranges from 1 to N.Here in this study,N=30 is satisfied,due to 30 stocks in Asia and 30 stocks in America being considered.Afterwards,based on the physical meaning of pi(t),the logarithmic price return ri(t,∆t)of the i-th stock over an interval ∆t is defined as
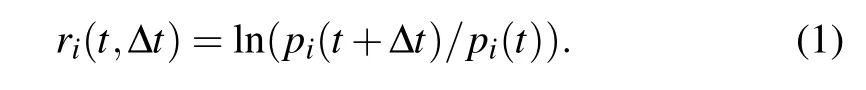
Moreover,time interval ∆t is set as a unit,which indicates a day.In fact,the price return is the rate of returns for investment,generally expressed as an annual percentage,based on the current market price,face value,coupon rate,and distance due date.
Then,based on the analytical expression of logarithmic price return Ri,the normalized price return is derived.Actually,the nature of normalized price return limits the quantity of data that need to be processed in a certain range by means of using designed algorithms.Here,the normalized price return ni(t,∆t)can be derived as


Hereafter,the cross-correlation matrix is derived based on the analytical expression of the normalized price returns,and can be expressed as
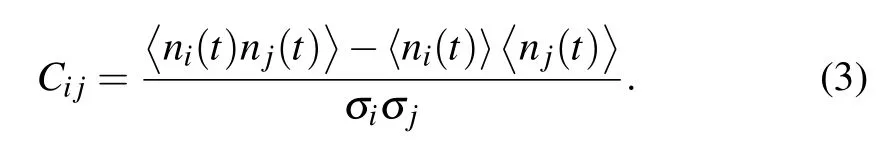
In fact,the physical meaning of Cijdepicts the related income between stock i and stock j.Therefore,the value of Cijranges from −1 to 1. In detail,each element of such a matrix Cijsatisfies
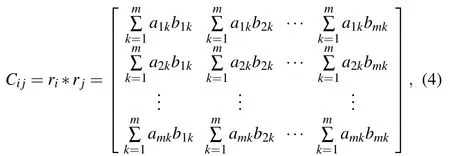
where

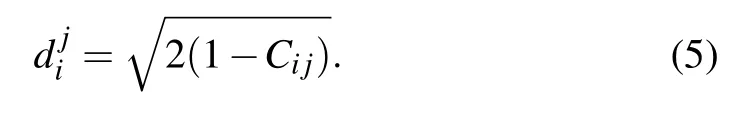
are satisfied.In this study,m=n=30 is satisfied,since 30 stocks have been taken into account.Moreover,the distance of the correlation matrix is then derived according to the analytical solution of equal-time cross-correlation matrix Cijfor Eqs.(3)and(4). Here,an Euclid distanceis introduced by the cross-correlation function suggested by Mantegna,[59]which is obtained by calculating two different eigenvectors aiand ajof equal-time cross-correlation matrix Cij.In fact,the physical meaning of d j i means the distance between i and j for each pair of stock markets,d j i can be derived as
Furthermore,since Cijis a square matrix,the analytical solutions for its eigenvalues and eigenvectors can also be derived. Here,Cijis set as a 30-order matrix,since 30 stocks have been calculated in the study.Then,the variable λ is introduced as an eigenvalue of Cij.Thus,corresponding eigenvector a can also be introduced,which is related to eigenvalue λ.Therefore,the cross-correlation matrix Cijcan be rewritten as
where λkmeans the k-th eigenvalue of the matrix Cijin the descending order.Besides,the parameter k in Eq.(6)represents the number of the eigenvalue of the cross-correlation matrix Cij,while,Ck,ijdenotes the submatrix of Cijand corresponds to the k-th eigenvalue of the matrix Cijand satisfies the following equation:
where ek,iand ek,jdenote the i-th element and the j-th element of the k-th eigenvalue of the cross-correlation matrix Cij.Thus,based on Eq.(6),the correlation among stocks can be expressed by these different eigenvectors a.In fact,in the theoretical analysis of this study,two different cross-correlation matrices C30×30andare calculated in order to depict 30 stocks in Asia and 30 stocks in America respectively.That is to say,Cijalso indicates the closing price of the j-th stock.Similarly,Ck,ijrefers to corresponding elements related to the k-th eigenvalue of the matrix Cij.In the theoretical analysis of the study,Ck,ijalso means the weight of the k-th eigenvalue of the matrix Cijdue to the polarity of the eigenvalue λk.In the calculations,andare satisfied.
Additionally,in order to investigate the properties of proposed financial network,it is necessary to recall and define analytical solutions of typical parameters of network.At first,the node degree kiis introduced. Then,the average degree of network is set asBesides,it can be derived from the nearest average degree knn,iof the concerned node vias
where valijis a binary system reflecting the adjacent matrix and represents the element of the adjacent matrix,and kimeans the degree value of the i-th node.Moreover,valij=1 holds when there exists an edge between the node viand the node vj. Oppositely,valij=0 holds when there appears no edge between the node viand the node vj.Thus,the mean value knn(k)of the average nearest neighbor degree is derived as
where k represents a value of node degree,and,in fact,it can be set as any value,as long as the specific value of k is an integer;p(k)depicts the degree distribution function,Num refers to the total number of nodes in the focused network.The average clustering coefficient C satisfies the following equation:

2.2.Empirical data
Based on the theoretical analysis in Eqs.(1)–(10),empirical data from real financial market are brought into this study.It should be noted that all empirical data used in this studyare historical stock quotes obtained from the financial section of Yahoo.[60]Specifically,30 stocks in Asia and 30 stocks in America are extracted.Specifically,considered in this work are 17 stocks from SSE corresponding to the original empirical data symbol‘+SS’in Table 1,4 stocks from Shenzhen Stock Exchange(namely,SZSE)corresponding to the original empirical data symbol‘+SZ’in Table 1,6 stocks from Hong Kong Stock Exchange(namely,HKEx)corresponding to the original empirical data symbol‘+HK’in Table 1,2 stocks from Taiwan Stock Exchange(namely,TWSE)corresponding to the original empirical data symbol‘+TW’in Table 1,and 1 stock from Korea Exchange(namely,KRX)corresponding to the original empirical data symbol‘+KS’in Table 1.Actually,the data of all 30 Asian stocks are listed in Table 1.
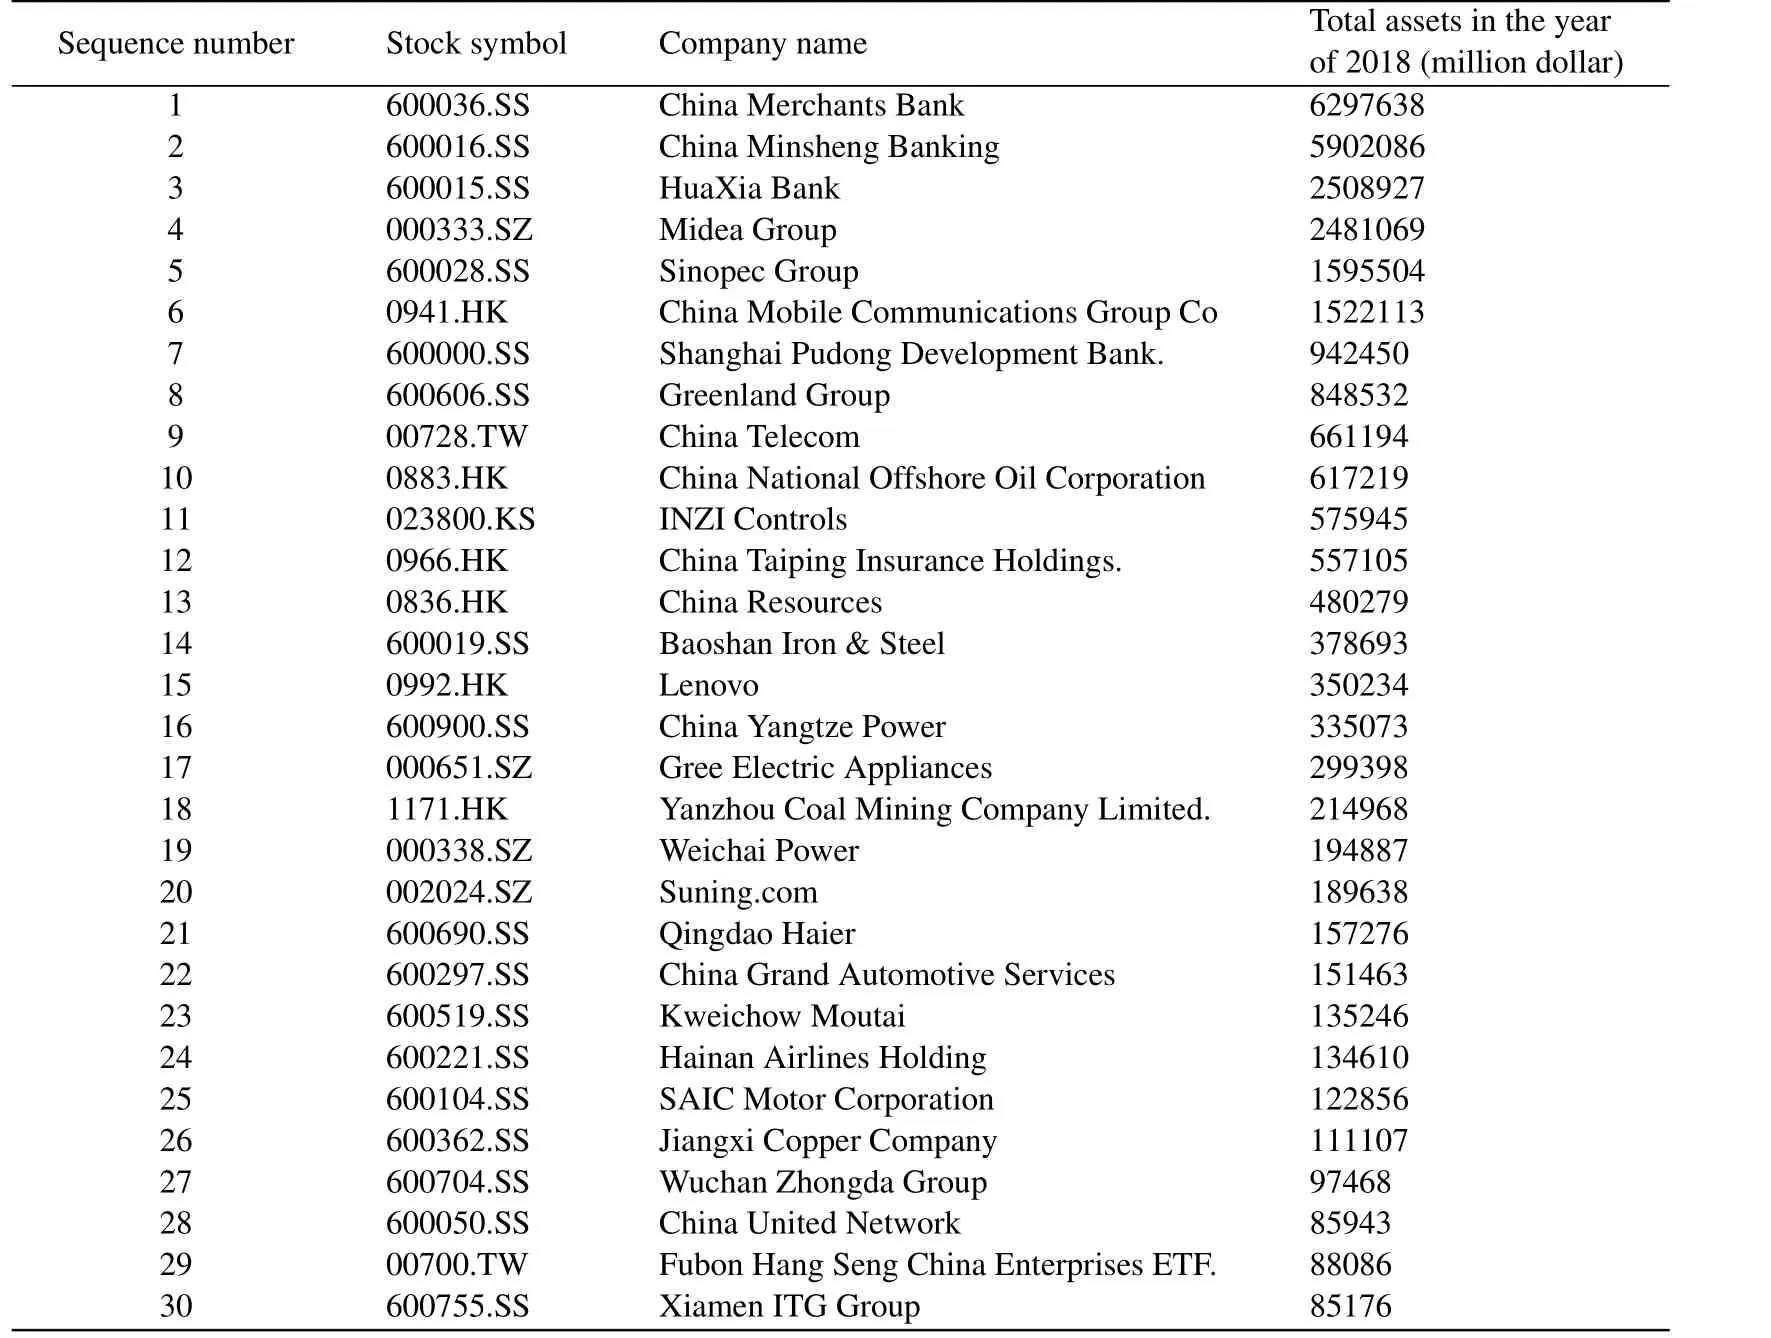
Table 1.Empirical data of Asian stocks.Thirty stocks in Asian market are considered.
Besides,in Table 2 considered are 30 stocks from Dow Jones Industrial Average are also considered.[61]In fact,the original empirical data of the 60 stocks mentioned above(namely,30 Asian stocks and 30 American stocks)can be divided into seven parts which are expanded as 7 columns of the original data file.The information contained in these mentioned seven columns(from the first column to the seventh one)is as follows:the trading day(i.e.,‘Date’),the opening price(i.e.,‘Open’),the highest price(i.e.,‘High’),the lowest price(i.e.,‘Low’),the closing price(i.e.,’Close’),the subscription price(i.e.,‘Adj Close’),and the trading volume(i.e.,‘Volume’).

Table 2.Empirical data of American stocks(thirty stocks from Dow Jones Industrial Average).
Moreover,Table 3 shows a case of the focused empirical data,which corresponds to China Merchants Bank(i.e.,‘600036.SS’).While,in the work,only the trading day and the closing price of each stock are kept,which directly leads to 120 columns illustrating the information about these emphasized 60 stocks.Specifically,the trading day and the closing price in 30 columns of thirty Asian stocks are extracted.Similarly,the trading day and the closing price in 30 columns of thirty American stocks are extracted.
It should be emphasized that the empirical data of 30 American stocks are obtained from the trading information during the period from January 3,1994 to December 31,2013.Besides,the data of thirty Asian stocks are obtained from the trading information during the period from January 1,2004 to September 12,2018.Moreover,in order to draw the conclusion of the work,the data truncation is carried out.Specifically,the data of Asian stocks and American stocks from June 1,2005 to January 29,2010 are used.However,the trading during the concerned period lasts 1081 days and 1175 days,separately.Although the same interval is taken into account,the total number of the trading days for further calculations is quite different from that for Asian stocks and American stocks.This is due to the fact that the suspension of stocks in Asia and America are quite different from each other. Generally speaking,industrial stocks in America have much longer time series than Asian stocks due to earlier launch into the market,stable production and almost no fluctuations in stocks. Besides,in order to ensure the universality of obtained results and obtain universal statistical laws,all data should meet the condition that each stock should be open or in usual trading.If stocks are in the closing state brought by anyone,stocks on that day should be abandoned.That is to say,the original data of these 30 stocks in Asia and 30 stocks in America have been intercepted.Besides,it should be noted that the basis for data truncation here has covered three stages of subprime crisis,namely,the period occurs separately before subprime crisis,during subprime crisis,and after occurring subprime crisis,which leads to the more objective reflecting the influence of subprime crisis on the stock correlation.The focused temporal series can be divided into four temporal segments,i.e.,regular time in the interval from June 2005 to July 2006,the presubprime crisis in the interval from August 2006 to September 2007,the peak of subprime crisis in the interval from October 2007 to November 2008,and the latter stage of subprime crisis in the interval from December 2008 to January 2010.In fact,the calculation of the correlation matrix presented in the next section is based on these empirical data extracted from the 30 Asian stocks and 30 American stocks mentioned above.The closing price of these stocks is also emphasized,and the stock is obtained on condition that the trading date are suitable for all focused stocks.Besides,the closing price of these stocks is arranged in the order of the ranks of the total assets of each stock.[62]That is to say,the calculation of correlation matrix presented in the next section is actually based on 60 columns of information about the closing price of these 30 Asian stocks and 30 American ones.Then,these mentioned data are normalized.That is to say,the values of these normalized data range from 0 to 1.In fact,it should be emphasized that the performing normalization is due to the modulus of component of eigenvector ranging from 0 to 1.
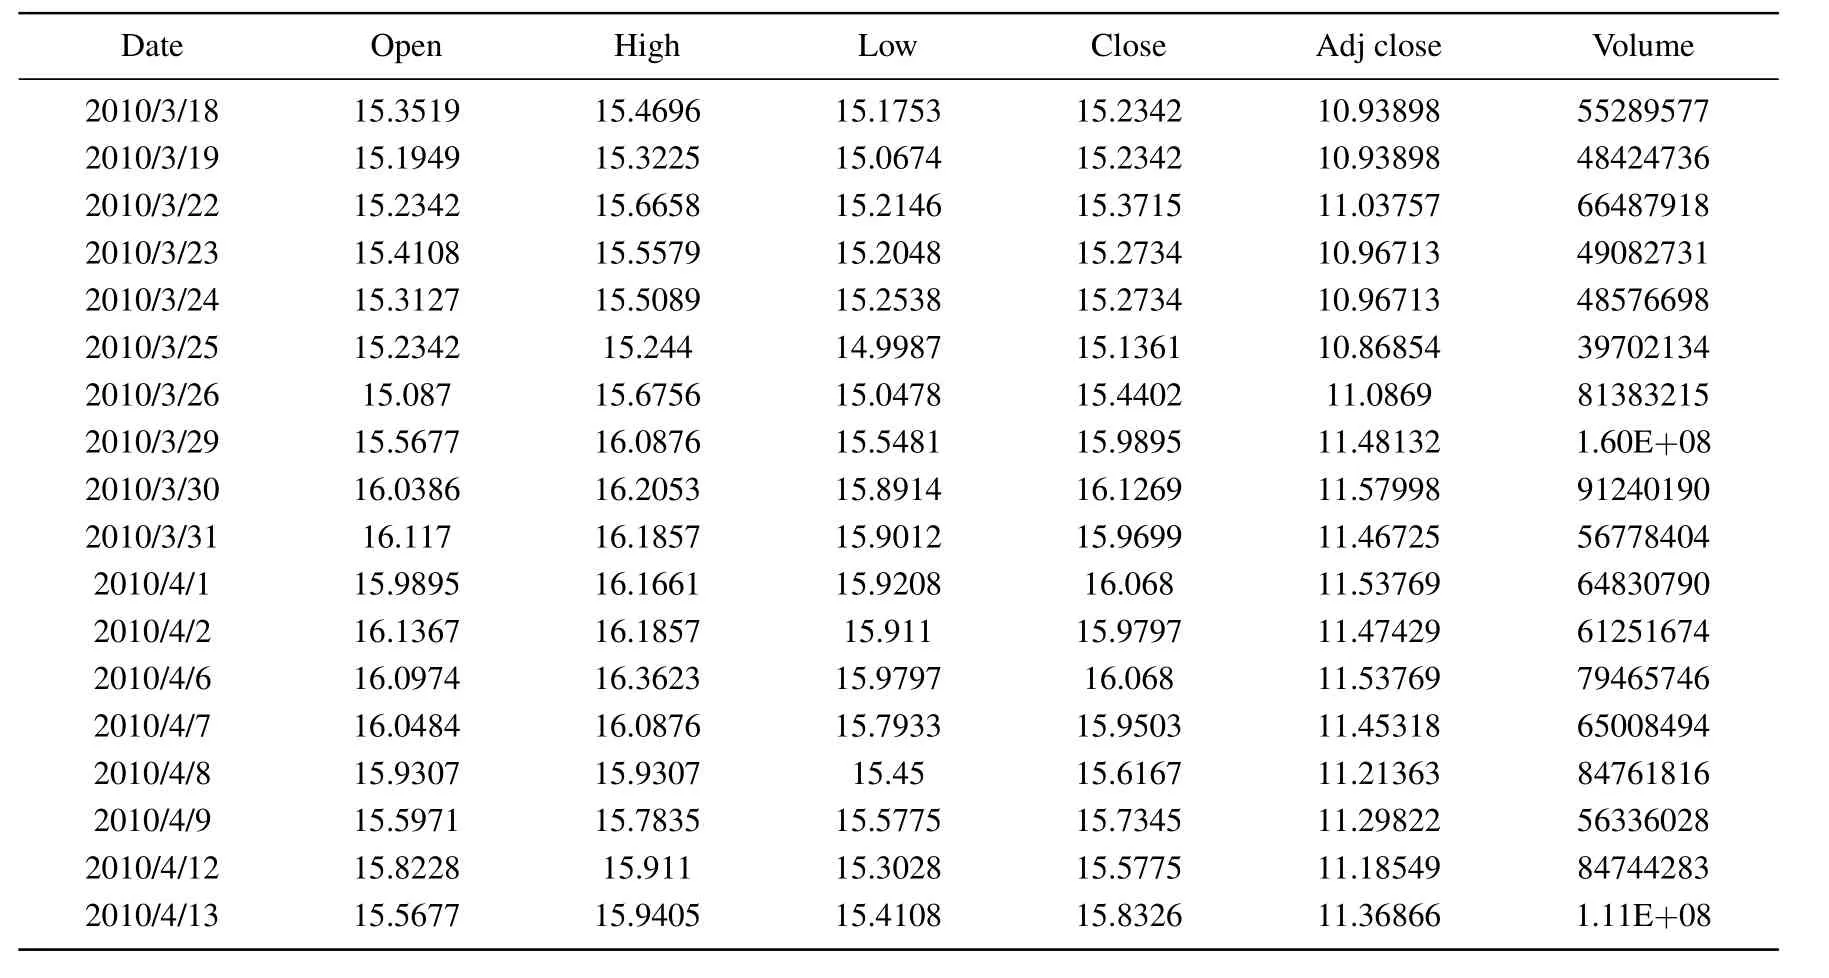
Table 3.Original empirical data of China Merchants Bank(namely,‘600036.SS’).
Additionally,it is quite necessary to address the reason why 30 Asian stocks and 30 American stocks are focused on.In order to study the universal law of the interaction among different markets,the correlation among the stock prices in the emerging market and relatively developed market is chosen.The former corresponds to 30 individual stocks in Asia.While,the latter one is related to 30 individual stocks in America. The focused 30 stocks in Asia are extracted from the top 100 companies in China’s Fortune List,which are in the top thirty.These 30 companies have much stronger economic strength,enterprise scale and international competitive strength,which can reflect the economic market situation in Asia to a certain extent and can also be regarded as the indicator of the future trend of Asian market to some extent.While,the focused thirty American stocks are extracted from the Dow Jones Industrial Average,which are also representative stock samples.In fact,the selected samples can be more objective to reflect the overview of the entire American stock market and can also be treated as a measure of investment evaluation.
Moreover,for the convenience of establishing adjacency matrix,modelling complex network and analyzing established network,only 30 Asian stocks and 30 American stocks are selected in this research.It should be noted that the extraction of empirical data depends on the selected sampling points and the sample space.In the appropriate sample space,it is more helpful to select representative sample points for obtaining the universal statistical law. Thus,if more stocks are selected,the modelling of complex network,the analyses of established network and the construction of adjacency matrix can also be performed as long as the chosen stocks are representative.
Furthermore,it should also be emphasized that if other data are selected,the results will not change.When the subprime mortgage crisis occurs,the component of the feature vector related to the second largest eigenvalue of the crosscorrelation matrix of Asian stocks does not change.While,after the crisis occurs,the component value of the small feature vector of the stock asset will greatly fluctuate.Afterwards,for the American financial market,the component value fluctuations of the eigenvectors will always become smaller no matter they occur during or after the crisis.That is to say,the correlation among American stocks is more fragile than that among Chinese stocks. Thus,the criterion of selecting samples in this work must meet the requirement that the characteristics of stocks with large assets and large correlations among stocks should be reflected out.
3.Results and discussion
In the last section,we present the relationship between the closing price of stocks and the price return,normalize the price return,and deduce the analytical expressions of eigenvectors and the relation between cross-correlation matrixes. Additionally,based on the theoretical analyses and empirical data(namely,30 Asian stocks and 30 American stocks)presented in the last section,the intensity of correlation coefficient,moduli of components of eigenvectors,the relationship between the total asset of stocks and the third-largest eigenvector,the evolution of the average correlation coefficient,the analysis of threshold networks and the analysis of PMFG graphs are displayed from Figs.1–7 respectively.
To be specific,the closing price of the concerned 30 Asian stocks in the time intervals ranging from June 2005 to January 2010 is employed to analyze the correlation coefficient matrix among stocks to quantitatively depict different states of the stock market. Furthermore,the mechanisms of the dynamic evolution of the correlations among stocks in various periods of financial system(namely,the regular periods,the pre-subprime crisis,the peak and the latter stage of subprime crisis)are found.Corresponding results are presented in Figs.1(a)–1(d). Besides,the aim of calculating Figs.1(a)–1(d)is to provide effective strategies to predict the occurrence of subprime crisis,which could establish the theoretical basis for exploring the changing laws of the stock market.In fact,figures 1(a)–1(d)respectively show the correlation among stocks in the period of the regular time,the pre-subprime crisis,the peak and the latter stage of subprime crisis.The horizontal and vertical axis of Figs.1(a)–1(d)correspond to the number of these 30 stocks ranging from 1 to 30. Moreover,these numbers are arranged according to the total assets of these companies.Specifically,number‘1’reflects the company whose total asset is the highest in these 30 stocks,and number‘30’means the company whose total asset is the lowest. Besides,figures 1(a)–1(d)are obtained from the cross-correlation matrix whose dimension is 30.In other words,these 900 elements reflect the intensities of the correlation between any two stocks.Moreover,the color bar shows the gradient of the change of correlation coefficient,and the deeper color means that the value of correlation coefficient is smaller.Furthermore,the average correlation coefficients of the four stages are shown to be 0.2808,0.3685,0.6278,and 0.5087 in Figs.1(a)–1(d),respectively. Meanwhile,the standard deviations of correlation coefficients are 0.1664,0.1667,0.1384,of correlation coefficients can lead to some conclusions. Firstly,in general,when the elements are closer to the diagonal elements,the color is brighter and the correlation between stocks becomes higher.Secondly,diagonal elements have the brightest color,which means that their correlation is higher than other stocks’.Thirdly,as time goes on,the correlation coefficient among stocks gradually increases.At the peak of the subprime crisis,the mean value of correlation coefficient becomes highest.Then,it gradually decreases as the state of financial market transits to the latter stage of subprime crisis.Fourthly,the standard deviation of the correlation coefficient among stocks gradually increases as the state of financial market transits from the regular time to the pre-subprime crisis.Then,the standard deviation of the correlation coefficient becomes highest,as the state of financial market reaches the pre-subprime crisis. Therefore,the robustness of stock market is weakened.The standard deviation of the correlation coefficient among stocks gradually decreases,as the state of financial market transits to the stage of the peak of subprime crisis and the latter stage of subprime crisis.Thus,corresponding robustness of stock market becomes stronger due to the decrease of the correlation coefficient of the stock market.The variations of correlation coefficient among stocks caused by subprime crisis and the robustness of Asian financial market can be revealed by Figs.1(a)–1(d)to some extent.
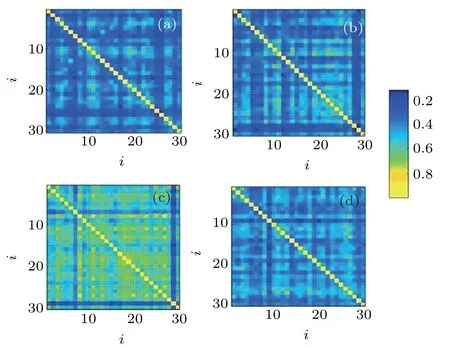
Fig.1.Correlation coefficients of focused 30 stocks in Asia.(a)Correlation coefficient in regular time(from June 2005 to July 2006).(b)Correlation coefficient in pre-subprime crisis(from August 2006 to September 2007).(c)Correlation coefficient in peak of subprime crisis(from October 2007 to November 2008).(d)Correlation coefficient in latter stage of subprime crisis(from December 2008 to January 2010).Stocks are arranged in order of total assets from major assets to minor ones. Here,symbol i refers to stock number ranging from 1 to 30,which also corresponds to the detailed information about stocks shown in Table 1. Color bar shows gradient of change of correlation coefficient.The deeper the color,the minor the value of correlation coefficient is.
Besides,in order to explore the interactions among stocks in financial market,moduli of the componentsµi(λj)of four leading eigenvalues are investigated in Figs.2(a)–2(d).In fact,the data used in Figs.2(a)–2(d)are also extracted from the cross-correlation matrix whose dimension is 30. Moreover,these data are divided into different stock boards plotted out by industries,which are represented by nine different colors.Here,a threshold uc=0.4 is introduced to extract the main components of eigenvectors which can dominate the dynamic evolution of stock prices.[63]In other words,compared with other eigenvector like,the components that satisfy dynamic states play a dominant role.Therefore,according to Fig.2(a),it can be found that the dominant components of the eigenvalue λ1of correlation matrix of Asian stocks during pre-subprime crisis belong to the industry of information technology.Moreover,during pre-subprime crisis,the dominant components of eigenvalue λ2of correlation matrix of Asian stocks belong to the industries of information technology and non-daily consumer goods. Then,during pre-subprime crisis,the dominant components of eigenvalue λ3of correlation matrix of Asian stocks belong to the industry of finance.Similarly,during pre-subprime crisis the dominant components of eigenvalue λ4of correlation matrix of Asian stocks belong to the industry of finance.According to Fig.2(b),it can be found that during pre-subprime crisis,the dominant components of eigenvalue λ1extracted from correlation matrix of American stocks belong to the industries of energy resources and basic materials.By comparison,according to Fig.2(b),the leading eigenvector λ1makes energy and basic material play a dominant role.The main components of eigenvalues such as λ2,λ3,and λ4mean that the financial stock is dominated.During the peak of Asian subprime crisis,λ1and λ2of Fig.2(c)indicate that the information technology and non-daily consumer goods are dominated.The third eigenvector λ3means that the financial stock is dominated.The fourth eigenvector λ4means financial and public utilities are dominated.During the peak of American subprime crisis,the biggest eigenvalue λ1indicates that the energy resources and basic materials are dominated as shown in Fig.2(d).The second biggest eigenvalue λ2indicates that the industry of finance and Medicare are dominated.The eigenvalue λ3indicates the industries of information technology and finance are dominated.Then,the eigenvalue λ4indicates the industry of information technology and daily consumer goods are dominant.To summarize,the largest proportions of components’weight are the first ten stocks.In other words,the first ten stocks with more total asset values are significantly interacting,and are more correlated and able to resist the risks.
Then,moduli of components of last four eigenvalues of cross-correlation matrix are also discussed in Figs.3(a)–3(d).Like Figs.2(a)–2(d),the dominant components are also revealed. According to Fig.3(a),it can be found that during pre-subprime crisis,the dominant components of eigenvector of λ1extracted from correlation matrix of Asian stocks belong to the industries of information technology and non-daily consumer goods.Moreover,during pre-subprime crisis,the dominant components of eigenvector of λ2belong to the industry of non-daily consumer goods.Then,during pre-subprime crisis,the dominant components of eigenvector of λ3belong to the industry of information technology.During pre-subprime crisis,the dominant components of eigenvector of λ4belong to the industry of basic materials.According to Fig.3(b),it can be found that during pre-subprime crisis,the dominant components of eigenvector of λ1extracted from correlation matrix of American stocks belong to the industry of information technology.According to Fig.3(b),it can be found that during pre-subprime crisis,the main components of eigenvectors of λ2and λ3belong to the industry of basic materials.Moreover,according to Fig.3(b),it can be found no dominant components of eigenvectors of λ4during pre-subprime crisis.Then,from Fig.3(c),it can be found that in the peak of subprime crisis,the dominant components of eigenvector of λ1extracted from correlation matrix of Asian stocks belong to the industries of finance and non-daily consumer goods.For Fig.3(c),it can be found that in the peak of subprime crisis,the dominant components of eigenvector of λ2belong to the industries of information technology and non-daily consumer goods.While from Fig.3(c),it follows that in the peak of subprime crisis,the dominant components of eigenvector of λ3belong to the industry of information technology. No main component of eigenvector of λ4is found.Finally from Fig.3(d),it can be found that in the peak of subprime crisis,the main components of eigenvectors of λ1,λ2,and λ3extracted from the cross-correlation matrix of American stocks belong to the industries of basic materials,information technology,and finance,respectively.Figure 3(d)shows no main component of eigenvector of λ4exists either.To summarize,the dominant components of Asian stocks are not entirely the components of those stocks whose total assets are dominant during the period of the pre-subprime crisis and the peak of subprime crisis.
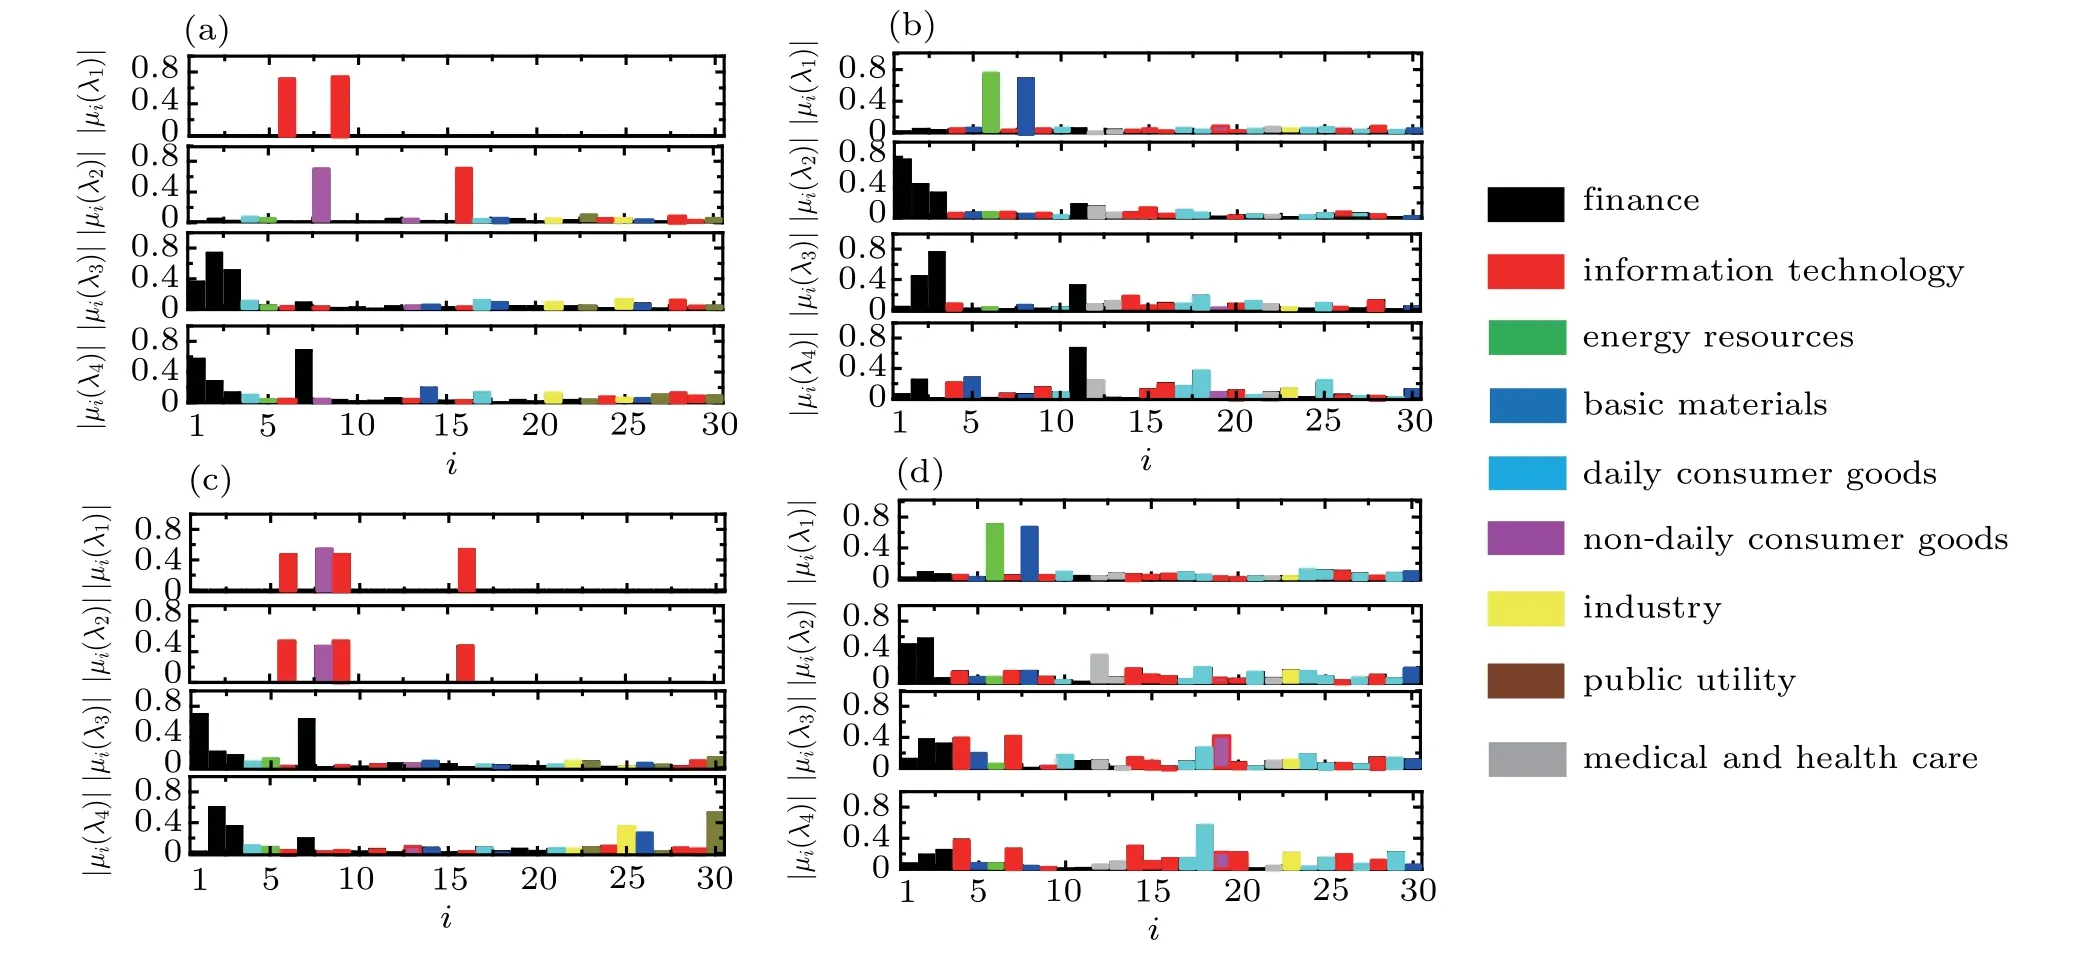
Fig.2.Moduli of componentsµi(λj)(j=1,2,3,4)of four leading eigenvalues for(a)focused Asian stocks during pre-subprime crisis between August 2006 and September 2007,(b)focused American stocks during pre-subprime crisis,(c)focused Asian stocks in the peak of subprime crisis between October 2007 and November 2008,(d)focused American stocks in the peak of subprime crisis,which are arranged in order of total assets from major assets to minor ones.Here,symbol i refers to stock number ranging from 1 to 30,which also corresponds to detailed information about stocks shown in Tables 1 and 2.Nine different colors correspond to various industrial sectors.
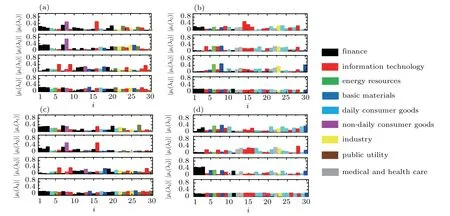
Fig.3.Moduli of componentsµi(λj)of the last four eigenvalues for(a)focused Asian stocks during pre-subprime crisis(from August 2006 to September 2007),(b)focused American stocks during pre-subprime crisis,(c)focused Asian stocks in the peak of subprime crisis(from October 2007 to November 2008),and(d)focused American stocks in the peak of subprime crisis.Stocks are arranged in order of total assets from major assets to minor ones,from 1 to 30,corresponding to the stock information in Tables 1 and 2.Symbol i refers to the stock number ranging from 1 to 30.Nine different colors correspond to various industrial sectors.
Moreover,in order to compare the various interactions among stocks during different periods,both the period of the pre-subprime crisis and the peak of subprime crisis are emphasized in Fig.4.It can be found that the interaction among stocks at the peak of subprime crisis is much stronger than that in the period of the pre-subprime crisis.This is due to the fact that the robustness of financial system is much stronger when the stock market is at the peak of subprime crisis. Besides,the modulusof the component of stocks corresponding to the third-biggest eigenvalue λ3of the cross-correlation matrix can reflect the dynamical behaviors of blue chip stocks that usually have the good performance and can indicate the global dynamics of the whole stock market.From Fig.4(a),it can be found that with the decrease of the total assets of companies,the modulusof the component of stocks corresponding to the third-biggest eigenvalue λ3of the crosscorrelation matrix first increases then decreases.That is to say,correlation among stocks first increases then decreases.Moreover,correlation among stocks with minor total assets is much weaker than others,which can also be revealed by the changing trend ofin Fig.4(a).The interaction among stocks at the peak of subprime crisis is also discussed as shown in Fig.4(b).With the decrease of the total assets of companies,the modulusof the component of stocks corresponding to the third-biggest eigenvalue λ3of the cross-correlation matrix first decreases then increases and then decreases again,which is different from the scenario in Fig.4(a).Figure 4(b)shows that the variation ofranges from 0 to 0.68059,while Fig.4(a)indicates that the variation ofranges from 0 to 0.73123.To summarize,from Figs.4(a)and 4(b)it follows that the correlations among stocks with top ten total assets are much stronger than others.In general,with the decrease of total assets,correlations among stocks gradually decrease. However,the robustness of those stocks with minor assets becomes weakened as compared with that of major assets.
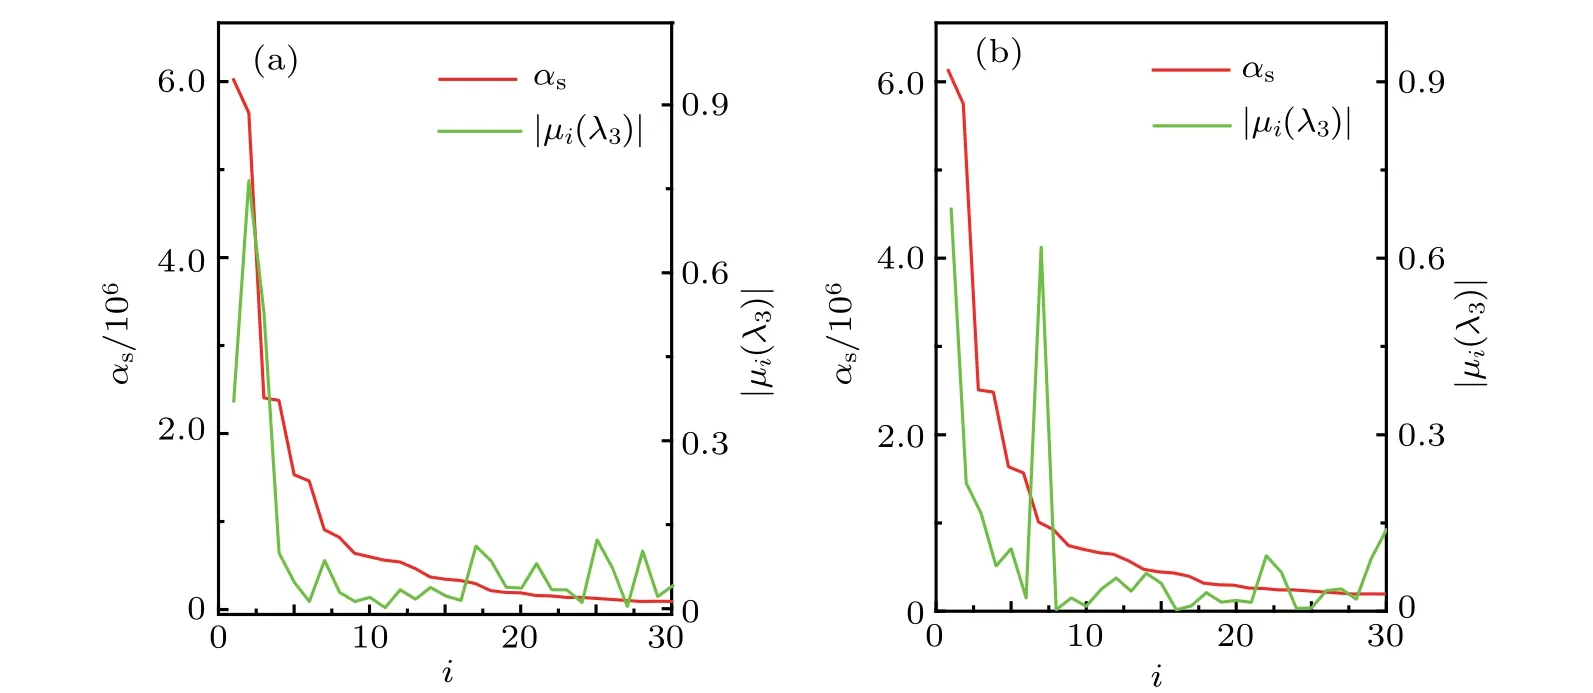
Fig.4.Total asset αs of the focused 30 Asian stocks(red curve)and the third-largest eigenvectorof cross-correlation matrix(green curve)for(a)focused Asian stocks during the period of the pre-subprime crisis(from August 2006 to September 2007),(b)focused Asian stocks at the peak of subprime crisis(from October 2007 to November 2008).Symbol i refers to stock number ranging from 1 to 30,which also corresponds to detailed information about stocks shown in Table 1.
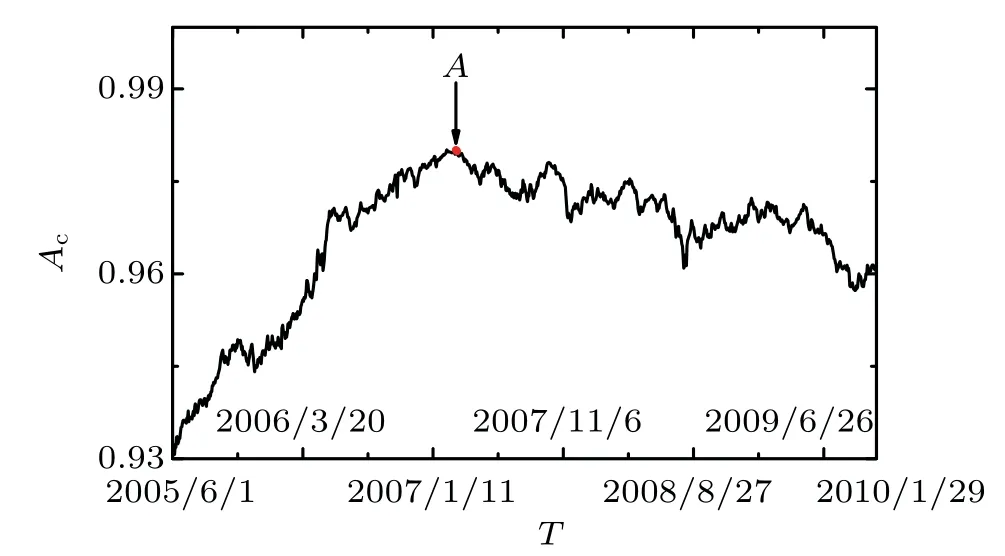
Fig.5.Evolution of average cross-correlation Ac with time T,with considering different stages ranging from regular time(June 2005–July 2006)to latter stage of subprime crisis(December 2008–January 2010).Symbol A shown by the red point corresponds to the peak of subprime crisis.Time point of A corresponds to March 27,2007.
In order to in depth study the correlation among stocks at different time points,the average value of the correlation coefficients among stocks is calculated in Fig.5,and the average of correlation matrix elements is discussed.The peak of the subprime mortgage crisis(namely,June 2007)is marked by the symbol‘A’.At that time point,the correlation coefficient is 0.9801,which is shown as a peak of the evolution curve of the average value of the correlation coefficients among stocks.Meanwhile,other peaks of the curve depicting the strong positive correlation feature of the stock market state,shown in Fig.5,are caused by other factors rather than the occurrence of subprime mortgage crisis.Moreover,the threshold network of the focused 30 Asian stocks is taken into the analyses as shown in Fig.6. Here,panels in Fig.6 correspond to networks constituted by thirty nodes and ten nodes.Besides,each node corresponds to each stock shown in Table 1.These ten nodes are related to the companies whose total assets belong to top ten.The edge between arbitrary two nodes represents the correlation between stocks.From Figs.6(a1)–6(d1)it follows that during the period of the pre-subprime crisis the number of edges decreases with the increase of threshold.When the threshold is set to be an arbitrary value larger than 0.5,the number of nodes will suddenly drop,which means that the correlation among stocks decreases.Figures 6(a2)–6(d2)show that at the peak of subprime crisis the number of edges decreases with the increase of threshold.However,the speed of attenuation is much smaller than that of Figs.6(a1)–6(d1).Moreover,edges among core nodes that are marked by symbols‘1’,‘2’,...,‘10’are much larger than others,which indicates much stronger correlations.Additionally,according to Figs.6(a3)–6(d3)and Figs.6(a4)–6(d4),it can be seen that for the network constituted by these emphasized ten nodes,the edge number also decreases with the increase of threshold.While,the node number remains unchanged.Finally,by comparing the two situations(namely,the period of the presubprime crisis and the peak of subprime crisis),it can be summarized that correlation among stocks becomes much stronger at the peak of subprime crisis.

Fig.6.Threshold networks extracted from 30 Asian stocks for threshold of(a)0.2.(b)0.3,(c)0.4,and(d)0.5. Panels(a1),(b1),(c1),and(d1)correspond to the period of the pre-subprime crisis(from August 2006 to September 2007),and panels(a1),(b1),(c1),and(d1)correspond to the peak of subprime crisis(from October 2007 to November 2008).Panels(a3)and(a4)are extracted from panels(a1)and(a2),respectively.Similarly,panels(b3)and(b4)are extracted from panels(b1)and(b2),respectively.Panels(c3)and(c4)are extracted from panels(c1)and(c2),respectively.Panels(d3)and(d4)are extracted from panels(d1)and(d2),respectively.Red nodes correspond to focused 10 Asian stocks extracted from emphasized 30 stocks according to the order of the rank of the total asset of stocks.Symbols 1–10 correspond to top 10 stocks whose total assets are much higher than others’.Different colors of nodes correspond to different magnitudes of correlation among stocks.Rank of correlation among stocks is arranged as red,grey,green,white,and violet.
The PMFG graphs and corresponding properties of these networks are also discussed in Fig.7.Subgraphs of Figs.7(a),7(c),and 7(e)are obtained from data extracted from presubprime crisis.Figures 7(b),7(d),and 7(f)are obtained from data extracted from the peak of subprime crisis.A comparison between Figs.7(a)and 7(b)shows that the core nodes emerge.Besides,the degrees of these core nodes are much higher than others’.That is to say,divergent topological structures appear in both periods.However,the number of core nodes is quite different.Specifically,in the period of pre-subprime crisis,the constructed network contains three core nodes(namely,the tenth node,the twelfth one and the fifteenth one). While in the period of subprime crisis peak,the number becomes two(namely,the tenth node and the fifteenth one).Additionally,the probability distributions of degree of networks are displayed in Figs.7(c)–7(d).Four peaks are found in the network,which are extracted from the period of the pre-subprime crisis.Only three peaks are revealed in the network,which are extracted from the peak of subprime crisis.Then,the clustering coefficient of degree distribution is investigated in Figs.7(e)and 7(f). The detailed properties of the networks,obtained by the method of employing PMFG,are presented in Table 4.Thus the average clustering coefficient,average degreemaximum degreeand minimum degreeare obtained. Based on Figs.7(e)and 7(f)and Table 4,it can be found that the average clustering coefficient becomes much larger than that in the case of peak of subprime crisis with the pre-subprime crisis.To be specific,the aggregation degree becomes greater in the case of the peak of subprime crisis,which indicates that much stronger correlations among stocks appear.
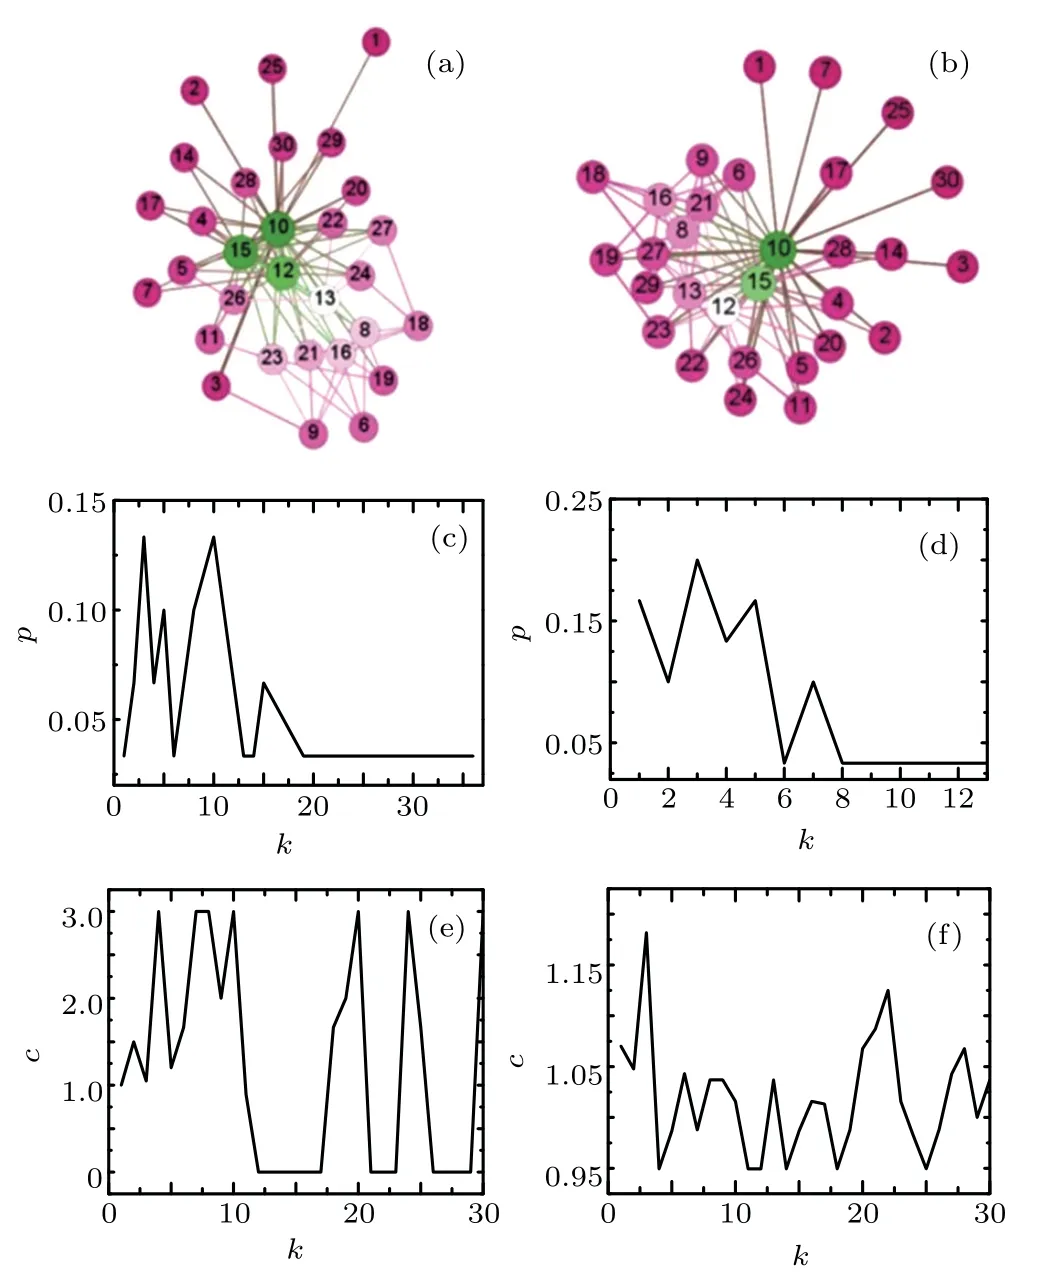
Fig.7.PMFG graphs and corresponding properties of these networks based on empirical data of 30 Asian stocks.(a)PMFG graph of these mentioned 30 Asian stocks during pre-subprime crisis(from August 2006 to September 2007),(b)PMFG graph of these mentioned 30 Asian stocks at the peak of subprime crisis(from October 2007 to November 2008),(c)degree distribution of network(a),(d)degree distribution of network(b),(e)clustering coefficient of network(a),and(f)clustering coefficient of network(b).Parameters k,p,and c denote degree,cumulative probability,and clustering coefficient,respectively. Green nodes mean core nodes of PMFG graphs.Rank of correlation among stocks is arranged as green,white,and violet.
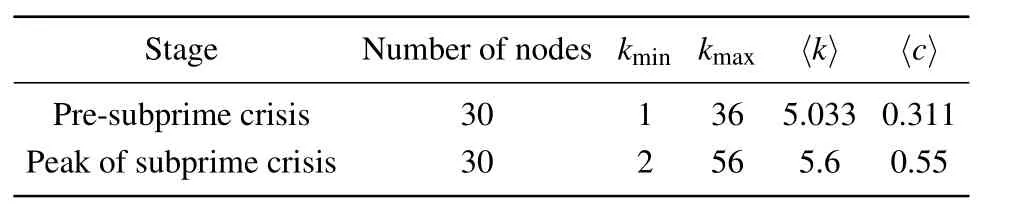
Table 4.Properties of networks shown in Figs.7(a)and 7(b)(namely,PMFG graphs).
In this research,the sorting operation of stock total assets is performed in the process of analyzing total assets.Specifically,by searching the website of Fortune China,the stock total asset of each focused stock can be found to be sorted in the descending order. Here,in this work,the unit of stock asset is set to be millions of dollars.Besides,in the process of constructing and calculating the correlation matrix Cij,the total asset weight is considered to some extent.Specifically,subscript i denotes the row number of correlation matrix Cij.Different row numbers correspond to different closing times.For a specific row in correlation matrix Cij,different columns correspond to different stocks,whose total assets are sorted in the descending order.In fact,each element in correlation matrix Cijreflects the correlation between the i-th stock and the j-th stock of the focused 30 Asian stocks and 30 American stocks.For instance,the element C56denotes the correlation between the fifth stock and the sixth stock of the focused 30 Asian stocks and 30 American stocks.Furthermore,in the process of constructing and calculating the correlation matrix Cij,the asset size of enterprises can reflect the total asset weight to some extent.Besides considering the asset size of enterprises,more comprehensive total asset weights will be further studied in our later work,including the influences of asset quality,profitability,liquidity and capital ratio.
In the fields of complex networks,statistical physics and economic physics,the essence of market model[56]is the common reflection of the whole market to the external information.In fact,both Asian stock market and American stock market have the property of market model.The maximum eigenvalue of the correlation matrix can well reflect the basic characteristics of the market model,since the physical meaning of the maximum eigenvalue of the correlation matrix represents the common interaction among all stocks in the market.The properties of four leading eigenvalues of the correlation matrix are revealed in Fig.2,where the properties of the maximum eigenvalue of the correlation matrix are reflected fromin Figs.2(a)–2(d).Furthermore,extracted from Figs.2(a)–2(d),the eigenvectors corresponding to the second largest eigenvalueof the correlation matrix exhibits the characteristics of localization.That is to say,among these eigenvectors,only part of components of these eigenvectors can be dominated in the interactions among stocks.Moreover,these dominant components can belong to the similar or related industry sectors,which leads to the result that they can also reflect the properties of stock markets to a certain extent,namely the dynamic effect of the industry sector of stock markets.
4.Conclusions
In this paper,the influences of financial crisis on stock correlations are investigated.The influence of total assets on stock data is considered in our work,especially the correlation matrix is constructed,which is different from previous researches.Empirical data of 30 Asian stocks and 30 American stocks are employed in the analyses.Detailed theoretical analyses of the derivations of analytical expressions of crosscorrelation matrix and characteristic order parameters of constructed networks are performed. Then,correlations among stocks are extensively analyzed.Also calculated are the correlation coefficients of the focused 30 stocks in Asia,the moduli of components of eigenvectors of first four and last four eigenvalues of matrix,the total asset of the focused 30 Asian stocks versus the third-largest eigenvector,the average crosscorrelation versus time,threshold networks,PMFG graphs and corresponding network properties.
Some key results are summarized as follows.Firstly,the correlation among stocks is used as a correlation matrix to establish a threshold network.The 30 nodes and 10 nodes are considered,respectively.The former considers the focused 30 stocks,while the latter emphasizes 10 stocks with the top ten total assets.When the threshold exceeds 0.5,the number of nodes far away from the core of the network suddenly becomes sparse and truncated. Simulation results show that the optimization threshold can be set to be an arbitrary number ranging from 0.2 to 0.4,which entirely displays the global threshold financial network. Secondly,using the maximum filtering method of the plane to determine the consolidation of networks,the threshold networks based on these empirical data of stocks are also constructed. The core nodes are found in the period of the pre-subprime crisis and the peak of subprime crisis,while the numbers of their core nodes are quite different.Three core nodes and two ones are observed in these two cases,respectively.Thirdly,by calculating PMFG graphs and specific properties of corresponding networks,much stronger correlations among stocks are found at the peak of subprime crisis.Fourthly,since the total asset of the enterprise is considered in the construction of cross-correlation matrix,the matrix can more scientifically depict the correlations among stocks.This is due to the fact that the fluctuations of market can be analyzed more accurately.Moreover,eigenvectors are also analyzed.The larger the total asset of the enterprise,the greater the weight of the eigenvectors becomes.Similarly,the smaller the total asset of the enterprise,the smaller the component of the eigenvector becomes. Our work will be helpful for better understanding the physical mechanisms of the influence of subprime crisis and the total asset on the correlation among stocks.The risk of market fluctuations will be considered in our future work.In this work,for the convenience of calculation,we focus on the 30 Asian stocks and 30 American stocks.A larger sample size of stocks will be considered in the future work in order to obtain more statistical law under feasible conditions,especially the evolution of the characteristic parameters of the constructed system.
杂志排行

Chinese Physics B的其它文章
- Compact finite difference schemes for the backward fractional Feynman–Kac equation with fractional substantial derivative*
- Exact solutions of a(2+1)-dimensional extended shallow water wave equation∗
- Lump-type solutions of a generalized Kadomtsev–Petviashvili equation in(3+1)-dimensions∗
- Time evolution of angular momentum coherent state derived by virtue of entangled state representation and a new binomial theorem∗
- Boundary states for entanglement robustness under dephasing and bit flip channels*
- Manipulating transition of a two-component Bose–Einstein condensate with a weak δ-shaped laser∗