Association between ventricular repolarization variables and cardiac diastolic function: A cross-sectional study of a healthy Chinese population
2019-08-14ZhiDanLiXiaoJuanBaiLuLuHanWenHanXueFengSunXiangMeiChen
Zhi-Dan Li, Xiao-Juan Bai, Lu-Lu Han, Wen Han, Xue-Feng Sun, Xiang-Mei Chen
Abstract
Key words: QT interval; Tpeak-to-Tend interval; Diastolic dysfunction; Ventricular repolarization; Electrocardiography
INTRODUCTION
Heart failure (HF) is a complex and increasingly common syndrome that affects over 23 million patients worldwide[1]. Approximately half of patients with HF present with diastolic dysfunction, and asymptomatic diastolic dysfunction is present in 21% of the population[2]. Asymptomatic diastolic dysfunction may be present for a significant period of time before developing into symptomatic HF. The latency between dysfunction and symptoms represents the best time for using effective diagnostics and therapies[3]. Therefore, the mechanisms underlying diastolic dysfunction need to be more extensively studied.
Growing evidence demonstrates that the pathologies of diastolic dysfunction and systolic dysfunction are different. Some studies have reported that electrical repolarization abnormalities are associated with declining diastolic function,suggesting that diastolic electromechanical coupling represents a unifier linking diastolic dysfunction, calcium handling, and repolarization abnormalities with the development of symptomatic HF[4]. The QT interval is the most commonly used parameter in the electrocardiographic (ECG) assessment of repolarization by physicians in clinical practice. The Tpeak-to-Tend (Tpe) interval, defined as the time interval between the peak and the end of the T wave, is proposed as a readily available ECG measurement of the dispersion of ventricular repolarization. The Tpe/QT ratio is used to predict cardiac arrhythmias. Previous studies have evaluated the QT and Tpe intervals as potential mechanistic contributors to diastolic dysfunction in specific populations[5-8]. Wilcoxet al[5]found QTc prolongation was independently associated with diastolic dysfunction in patients with clinical suspicion of HF. Another study by Khanet al[6]confirmed that a prolonged QTc interval was a useful tool for predicting diastolic dysfunction. In addition, Saueret al[7]showed that increased Tpe interval was associated with both resting and exercise-induced diastolic dysfunction. However, the subjects of the studies above were all patients with risk factors of HF, and risk factors such as hypertension and diabetes mellitus may influence both heart structure and heart function and are powerful potential confounders of electromechanical coupling. Thus, the aim of this study was to assess the relationship between ventricular repolarization variables, such as the QT interval,Tpe interval and Tpe/QT ratio, and diastolic function in an apparently healthy Chinese population and determine whether measuring repolarization variables may provide information valuable for predicting cardiac diastolic function in healthy people.
MATERIALS AND METHODS
Study population
The subjects who participated in this community-based cross-sectional study were recruited from a healthy Han Chinese population between 2007 and 2008. There were the following register criteria: (1) Age older than 35 years; (2) Being healthy by selfevaluation; (3) Having the ability to care for themselves and perform activities associated with daily living independently and without difficulty; (4) Having the ability to provide informed consent and self-reported data. Subjects with cardiovascular disease, hypertension [defined as a systolic blood pressure (SBP) ≥ 140 mmHg or a diastolic blood pressure (DBP) ≥ 90 mmHg and/or an antihypertensive medication requirement], diabetes (defined as a fasting plasma glucose > 7.0 mmol/L or an insulin or oral hypoglycemic medication requirement), and other chronic diseases were excluded from the study. The subjects who provided the informed consent conducted physical examination or laboratory tests. After excluding persons with an abnormal physical examination or laboratory results, 414 healthy subjects (186 men and 228 women) were included in the study. This study was approved by the Ethics Committee of China Medical University.
Clinical measurements and laboratory tests
The participants underwent a clinical examination and completed a detailed questionnaire at the time of enrollment. Before they were examined, the subjects rested for 10-15 min in a temperature-controlled environment. Physical parameters,including height and weight, were measured with a digital scale while the participants were wearing light clothing and no shoes on a digital scale. Blood pressure was measured using a manual stethoscope and a sphygmomanometer with an adjustable cuff. Two measurements were performed 2 min apart, and the average of the two measurements was calculated. Body mass index (BMI) was calculated as the mass in kilograms divided by height in meters squared, and body surface area(BSA) was calculated according to the following formula: BSA (m2) = 0.0061 × height(cm) + 0.0128 × weight (kg) - 0.1529.
Blood samples were collected from the subjects between 8:00 and 9:00 am after the subjects had fasted for at least 10 h overnight. Blood biochemical parameters,including triglycerides (TG), total cholesterol (TC), high-density lipoprotein cholesterol (HDL-C-C), low-density lipoprotein (LDL-C), fasting blood glucose (FBG)and serum creatinine (SCr) levels, were assayed on-site at the medical laboratory of the study center.
ECG
All subjects underwent a 12-lead ECG recorded at a paper speed of 25 mm/sec and a voltage of 10 mm/mV by a standard ECG system. For ECG analysis, we performed manual measurements of the values with a digital caliper using a computer program.The QT interval was measured between the QRS onset and the end of the T wave, and the Tpe interval was measured from the peak of the T wave to the end of the T wave.The QT interval and the Tpe interval were corrected separately for heart rate using the Bazett formula[9]. We also calculated the Tpe/QT and Tpe/QTc ratios. All measurements were performed in lead V5[10]. In cases in which lead V5 could not be used for the analysis, leads V4 and V6 (in that order) were utilized. ECG measurements were performed by a single trained reader who was blinded to the echocardiographic results.
Echocardiography
All subjects underwent a complete M-mode, two-dimensional and pulsed-wave (PW)Doppler echocardiographic examination using a Philips iE33 Ultrasound System, and all echocardiographic measurements were obtained according to published guidelines[11,12]. PW Doppler was performed in the apical 4-chamber view to obtain data pertaining to mitral inflow velocities and time intervals. The primary measurements performed during this procedure included measurements of mitral early diastolic inflow velocity (E), late diastolic inflow velocity (A), the E/A ratio, and E-wave deceleration time (DT). We used the apical four-chamber views to measure left atrial anterior-posterior diameter (LA-AP-D), left atrial medial-lateral diameter(LA-ML-D) and left atrial superior-inferior diameter (LA-SI-D). The left atrial volume(LAV) was computed by the equation 4π/3(LA-SI-D/2)(LA-AP-D/2)(LA-ML-D/2)according to the ellipsoid model, and the left atrial volume index (LAVI) was calculated as the LAV in milliliters divided by the BSA in meters squared. According to the American Society of Echocardiography guidelines[12], in this study, E/A < 0.75 was considered to be reduced diastolic function.
Statistical analysis
The Kolmogorov-Smirnov test was used for all analyses of normally distributed data.All continuous data were normally distributed and were expressed as the means±SDs. The differences in these variables between different groups were examined using the independent-samples t-test. Categorical variables were expressed as the number{(percentile) [n(%)]}, and comparative analyses of different groups were performed using the chi-square (χ2) test. Simple correlation analyses were performed by calculating Pearson’s coefficients for the relationships between two variables.Multiple linear regression analyses were performed to adjust for possible confounding variables. The following three models were used: An un-adjusted model,a model adjusted only for age, and a model adjusted for age, BMI, SBP, DBP, TG, TC,HDL-C, LDL-C, FBG and SCr. Binary logistic regression was reformed to investigate the associations between abnormal diastolic function and the levels of QTc and Tpec.The subjects were categorized into tertiles (1-3) for QTc and Tpec, with tertile 3 showing the highest levels of QTc and Tpec. The following two models were applied:A model adjusting for age and a model adjusting for age, BMI, SBP, DBP, TG, TC,HDL-C, LDL-C, FBG and SCr. All statistical analyses were performed using SPSS 19.0 statistical software (SPSS, Chicago, IL, United States), and aPvalue < 0.05 was considered statistically significant.
RESULTS
Clinical, electrocardiographic and echocardiographic characteristics
A total of 414 subjects (186 men) were assessed in this study, and the mean age was 55±14 years old. Subjects were divided into two groups based on their E/A values (one group with E/A ≥ 0.75 and the other with E/A < 0.75). The differences in the clinical,ECG and echocardiographic characteristics between the groups with normal and reduced E/A ratios are shown in Table 1. Age, BMI, SBP, DBP and SCr were significantly higher in subjects with a reduced E/A ratio (P <0.01). Furthermore,there were several ECG-related differences between the two groups: The RR interval,QTc interval, Tpe interval, Tpecinterval and Tpe/QT ratio were higher in those with E/A < 0.75 than in those with E/A ≥ 0.75 (P <0.01). All echocardiographic parameters were significantly different between the two groups (P <0.05).
Correlation analysis between electrocardiographic repolarization variables and other variables
Table 2 shows the Pearson correlation coefficients for the relationships between ECG repolarization variables and other variables. All the repolarization variables except the Tpe/QTc ratio were significantly associated with age (P <0.05) and all except the QT interval were associated with BMI (P <0.05). Moreover, the QTc interval was significantly associated with SBP, TC and LDL-C (P <0.05). The Tpe interval was significantly associated with HDL-C (P <0.05). The Tpecinterval was significantly associated with HDL-C and LDL-C (P <0.05).The Tpe/QT ratio was significantly associated with HDL-C, LDL-C and SCr (P <0.05). The Tpe/QTc ratio was significantly associated with HDL-C and SCr (P <0.01). With regard to the echocardiographic diastolic parameters, the E/A ratio was negatively and significantly correlated with QTc, Tpe and Tpecintervals and Tpe/QT ratio (P <0.01).E was negatively correlated with the Tpecinterval and the Tpe/QT ratio (P <0.05). A was positively correlated with all the repolarization variables except the Tpe/QTc ratio (P <0.01). DT was positively correlated with the QT interval and the Tpe/QTc ratio (P <0.05). LAV was positively correlated with all the repolarization variables except the Tpe/QT ratio (P <0.05). LAVI was positively correlated with QTc and Tpe intervals (P <0.01).

Table 1 Clinical, electrocardiography and echocardiographic characteristics based on their E/A ratio
Associations between electrocardiographic repolarization variables and echocardiographic diastolic function parameters
Table 3 shows the results of the multiple linear regression analyses, in which echocardiographic diastolic function parameters served as the dependent variables,and ECG repolarization variables served as the independent variables. After adjusting for all other possible confounders, A and E/A ratio were significantly associated with QTc and Tpecintervals and the Tpe/QT ratio, and A was also significantly associated with the Tpe interval. LAV and LAVI showed significant and independent associations with the QTc interval, and LAV was also significantly associated with the QT interval. DT was significantly associated with the QT interval.
Table 4 shows the binary logistic regression analyses performed using reduced diastolic function as the dependent variable and cut-off values of the QTc and Tpecinterval as the independent variables. In men, the odds ratio in subjects with reduced diastolic function was 2.715 (95%CI: 1.356-5.432;P <0.001) for longer QTc interval after adjustment for age, compared to the subjects in normal QTc interval. This association was still significant after adjustment for all other variables, and the odds ratio was 2.567 (95%CI: 1.227-5.370;P =0.012). In women, the QTc interval was not correlated with reduced diastolic function. With regard to the Tpecinterval, in men,compared to the third Tpectertile, in the Tpecsecond tertile, the odds ratio approached statistical significance (0.423; 95%CI: 0.175-1.022;P= 0.056) after adjustment for all other variables.
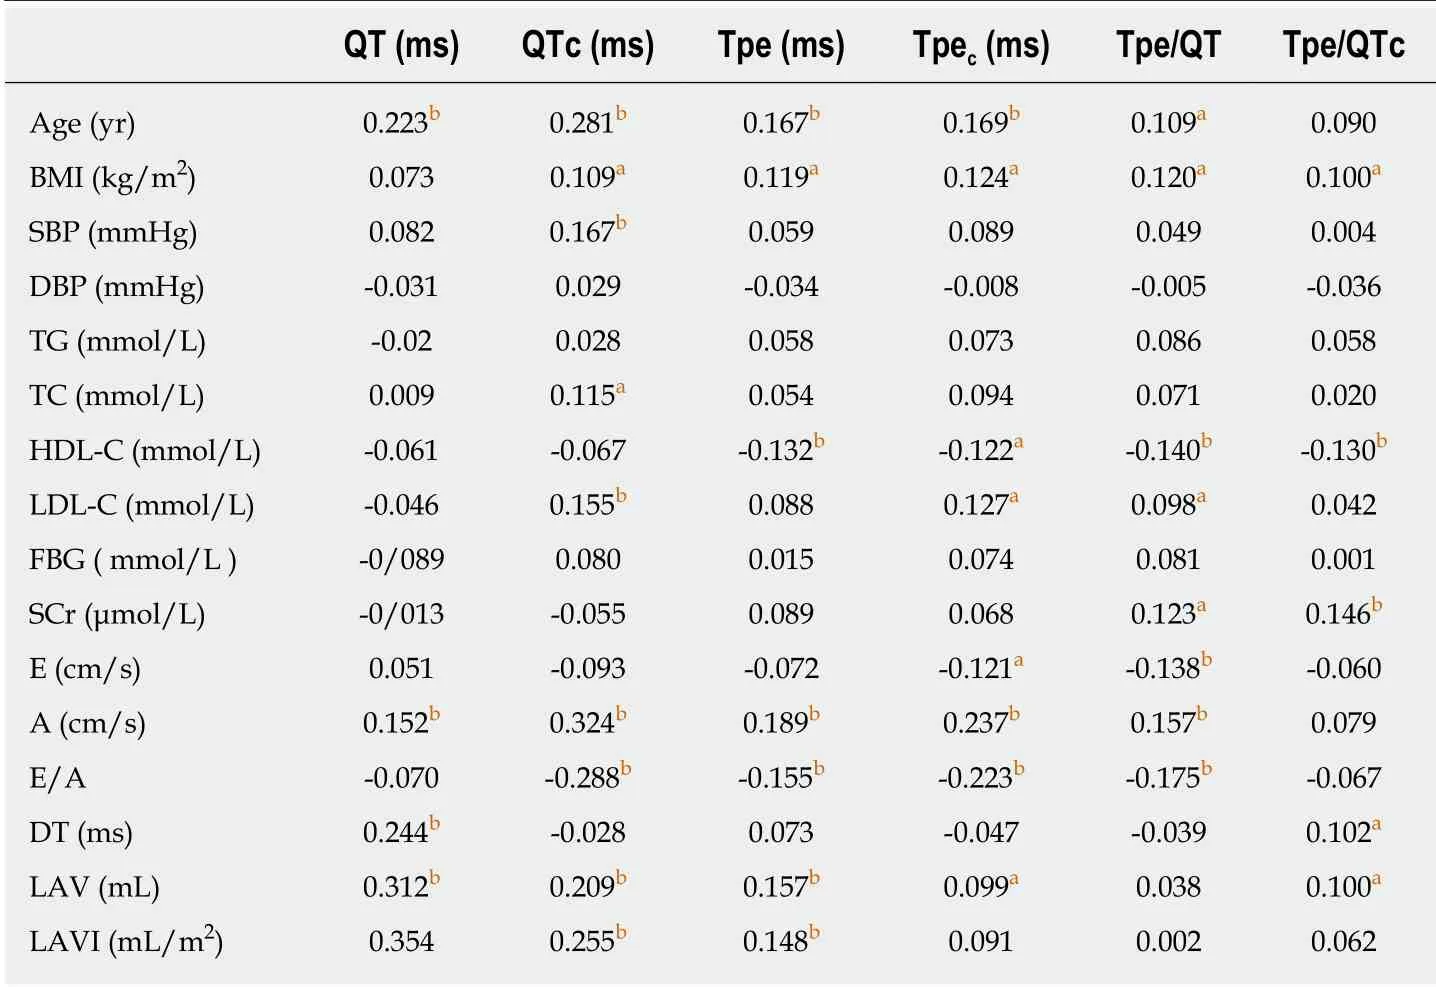
Table 2 Correlation analysis between electrocardiography repolarization variables and other variables
DISCUSSION
The most important findings of the present study are the associations between ventricular repolarization variables and cardiac diastolic function in a population of healthy adults. These relationships remained significant even after correction for other potential confounders.
The ECG QT interval is one of the ventricular repolarization variables most commonly used by physicians in clinical practice. Previous studies have demonstrated the existence of a relationship between a prolonged QT interval and abnormal myocardial mechanical function among patients with inherited long QT syndrome (LQTS), which has historically been considered a purely electrical disease[13-15]. In recent years, clinicians have become increasingly interested in the association between the QT interval and echocardiographic parameters representing diastolic function in patients with suspected HF, hypertension, and diabetes mellitus and have obtained data supporting the idea that there is a correlation between diastolic dysfunction and the QT interval[5,8,16]. However, diseases such as hypertension and diabetes mellitus influence both heart structure and heart function and are powerful potential confounders of electromechanical coupling measurements. The present community-based study included apparently healthy subjects selected from a Chinese population without hypertension, diabetes, cardiovascular disease, or other chronic diseases and thus excluded potential confounders. We found an independent linear association between the QTc interval and echocardiographic diastolic parameters. Moreover, this study also demonstrates that moderate levels of QTc exert a protective effect on diastolic dysfunction in healthy men. To the best of our knowledge, this is the first study to demonstrate an association between QTc interval levels and diastolic function in a healthy population. Possible explanations for this finding include the possibility that the link between electrical repolarization and diastolic mechanics may be commonly mediated by the effects of calcium handing[4].Previous studies have also described a U-shaped association between the QTc interval and risk of death[17,18]. Therefore, it is biologically plausible that there is an optimum for the dispersion of ventricular repolarization and that the risk of diastolic dysfunction is increased at both ends of the spectrum. However, sex-related differences in the association between QTc interval levels and diastolic function remain to be explored.

Table 3 Relationship between electrocardiography repolarization variables and echocardiographic diastolic parameters using a stepwise multiple regression model
Tpe is the interval between the peak of the T wave and the end of the T wave. The Tpe interval is usually viewed as representative of the difference in repolarization times between subendocardial and subepicardial myocardial cells and has been proposed to reflect the transmural cardiac repolarization expressed through surface 12 ECG[4]. Multiple recent studies have demonstrated that Tpe interval plays an important role as a potential ECG biomarker for predicting arrhythmia risk and cardiovascular death[19-21]. Furthermore, some studies have evaluated the Tpe interval as a potential mechanism that contributes to mechanical dysfunction in patients with overt or suspected HF[7,22]. In the present population-based study, we found a significant linear association between ECG Tpe and Tpecintervals and the echocardiographic E/A ratio and A wave. These findings add to the growing literature supporting the notion that electromechanical coupling of dispersion of repolarization is a potential mechanism of diastolic dysfunction. It is interesting to note that the Tpecinterval was more strongly correlated with diastolic function parameters in this study, compared to the Tpe interval. The basis for this result is unclear and is beyond the scope of the current study. In the present study, we found that in men, compared to the third Tpectertile, in the Tpecsecond tertile, the odds ratio approached statistical significance (0.423; 95%CI: 0.175-1.022;P= 0.056) after adjustment for all other variables. Moderate Tpeclevels tend to have a protective effect on diastolic dysfunction in men. A large population study found U-shaped associations between the Tpe interval and the risks of all-cause and cardiovascularmortality, atrial fibrillation, and HF[19]. Therefore, similar to the QTc interval, there may be an optimum for the dispersion of cardiac repolarization, and the risk of cardiovascular outcomes may be increased at both ends of the spectrum. Further investigations are necessary to confirm and improve the present findings.

Table 4 Association of E/A ratio within tertiles of QTc and Tpec using binary logistic regression model
The Tpe/QT ratio is a novel ventricular repolarization variable that is used to predict cardiac arrhythmias[23]. Some studies have suggested the applicability of Tpe/QT ratio as a potentially important index of arrhythmogenesis in congenital and acquired channelopathies[23,24]. Furthermore, some studies have evaluated the Tpe/QT ratio as a potential ECG biomarker for predicting arrhythmia risk and cardiovascular death[25-27]. In the present study, we found an inverse linear association between the Tpe/QT ratio and the E/A ratio. However, the Tpe/QTc ratio was not associated with any echocardiographic diastolic function parameters after adjustment for several important potential confounders. The basis for this finding in unclear, and additional studies are required.
Our results should not be interpreted to suggest that repolarization variables measured on surface ECG can be used to screen for diastolic dysfunction on echocardiography. Furthermore, our current understanding of the role of ventricular repolarization in the development or progression of HF is limited. Rather, our findings provide evidence showing that ventricular repolarization parameters may be used as markers of asymptomatic mild diastolic dysfunction. Epidemiological studies suggest that there is a latent phase during which diastolic dysfunction is present and progresses in severity before the symptoms of HF arise[28]. This asymptomatic phase represents a potential time to intervene and thereby prevent symptomatic HF. The latency between dysfunction and symptoms represents the best time for using effective diagnostics and therapies. Identifying a pharmacological intervention to restore repolarization to a more normal state may be a novel target for therapy.
The present study had several limitations that require discussion. First, this research is part of a cross-sectional study, and it is therefore difficult to demonstrate cause-effect relationships between ventricular repolarization variables and cardiac diastolic function. A longitudinally designed study is required to confirm the current findings. Second, the subjects included in this study were recruited from communities in northern China. Therefore, the findings in the study are not representative of the general population. Third, a relatively low number of subjects were included in the study, and the proportion of women (55.1%) was higher than that of men (44.9%).Fourth, we chose to report the QT and Tpe intervals corrected for heart rate (QTc and Tpec) using the Bazett formula. The Bazett formula undercorrects the QT interval at lower heart rates and overcorrects it at higher heart rates[29]. However, the Bazett formula is the formula that is most often used in research or clinical practice. Fifth,several important parameters, including LV mass and QRS durations, were not measured in this study but may affect ventricular repolarization variables[30]. Further studies are needed to confirm and improve upon the findings of the present study.
In conclusion, this study reveals that even in healthy people, ventricular repolarization variables are linearly associated with cardiac diastolic function parameters. Furthermore, moderate levels of the QTc interval tend to have a protective effect on diastolic dysfunction in men. Electromechanical coupling may represent a relationship between heterogeneity of repolarization and abnormal myocardial mechanics. A longitudinal study should be performed in the future to confirm the findings of the current study.
ARTICLE HIGHLIGHTS
Research background
Asymptomatic diastolic dysfunction present for a significant period of time before developing into symptomatic heart failure (HF), and diastolic electromechanical coupling may represent a unifier linking diastolic dysfunction, calcium handling, and repolarization abnormalities with the development of symptomatic HF. We assessed the relationship between ventricular repolarization variables, such as the QT interval, Tpe interval and Tpe/QT ratio, and diastolic function in an apparently healthy Chinese population through a community-based crosssectional study.
Research motivation
Some studies have reported that electrical repolarization abnormalities are associated with declining diastolic function in patients with suspected HF, hypertension, and diabetes mellitus.However, diseases such as hypertension and diabetes mellitus influence both heart structure and heart function and are powerful potential confounders of electromechanical coupling measurements. Therefore, this study hopes to determine whether measuring repolarization variables may provide information valuable for predicting cardiac diastolic function in healthy people.
Research objectives
The research objective of this study was to explore the relationship between ventricular repolarization variables and cardiac diastolic function in apparently healthy Chinese individuals.
Research methods
We retrospectively analyzed 414 healthy subjects aged 35-91 years who were enrolled between September 2007 and June 2008. All subjects underwent standard 12-lead electrocardiography(ECG) and comprehensive echocardiography. ECG and echocardiography results were analyzed separately and in a blinded fashion. Correlation and regression analyses were applied to determine associations. This study is a community-based cross-sectional study.
Research results
Our research found that even in healthy people, ventricular repolarization variables are associated with cardiac diastolic function parameters. Furthermore, moderate levels of the QTc interval tend to have a protective effect on diastolic dysfunction in men.
Research conclusions
Repolarization variables are associated with cardiac diastolic function even in healthy people.Electromechanical coupling may represent a relationship between heterogeneity of repolarization and abnormal myocardial mechanics.
Research perspectives
We observed an independent association between ventricular repolarization variables and cardiac diastolic function in a community-based cross-sectional study. However, a relatively low number of subjects were included in the study, and the cross-sectional study has its own shortcomings. A longitudinally designed study is required to confirm the current findings.
杂志排行

World Journal of Clinical Cases的其它文章
- Exosomes in esophageal cancer: A review on tumorigenesis,diagnosis and therapeutic potential
- Food additives can act as triggering factors in celiac disease:Current knowledge based on a critical review of the literature
- Optimal use of fielder XT guidewire enhances the success rate of chronic total occlusion percutaneous coronary intervention
- Non-invasive home lung impedance monitoring in early post-acute heart failure discharge: Three case reports
- Bilateral adrenocortical adenomas causing adrenocorticotropic hormone-independent Cushing’s syndrome: A case report and review of the literature
- Two case reports and literature review for hepatic epithelioid angiomyolipoma: Pitfall of misdiagnosis